| Param | Original file | Final file |
|---|---|---|
| Filename | modeM0/AS1G07_022T02_9000001434_10025cztM0_level2.evt | modeM0/AS1G07_022T02_9000001434_10025cztM0_level2_quad_clean.evt |
| Size (bytes) | 397,909,440 | 68,970,240 |
| Size | 379.5 MB | 65.8 MB |
| Events in quadrant A | 2,321,688 | 457,826 |
| Events in quadrant B | 4,289,902 | 388,517 |
| Events in quadrant C | 2,254,352 | 477,590 |
| Events in quadrant D | 2,853,055 | 423,294 |
| Mode M0 | |||
|---|---|---|---|
| Quadrant | BADHDUFLAG | Total packets | Discarded packets |
| A | 0 | 32156 | 21828 |
| B | 0 | 42224 | 26406 |
| C | 0 | 32122 | 21822 |
| D | 0 | 40258 | 28882 |
| Mode M9 | |||
|---|---|---|---|
| Quadrant | BADHDUFLAG | Total packets | Discarded packets |
| A | 0 | 23 | 13 |
| B | 0 | 25 | 14 |
| C | 0 | 23 | 12 |
| D | 0 | 22 | 10 |
| Mode SS | |||
|---|---|---|---|
| Quadrant | BADHDUFLAG | Total packets | Discarded packets |
| A | 0 | 319 | 221 |
| B | 0 | 321 | 229 |
| C | 0 | 322 | 206 |
| D | 0 | 321 | 223 |
| Quadrant | Total seconds | Saturated seconds | Saturation percentage |
|---|---|---|---|
| A | 5050 | 45 | 0.891089% |
| B | 4476 | 687 | 15.348525% |
| C | 5059 | 43 | 0.849970% |
| D | 4718 | 78 | 1.653243% |
Noise dominated data is calculated using 1-second bins in cleaned event files. If a bin has >2000 counts, and if more than 50% of those come from <1% of pixels, then it is considered to be noise-dominated and hence unusable.
| Quadrant | # 1 sec bins | Bins with >0 counts | Bins with >2000 counts | High rate bins dominated by noise | Noise dominated (total time) | Noise dominated (detector-on time) | Marked lightcurve |
|---|---|---|---|---|---|---|---|
| A | 18291 | 6351 | 0 | 0 | 0.00% | 0.00% | 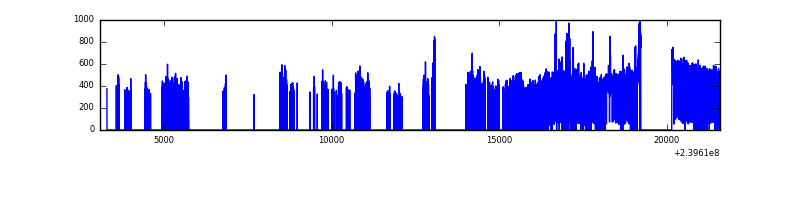 |
| B | 18105 | 5819 | 382 | 382 | 2.11% | 6.56% | 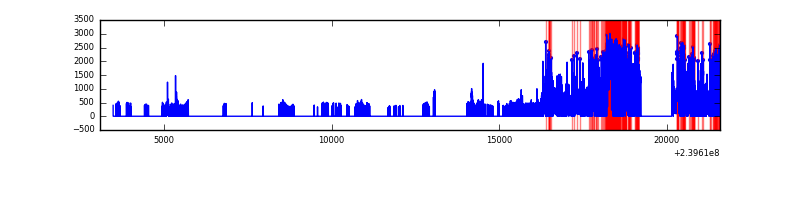 |
| C | 18498 | 6308 | 0 | 0 | 0.00% | 0.00% | 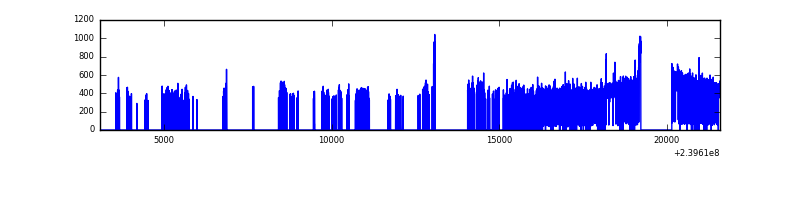 |
| D | 18036 | 5965 | 12 | 12 | 0.07% | 0.20% | 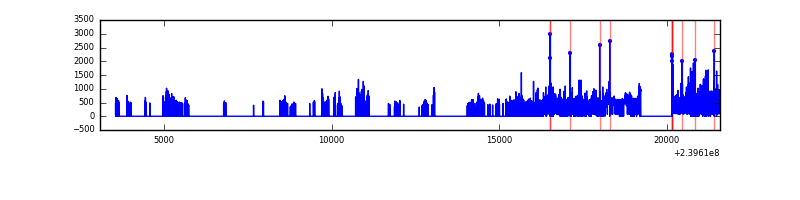 |
Top three noisy pixels from each quadrant. If the there are fewer than three noisy pixels in the level2.evt file, extra rows are filled as -1
| Pixel properties | Quadrant properties | ||||||
|---|---|---|---|---|---|---|---|
| Quadrant | DetID | PixID | Counts | Sigma | Mean | Median | Sigma |
| A | 8 | 15 | 52225 | 429.42 | 583 | 570 | 120.3 |
| A | 15 | 239 | 21077 | 170.48 | 583 | 570 | 120.3 |
| A | 0 | 226 | 5361 | 39.83 | 583 | 570 | 120.3 |
| B | 4 | 81 | 2261090 | 23699.22 | 496 | 484 | 95.4 |
| B | 0 | 214 | 30706 | 316.83 | 496 | 484 | 95.4 |
| B | 0 | 187 | 16864 | 171.72 | 496 | 484 | 95.4 |
| C | 14 | 67 | 15476 | 111.4 | 572 | 574 | 133.8 |
| C | 13 | 61 | 4271 | 27.64 | 572 | 574 | 133.8 |
| C | 8 | 128 | 4093 | 26.31 | 572 | 574 | 133.8 |
| D | 8 | 195 | 403700 | 3077.28 | 528 | 515 | 131.0 |
| D | 1 | 52 | 266348 | 2028.95 | 528 | 515 | 131.0 |
| D | 2 | 16 | 77501 | 587.59 | 528 | 515 | 131.0 |
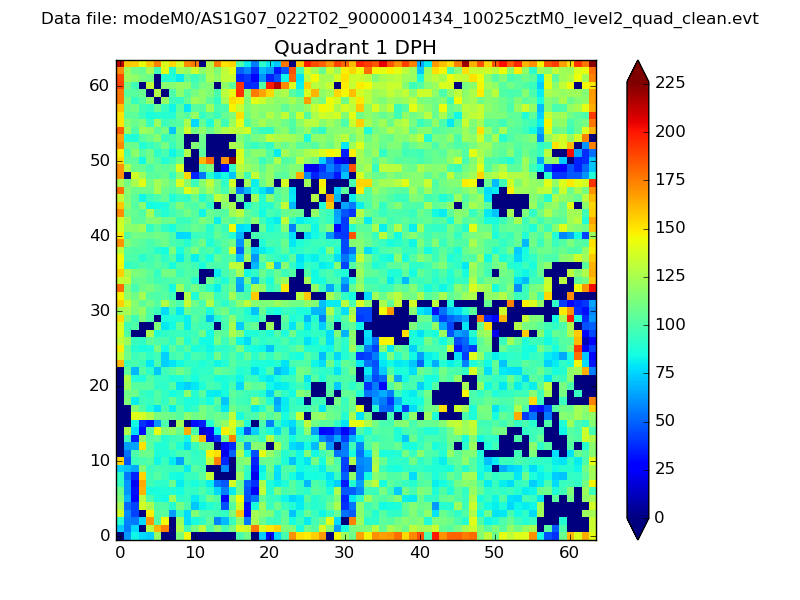
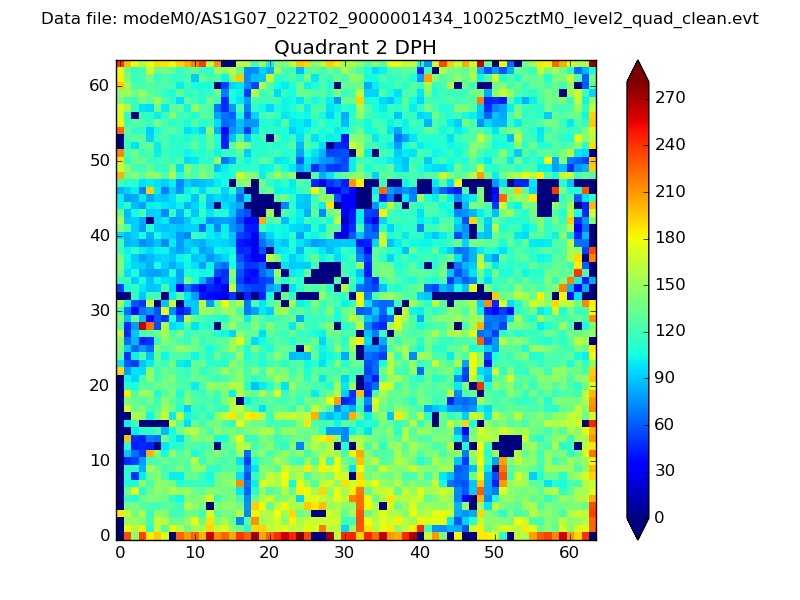
Histogram calculated using DETX and DETY for each event in the final _common_clean file
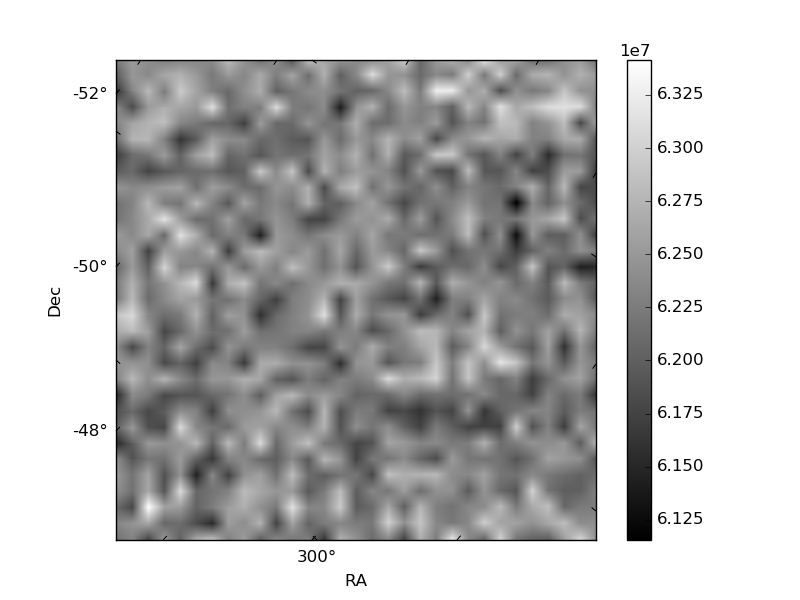
| Quadrant A |  |
 |
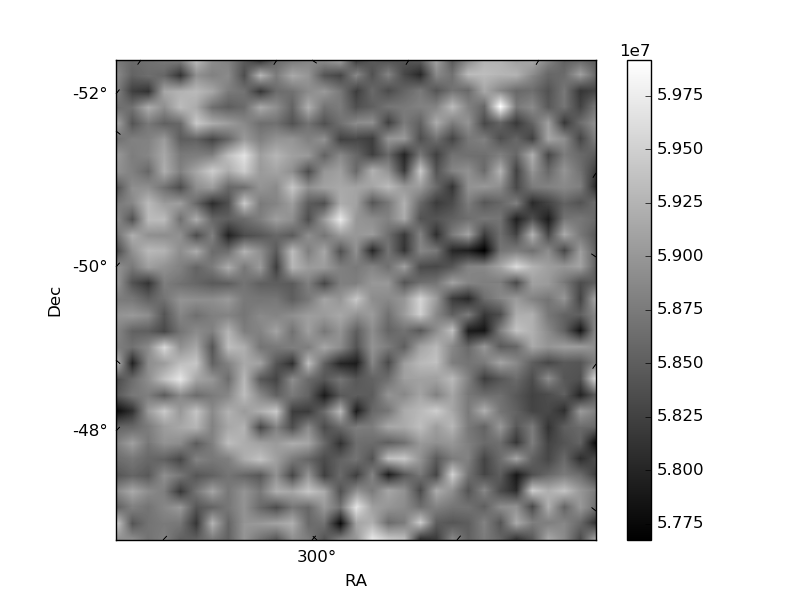
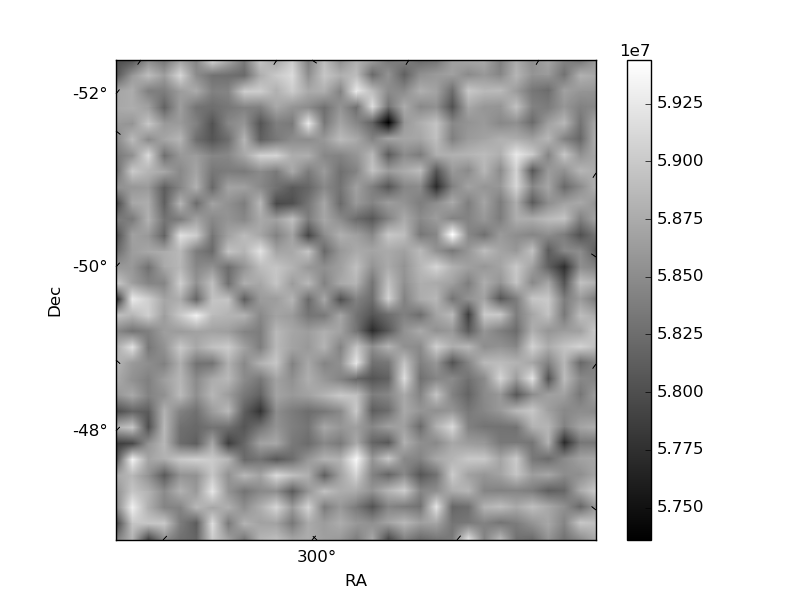
Quadrant B |
|---|---|---|---|
| Quadrant D | 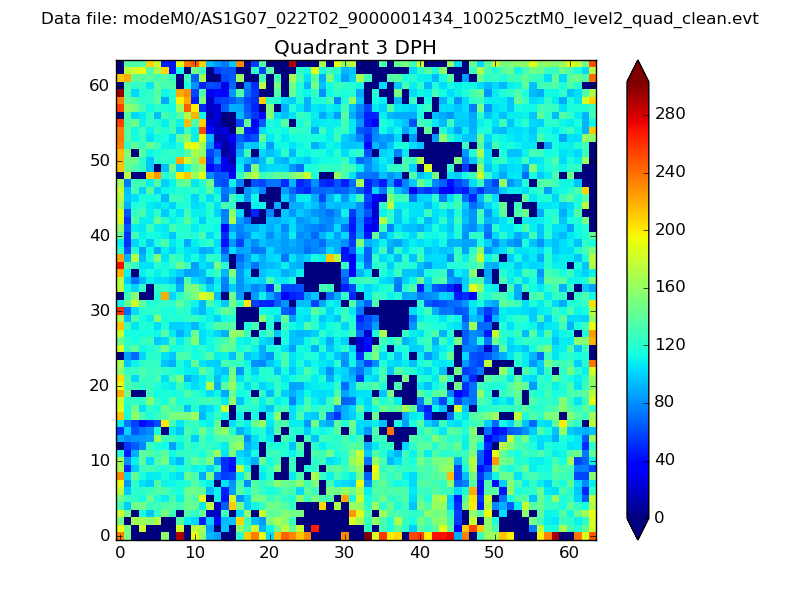 |
 |
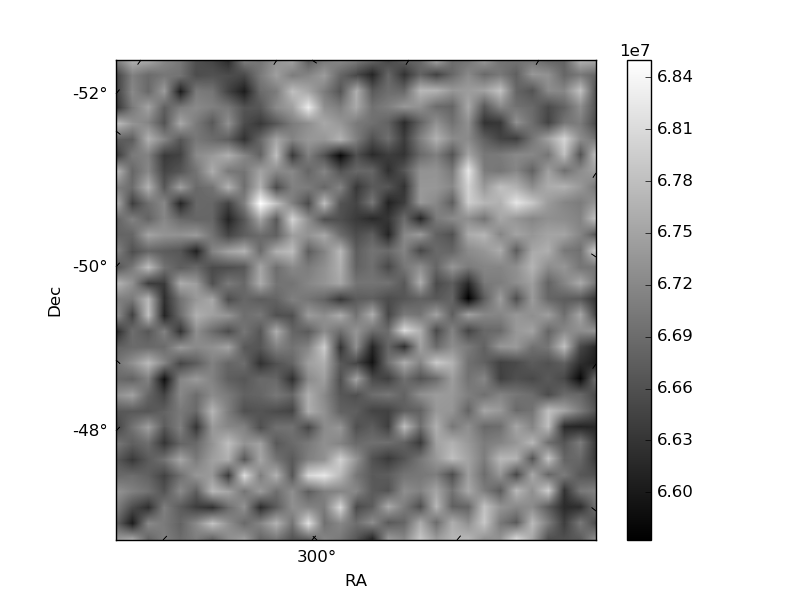
Quadrant C |
| Plot type | Count rate plots | Images |
|---|---|---|
| Comparison with Poisson distribution Blue bars denote a histogram of data divided into 1 sec bins. Red curve is a Poisson curve with rate = median count rate of data. |
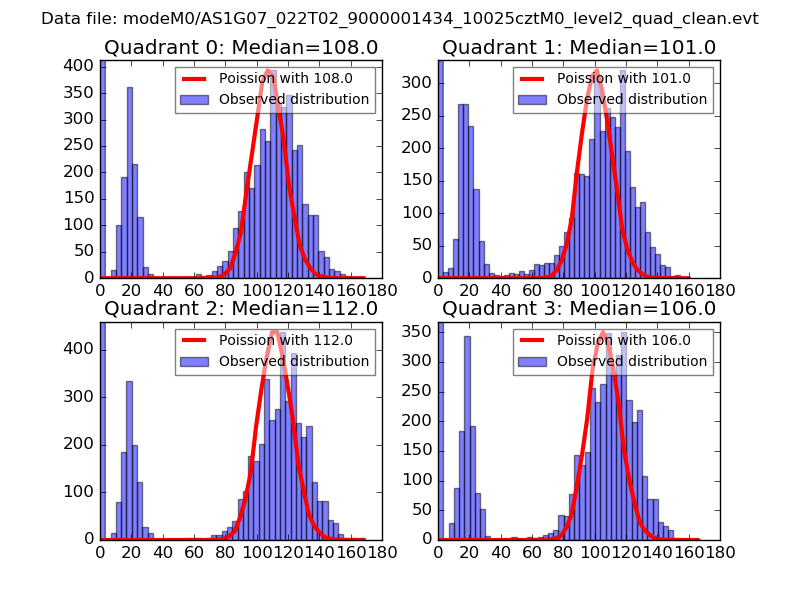 |
 |
| Quadrant-wise count rates Data is divided into 100 sec bins |
 |
|
| Module-wise count rates for Quadrant A Data is divided into 100 sec bins |
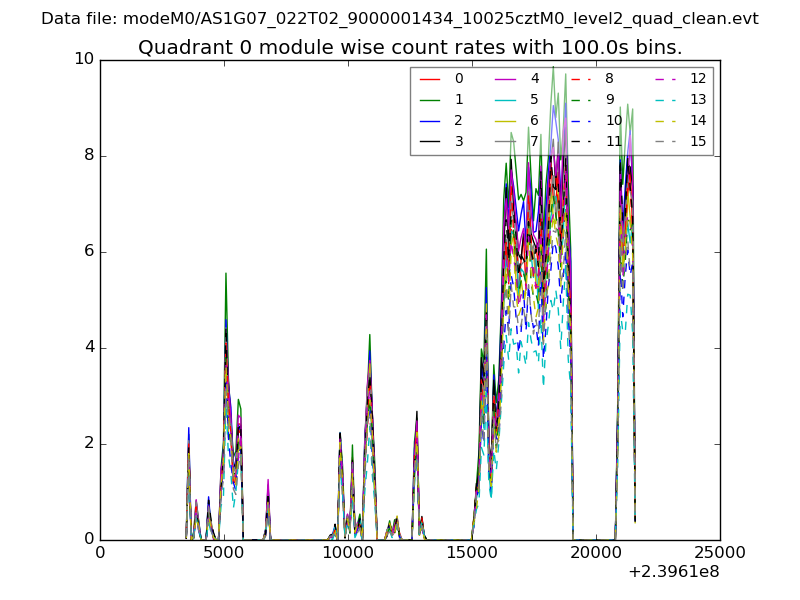 |
 |
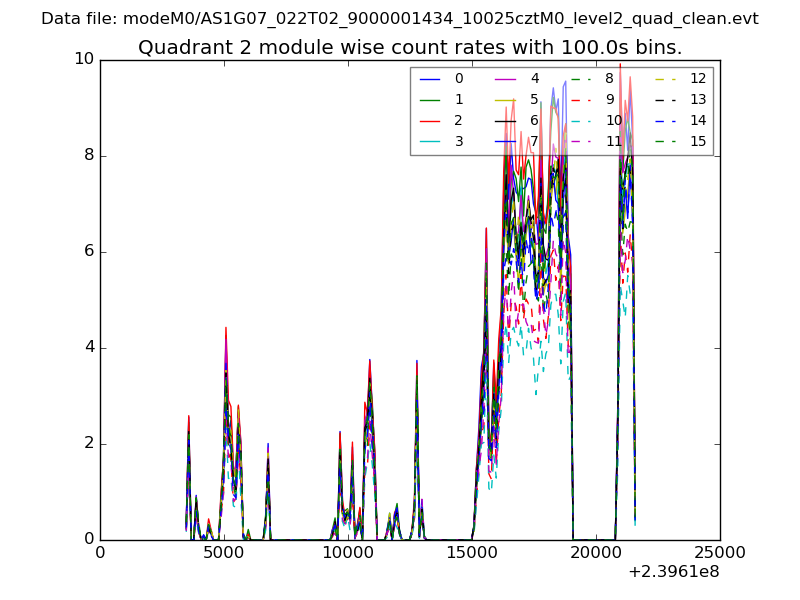
| Module-wise count rates for Quadrant B Data is divided into 100 sec bins |
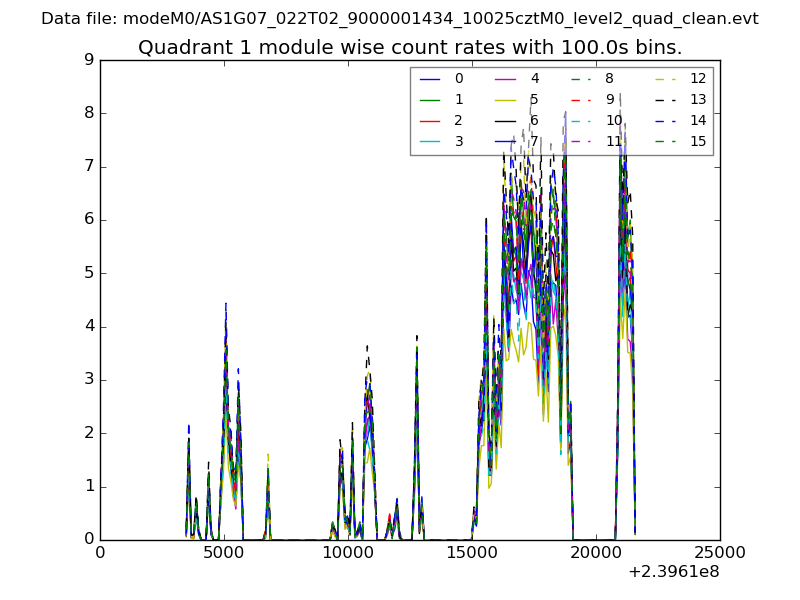 |
 |
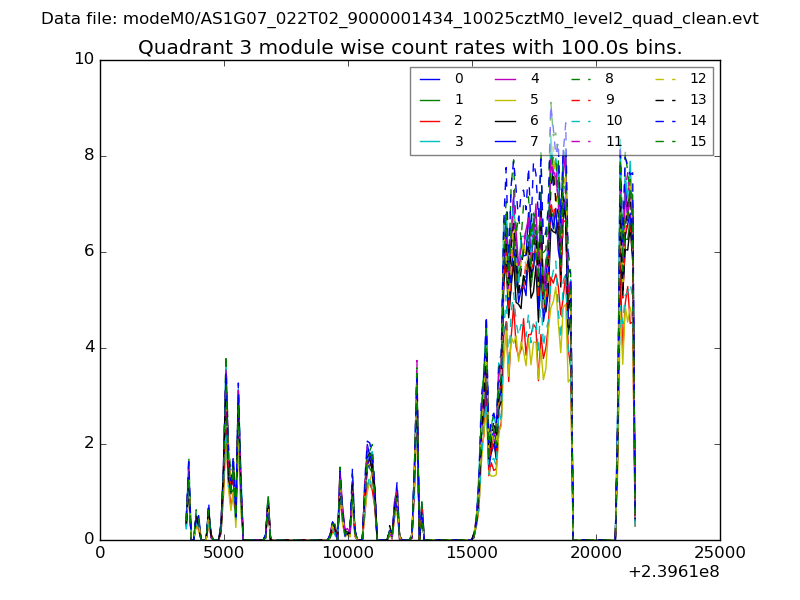
| Module-wise count rates for Quadrant C Data is divided into 100 sec bins |
 |
 |
| Module-wise count rates for Quadrant D Data is divided into 100 sec bins |
 |
 |
| Parameter | Plot |
|---|---|
| CZT HV Monitor | 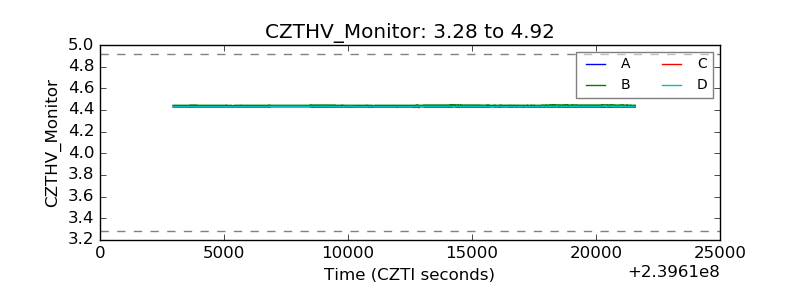 |
| D_VDD | 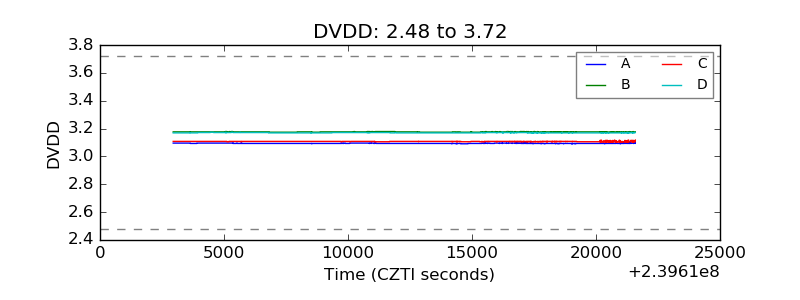 |
| Temperature 1 | 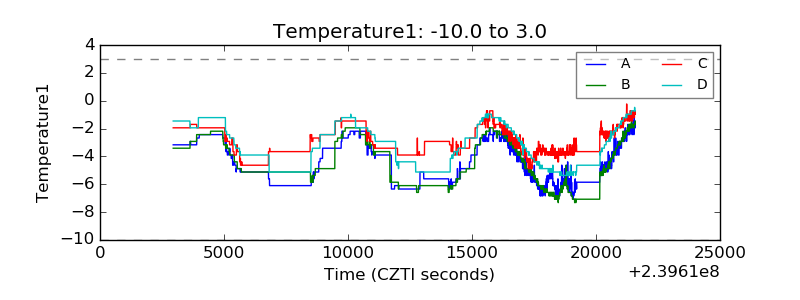 |
| Veto HV Monitor |  |
| Veto LLD |  |
| Alpha Counter | 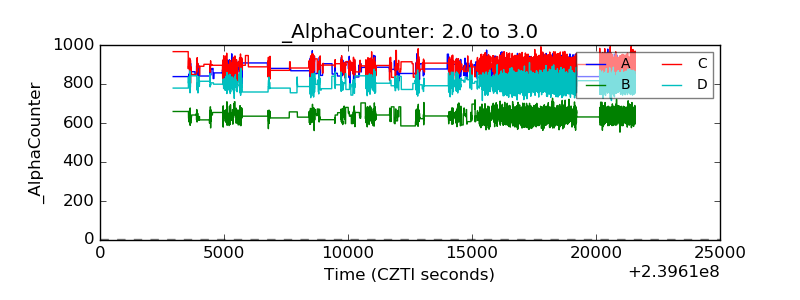 |
| _CPM_Rate | 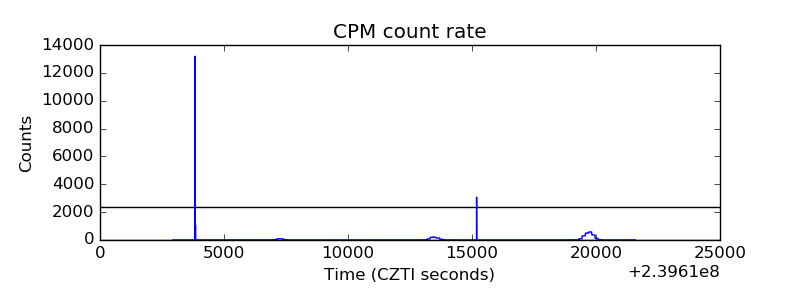 |
| CZT Counter | 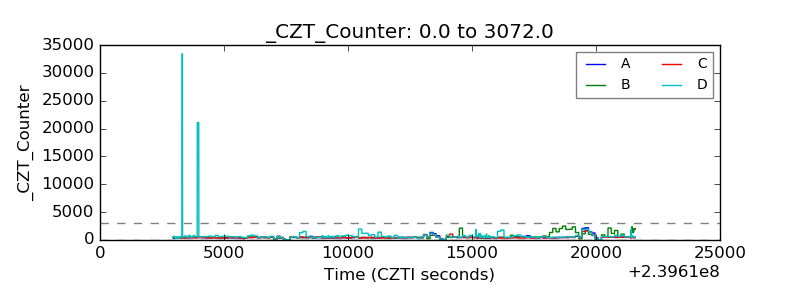 |
| +2.5 Volts monitor |  |
| +5 Volts monitor |  |
| _ROLL_ROT | 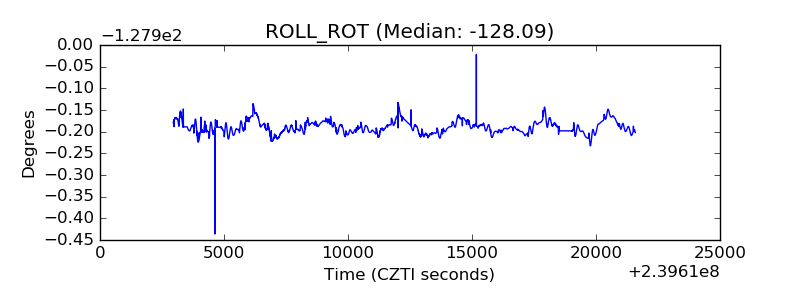 |
| _Roll_DEC | 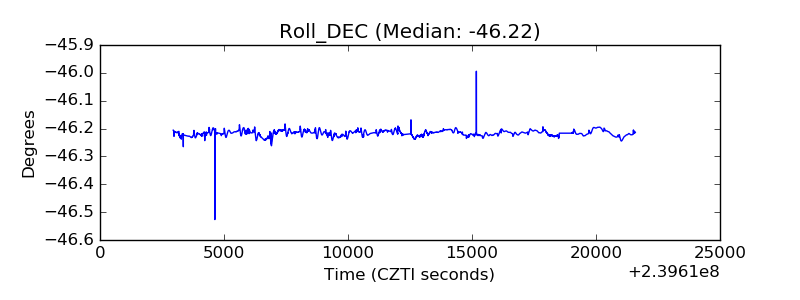 |
| _Roll_RA |  |
| Veto Counter | 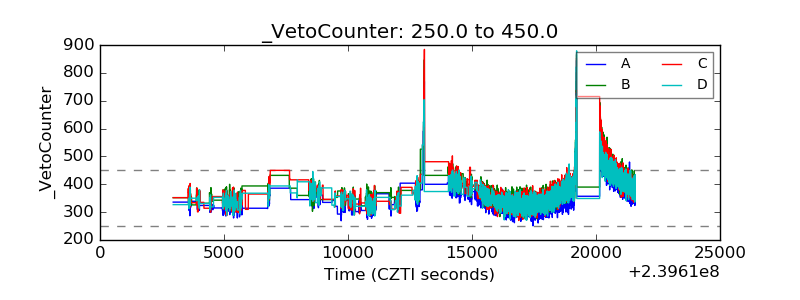 |