| Param | Original file | Final file |
|---|---|---|
| Filename | modeM0/AS1G07_022T02_9000001434_10028cztM0_level2.evt | modeM0/AS1G07_022T02_9000001434_10028cztM0_level2_quad_clean.evt |
| Size (bytes) | 2,415,553,920 | 457,560,000 |
| Size | 2.2 GB | 436.4 MB |
| Events in quadrant A | 15,206,706 | 2,892,249 |
| Events in quadrant B | 19,592,253 | 2,889,507 |
| Events in quadrant C | 14,715,870 | 2,981,696 |
| Events in quadrant D | 21,410,444 | 2,825,399 |
| Mode M0 | |||
|---|---|---|---|
| Quadrant | BADHDUFLAG | Total packets | Discarded packets |
| A | 0 | 69573 | 1078 |
| B | 0 | 82516 | 1603 |
| C | 0 | 68666 | 1119 |
| D | 0 | 86745 | 1417 |
| Mode M9 | |||
|---|---|---|---|
| Quadrant | BADHDUFLAG | Total packets | Discarded packets |
| A | 0 | 50 | 1 |
| B | 0 | 50 | 0 |
| C | 0 | 50 | 0 |
| D | 0 | 50 | 1 |
| Mode SS | |||
|---|---|---|---|
| Quadrant | BADHDUFLAG | Total packets | Discarded packets |
| A | 0 | 680 | 6 |
| B | 0 | 680 | 10 |
| C | 0 | 680 | 10 |
| D | 0 | 680 | 20 |
| Quadrant | Total seconds | Saturated seconds | Saturation percentage |
|---|---|---|---|
| A | 33082 | 412 | 1.245390% |
| B | 33016 | 1665 | 5.043009% |
| C | 33056 | 290 | 0.877299% |
| D | 33039 | 750 | 2.270044% |
Noise dominated data is calculated using 1-second bins in cleaned event files. If a bin has >2000 counts, and if more than 50% of those come from <1% of pixels, then it is considered to be noise-dominated and hence unusable.
| Quadrant | # 1 sec bins | Bins with >0 counts | Bins with >2000 counts | High rate bins dominated by noise | Noise dominated (total time) | Noise dominated (detector-on time) | Marked lightcurve |
|---|---|---|---|---|---|---|---|
| A | 38440 | 33321 | 56 | 56 | 0.15% | 0.17% | 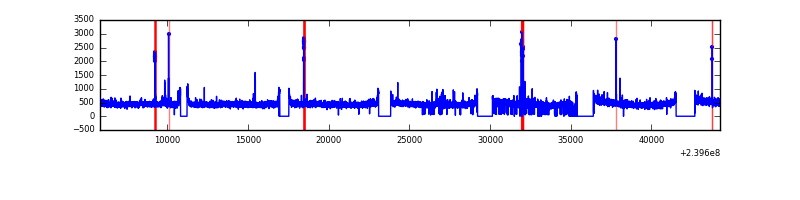 |
| B | 38440 | 33267 | 869 | 869 | 2.26% | 2.61% | 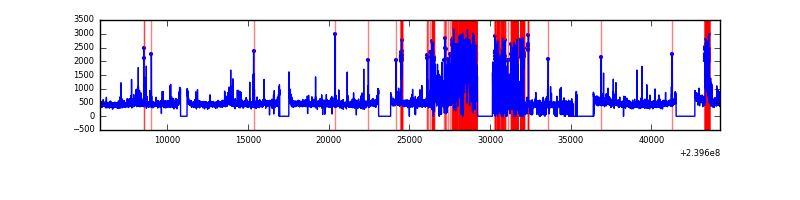 |
| C | 38440 | 33328 | 2 | 2 | 0.01% | 0.01% | 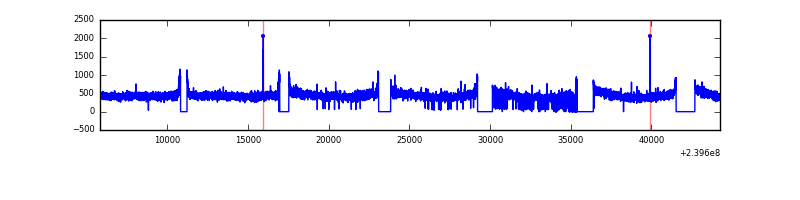 |
| D | 38440 | 33337 | 381 | 381 | 0.99% | 1.14% | 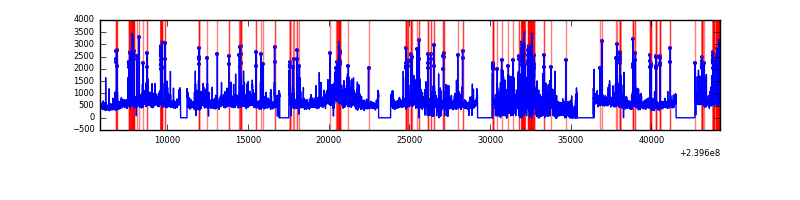 |
Top three noisy pixels from each quadrant. If the there are fewer than three noisy pixels in the level2.evt file, extra rows are filled as -1
| Pixel properties | Quadrant properties | ||||||
|---|---|---|---|---|---|---|---|
| Quadrant | DetID | PixID | Counts | Sigma | Mean | Median | Sigma |
| A | 8 | 15 | 229560 | 294.27 | 3810 | 3726 | 767.4 |
| A | 15 | 239 | 178911 | 228.27 | 3810 | 3726 | 767.4 |
| A | 15 | 174 | 101015 | 126.77 | 3810 | 3726 | 767.4 |
| B | 4 | 81 | 4124624 | 5794.66 | 3781 | 3693 | 711.2 |
| B | 0 | 214 | 214885 | 296.97 | 3781 | 3693 | 711.2 |
| B | 0 | 187 | 123810 | 168.9 | 3781 | 3693 | 711.2 |
| C | 14 | 67 | 143856 | 162.85 | 3729 | 3751 | 860.4 |
| C | 13 | 61 | 27572 | 27.69 | 3729 | 3751 | 860.4 |
| C | 8 | 222 | 17172 | 15.6 | 3729 | 3751 | 860.4 |
| D | 8 | 195 | 2820520 | 3099.46 | 3678 | 3577 | 908.9 |
| D | 2 | 16 | 2121562 | 2330.4 | 3678 | 3577 | 908.9 |
| D | 1 | 52 | 1426030 | 1565.11 | 3678 | 3577 | 908.9 |
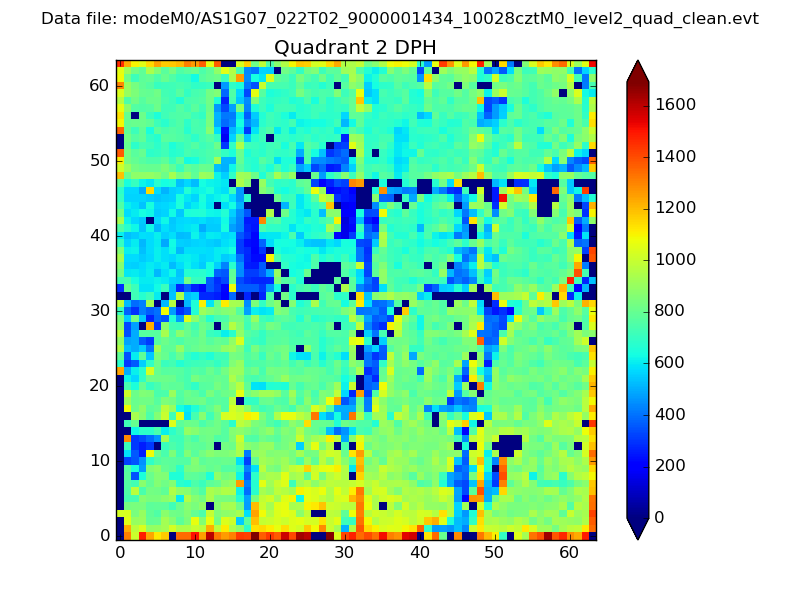
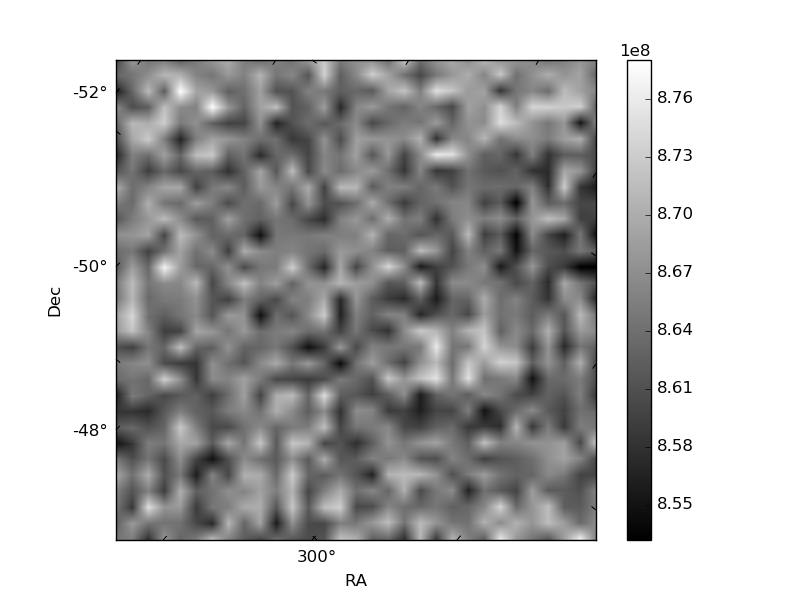
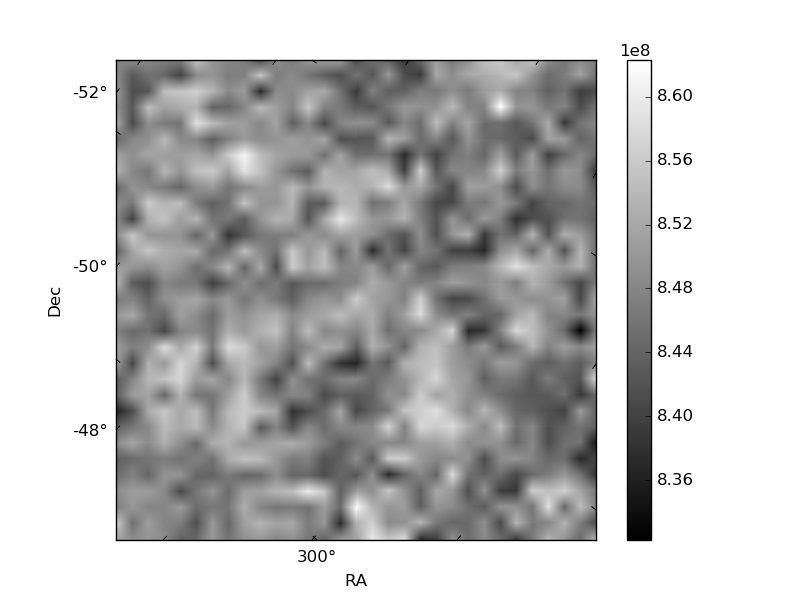
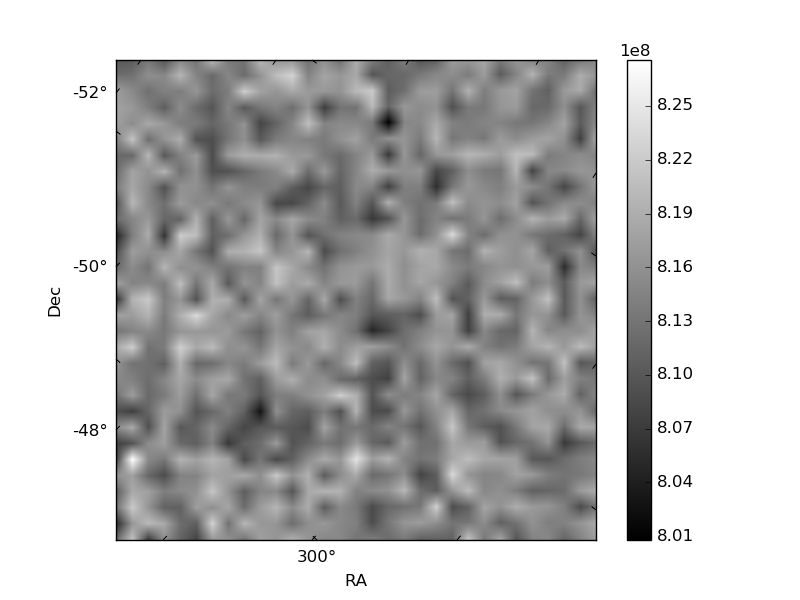
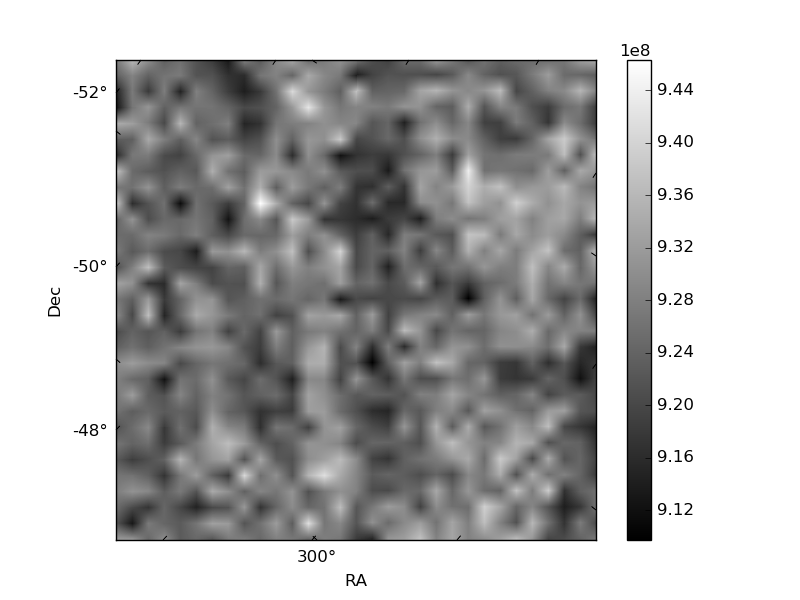
Histogram calculated using DETX and DETY for each event in the final _common_clean file
| Quadrant A |  |
 |
Quadrant B |
|---|---|---|---|
| Quadrant D | 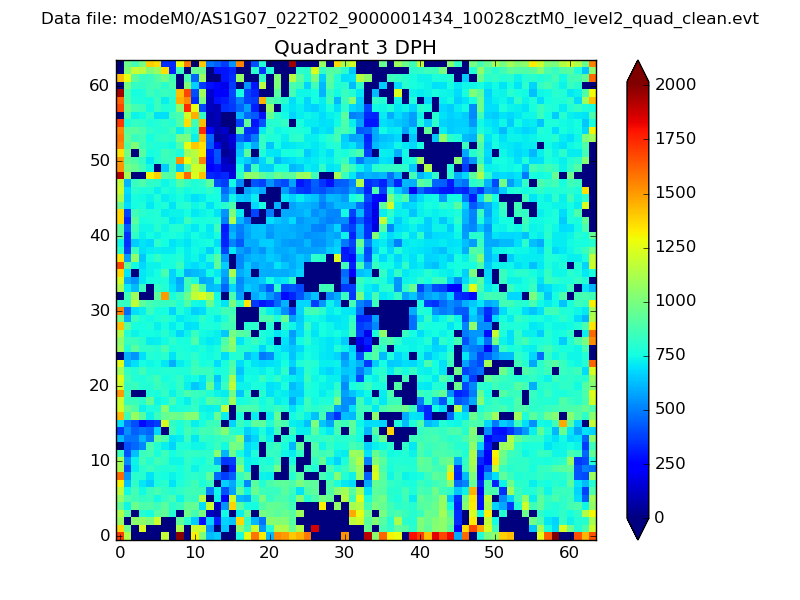 |
 |
Quadrant C |
| Plot type | Count rate plots | Images |
|---|---|---|
| Comparison with Poisson distribution Blue bars denote a histogram of data divided into 1 sec bins. Red curve is a Poisson curve with rate = median count rate of data. |
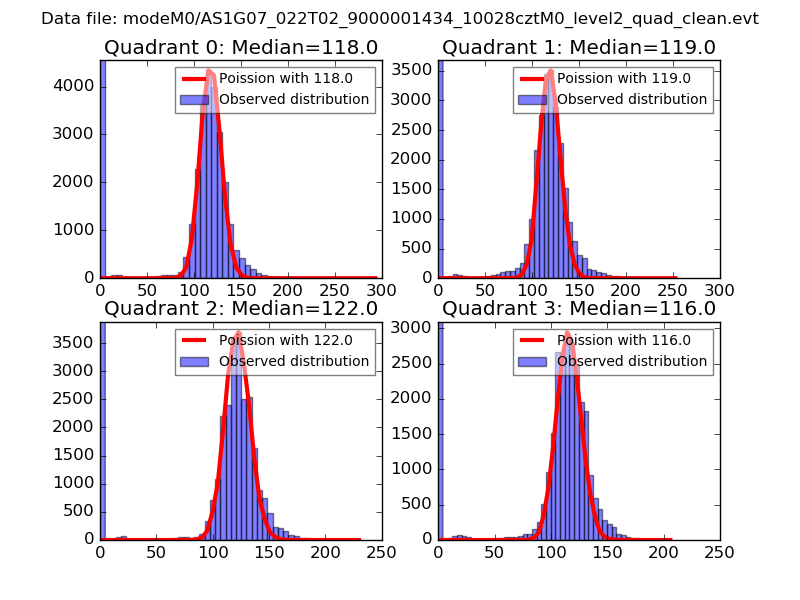 |
 |
| Quadrant-wise count rates Data is divided into 100 sec bins |
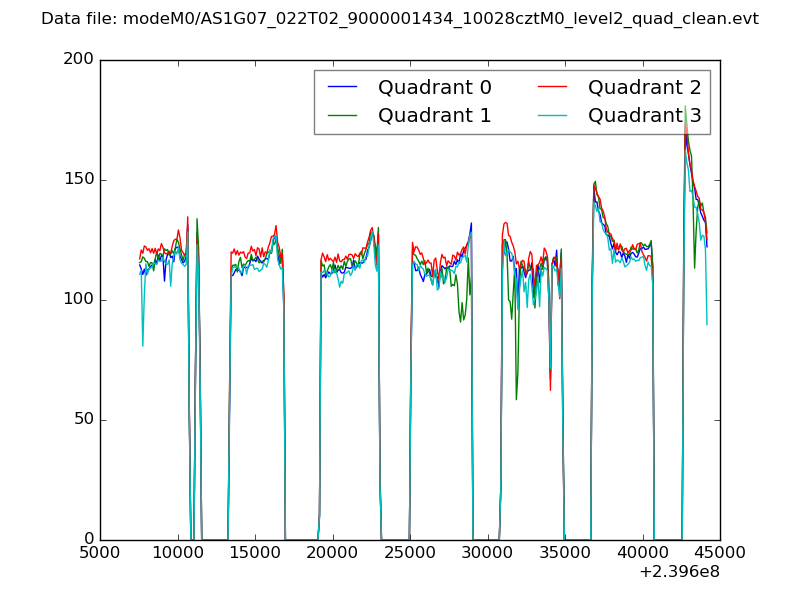 |
|
| Module-wise count rates for Quadrant A Data is divided into 100 sec bins |
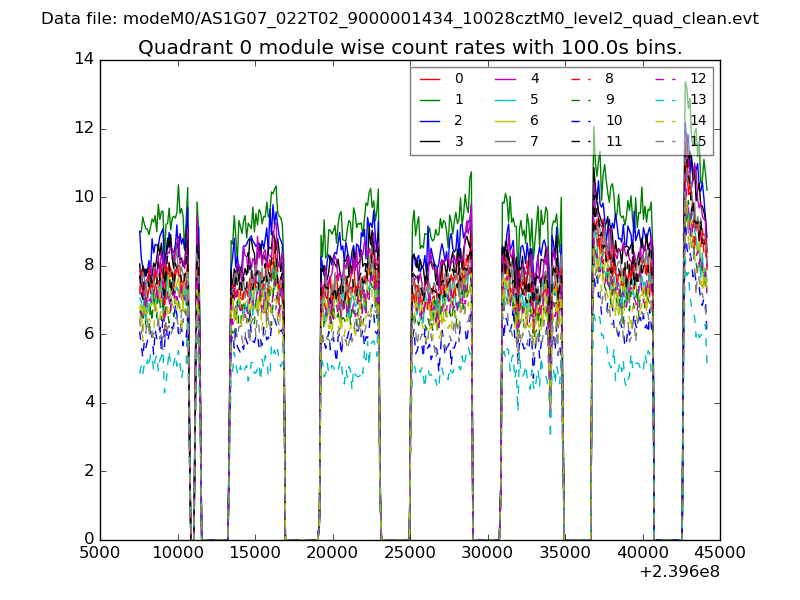 |
 |
| Module-wise count rates for Quadrant B Data is divided into 100 sec bins |
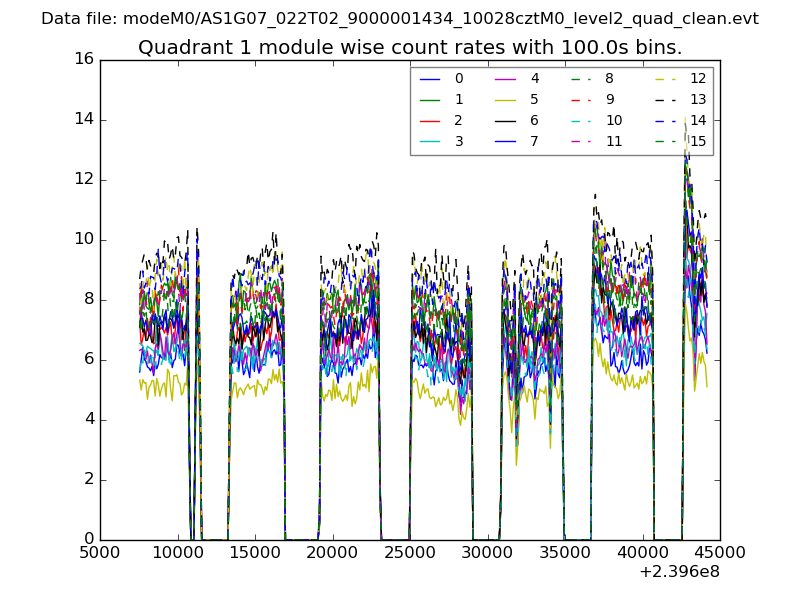 |
 |
| Module-wise count rates for Quadrant C Data is divided into 100 sec bins |
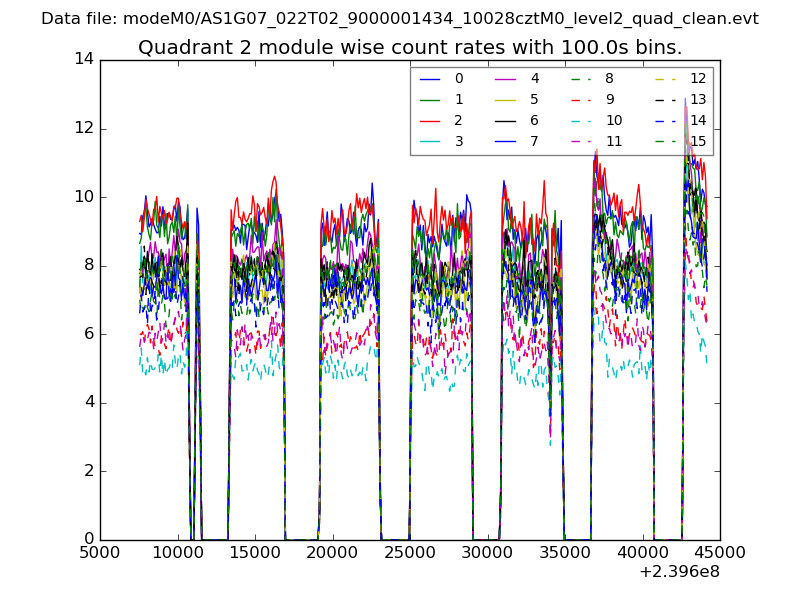 |
 |
| Module-wise count rates for Quadrant D Data is divided into 100 sec bins |
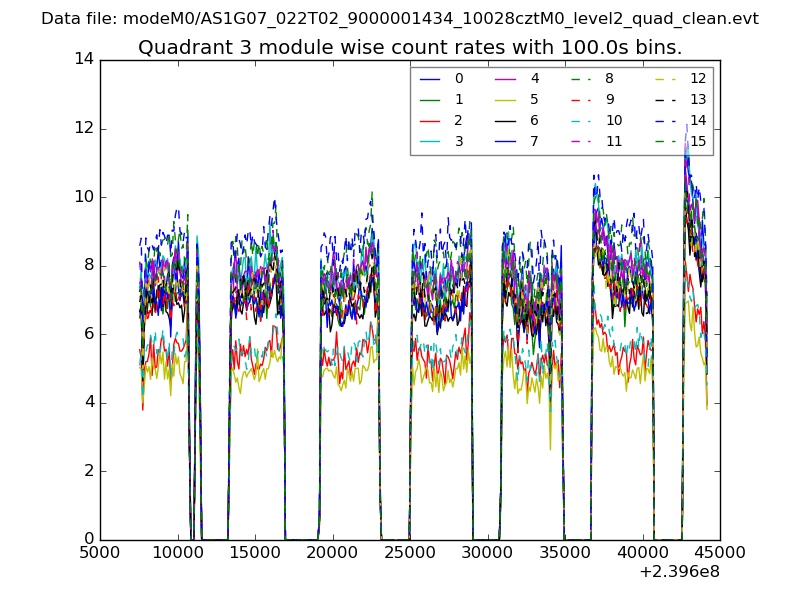 |
 |
| Parameter | Plot |
|---|---|
| CZT HV Monitor | 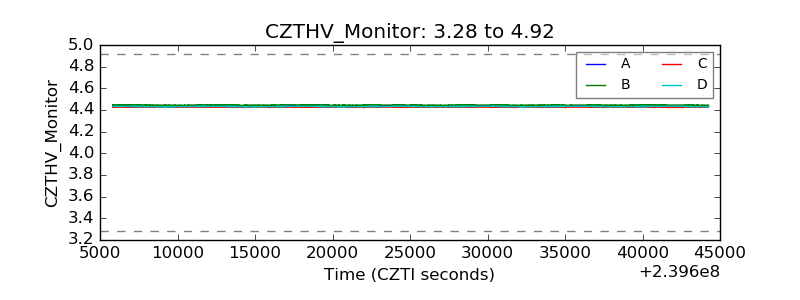 |
| D_VDD | 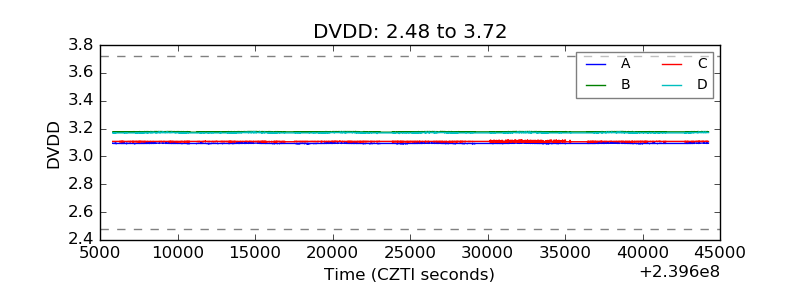 |
| Temperature 1 | 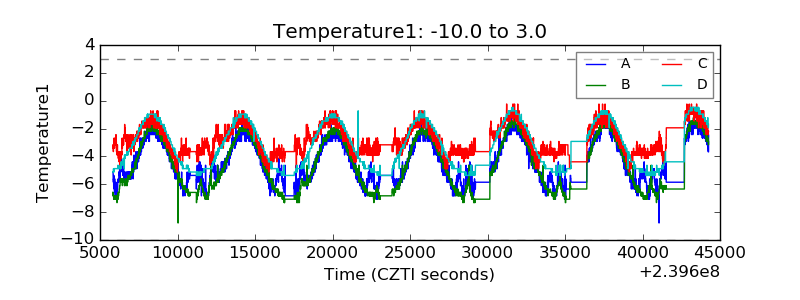 |
| Veto HV Monitor |  |
| Veto LLD | 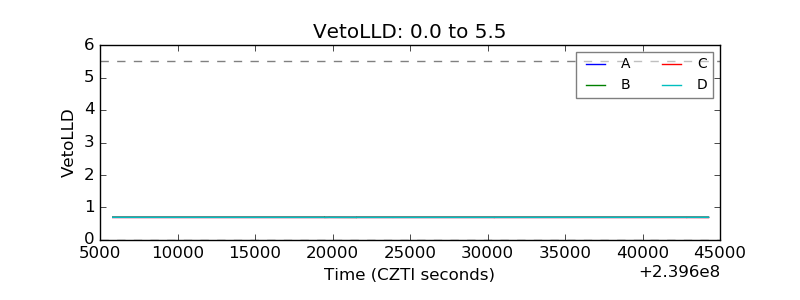 |
| Alpha Counter | 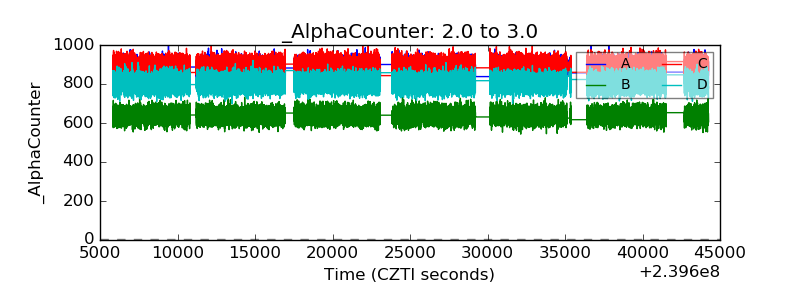 |
| _CPM_Rate |  |
| CZT Counter | 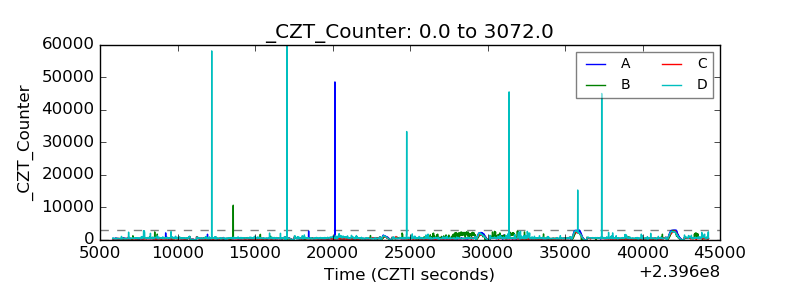 |
| +2.5 Volts monitor | 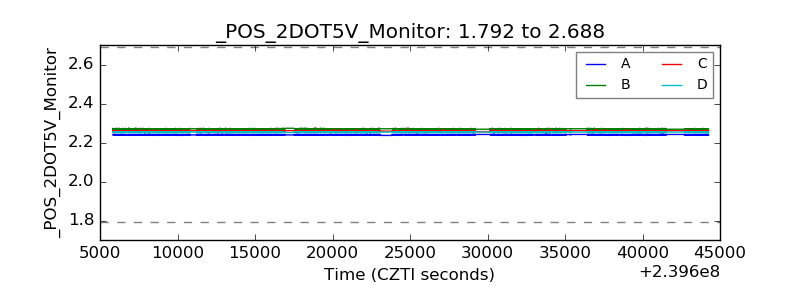 |
| +5 Volts monitor | 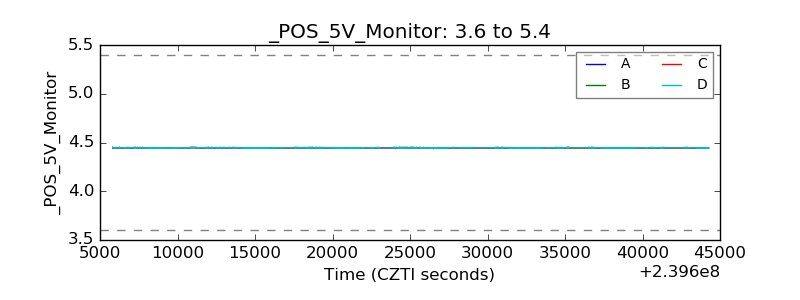 |
| _ROLL_ROT |  |
| _Roll_DEC |  |
| _Roll_RA | 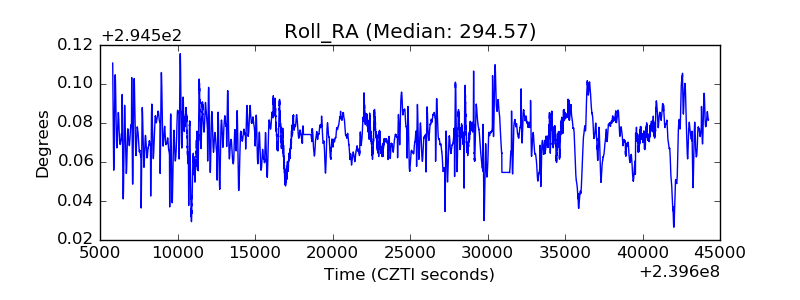 |
| Veto Counter | 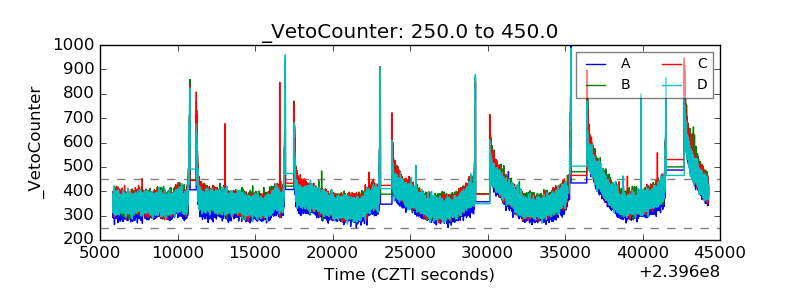 |