| Param | Original file | Final file |
|---|---|---|
| Filename | modeM0/AS1G07_022T02_9000001434_10029cztM0_level2.evt | modeM0/AS1G07_022T02_9000001434_10029cztM0_level2_quad_clean.evt |
| Size (bytes) | 460,532,160 | 99,034,560 |
| Size | 439.2 MB | 94.4 MB |
| Events in quadrant A | 3,090,910 | 651,871 |
| Events in quadrant B | 3,362,493 | 658,054 |
| Events in quadrant C | 2,724,297 | 656,263 |
| Events in quadrant D | 4,363,744 | 615,655 |
| Mode M0 | |||
|---|---|---|---|
| Quadrant | BADHDUFLAG | Total packets | Discarded packets |
| A | 0 | 13263 | 2 |
| B | 0 | 14033 | 1 |
| C | 0 | 12242 | 1 |
| D | 0 | 16989 | 1 |
| Mode M9 | |||
|---|---|---|---|
| Quadrant | BADHDUFLAG | Total packets | Discarded packets |
| A | 0 | 12 | 0 |
| B | 0 | 12 | 0 |
| C | 0 | 12 | 0 |
| D | 0 | 12 | 0 |
| Mode SS | |||
|---|---|---|---|
| Quadrant | BADHDUFLAG | Total packets | Discarded packets |
| A | 0 | 122 | 0 |
| B | 0 | 122 | 0 |
| C | 0 | 122 | 0 |
| D | 0 | 122 | 0 |
| Quadrant | Total seconds | Saturated seconds | Saturation percentage |
|---|---|---|---|
| A | 5973 | 125 | 2.092751% |
| B | 5973 | 230 | 3.850661% |
| C | 5973 | 62 | 1.038004% |
| D | 5973 | 199 | 3.331659% |
Noise dominated data is calculated using 1-second bins in cleaned event files. If a bin has >2000 counts, and if more than 50% of those come from <1% of pixels, then it is considered to be noise-dominated and hence unusable.
| Quadrant | # 1 sec bins | Bins with >0 counts | Bins with >2000 counts | High rate bins dominated by noise | Noise dominated (total time) | Noise dominated (detector-on time) | Marked lightcurve |
|---|---|---|---|---|---|---|---|
| A | 7208 | 5973 | 41 | 41 | 0.57% | 0.69% | 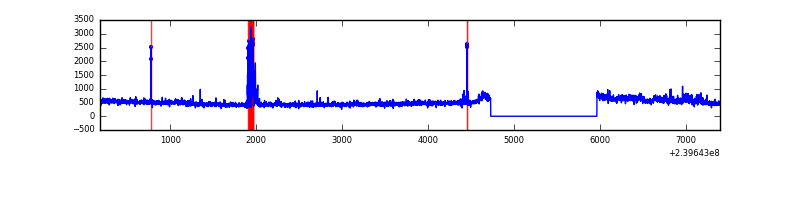 |
| B | 7208 | 5973 | 91 | 91 | 1.26% | 1.52% | 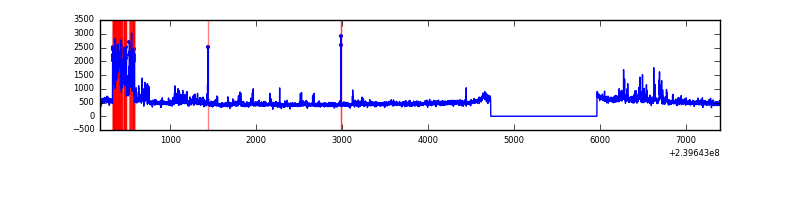 |
| C | 7208 | 5973 | 0 | 0 | 0.00% | 0.00% | 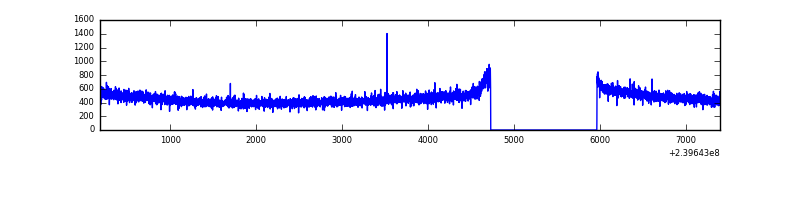 |
| D | 7208 | 5973 | 128 | 128 | 1.78% | 2.14% | 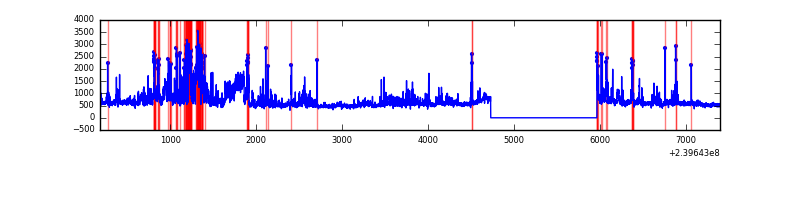 |
Top three noisy pixels from each quadrant. If the there are fewer than three noisy pixels in the level2.evt file, extra rows are filled as -1
| Pixel properties | Quadrant properties | ||||||
|---|---|---|---|---|---|---|---|
| Quadrant | DetID | PixID | Counts | Sigma | Mean | Median | Sigma |
| A | 15 | 174 | 135946 | 925.55 | 722 | 708 | 146.1 |
| A | 8 | 15 | 114154 | 776.41 | 722 | 708 | 146.1 |
| A | 8 | 5 | 58694 | 396.85 | 722 | 708 | 146.1 |
| B | 4 | 81 | 456129 | 3339.94 | 722 | 707 | 136.4 |
| B | 0 | 214 | 45610 | 329.31 | 722 | 707 | 136.4 |
| B | 4 | 239 | 25204 | 179.65 | 722 | 707 | 136.4 |
| C | 13 | 61 | 5409 | 29.3 | 697 | 701 | 160.7 |
| C | 14 | 67 | 3364 | 16.57 | 697 | 701 | 160.7 |
| C | 8 | 222 | 2908 | 13.73 | 697 | 701 | 160.7 |
| D | 2 | 16 | 871060 | 4865.07 | 684 | 669 | 178.9 |
| D | 8 | 195 | 449327 | 2507.78 | 684 | 669 | 178.9 |
| D | 7 | 71 | 281579 | 1570.15 | 684 | 669 | 178.9 |
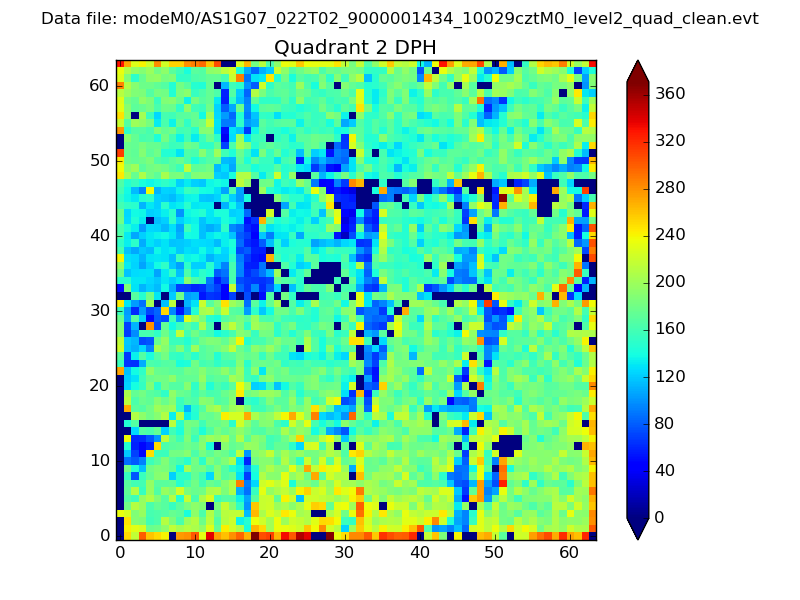
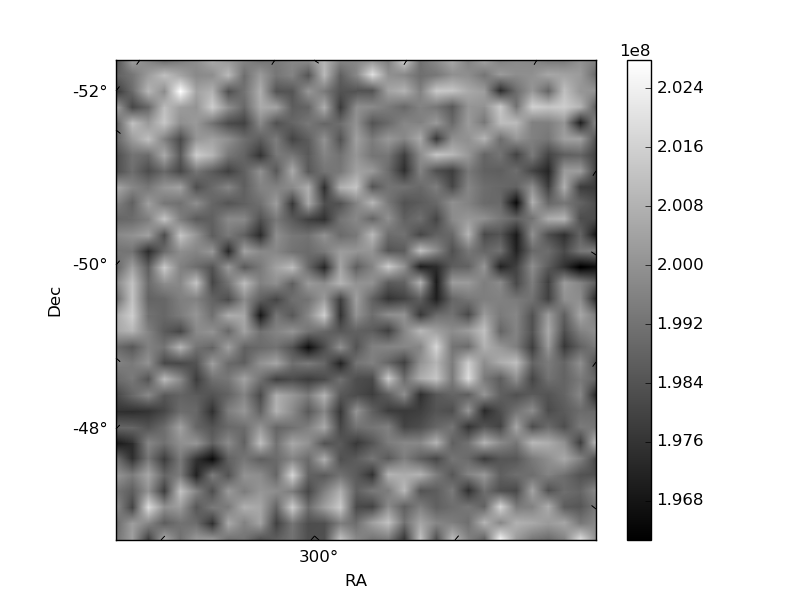
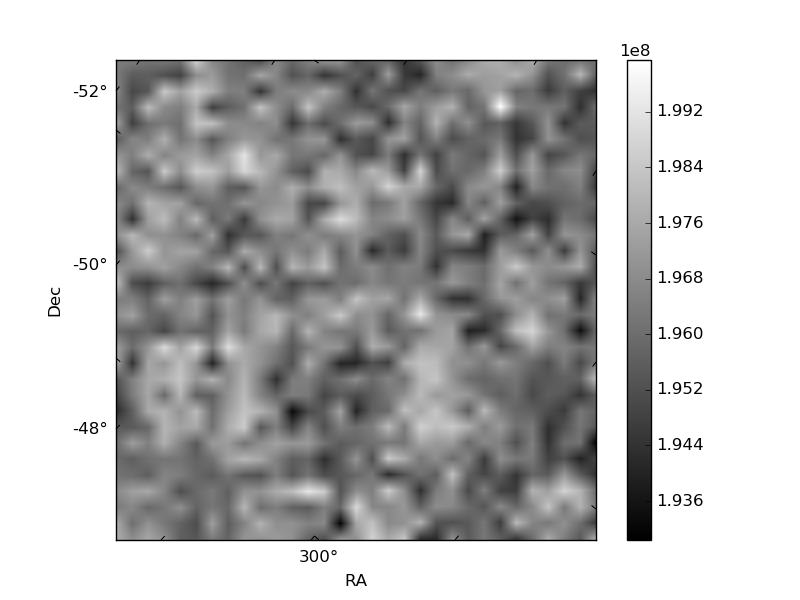
Histogram calculated using DETX and DETY for each event in the final _common_clean file
| Quadrant A | 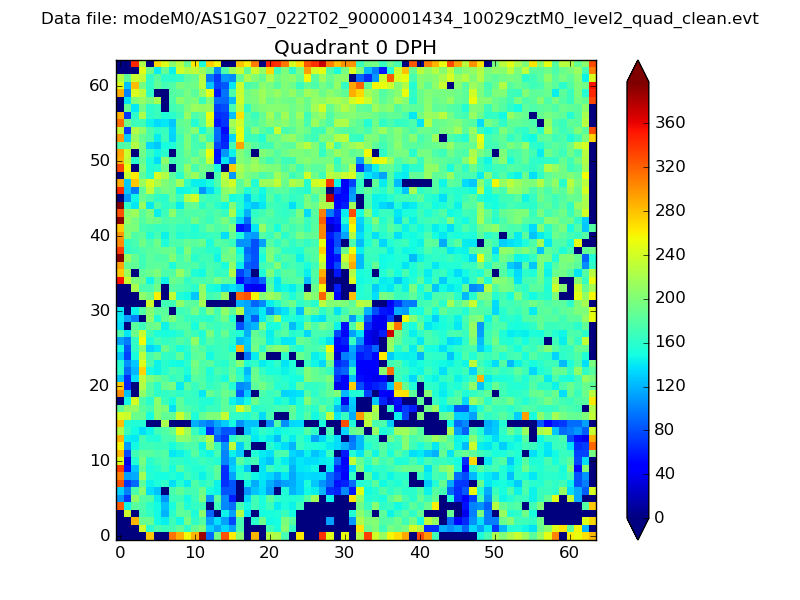 |
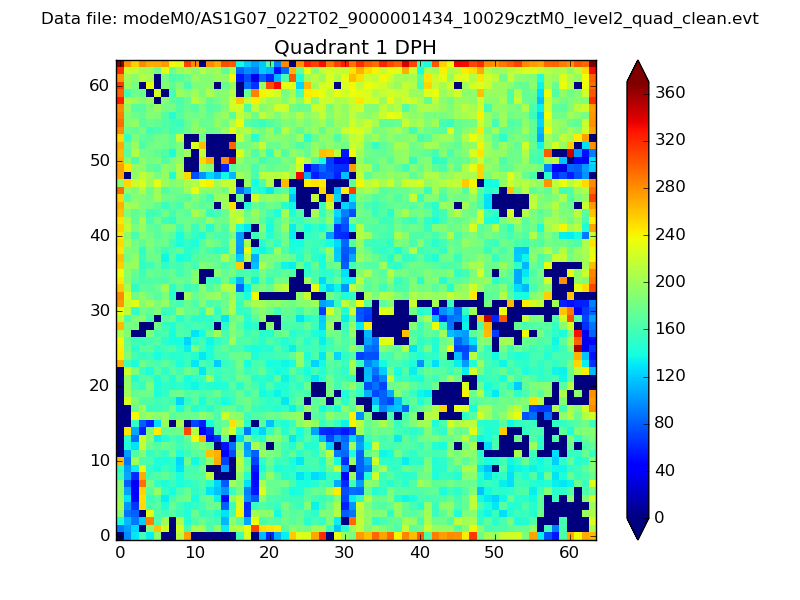 |
Quadrant B |
|---|---|---|---|
| Quadrant D | 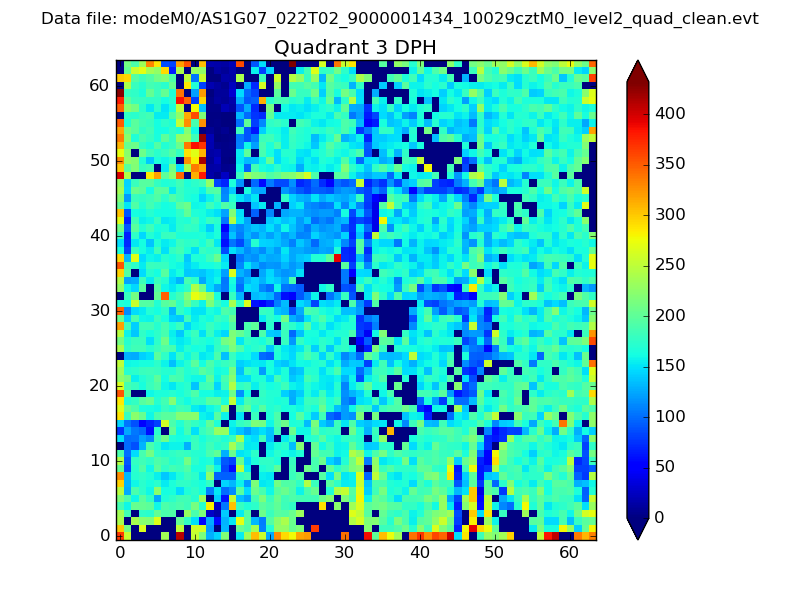 |
 |
Quadrant C |
| Plot type | Count rate plots | Images |
|---|---|---|
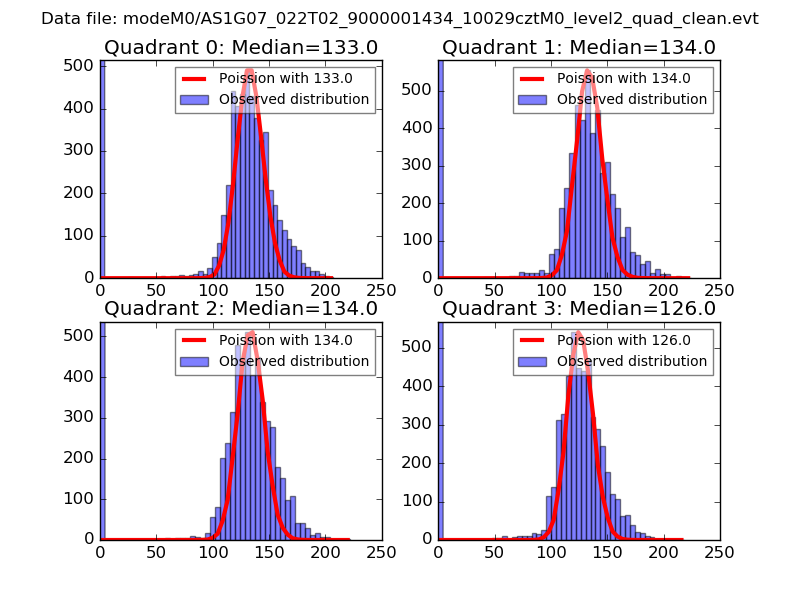
| Comparison with Poisson distribution Blue bars denote a histogram of data divided into 1 sec bins. Red curve is a Poisson curve with rate = median count rate of data. |
 |
 |
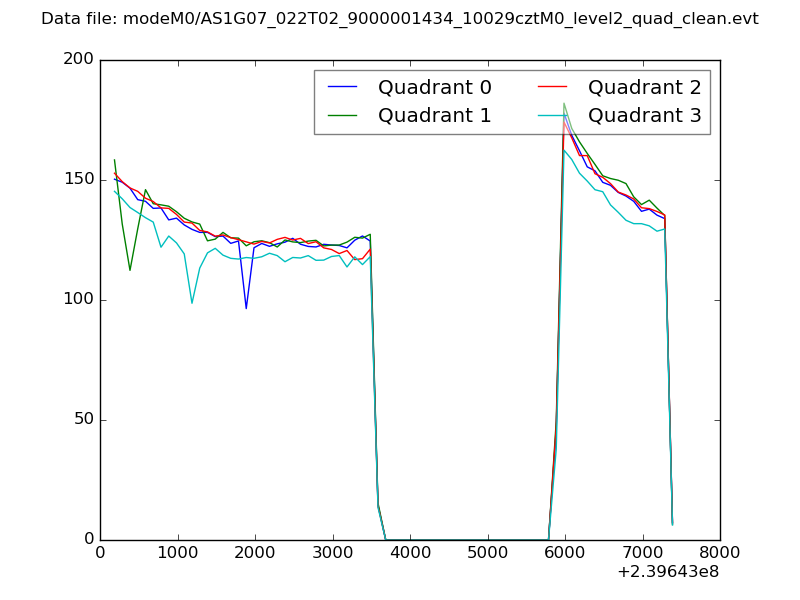
| Quadrant-wise count rates Data is divided into 100 sec bins |
 |
|
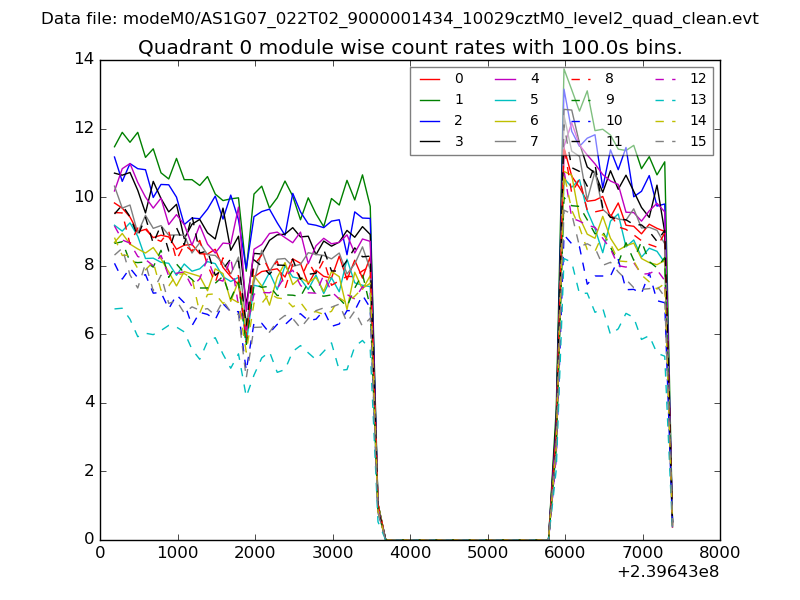
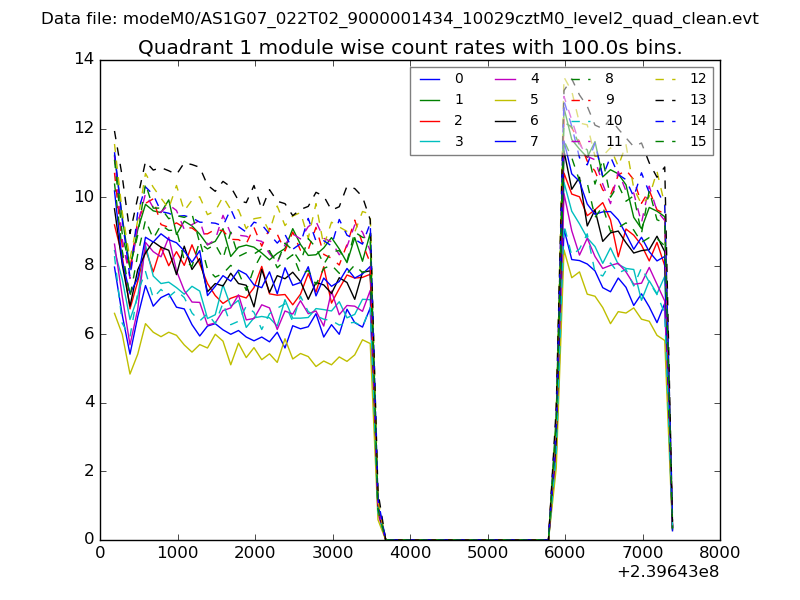
| Module-wise count rates for Quadrant A Data is divided into 100 sec bins |
 |
 |
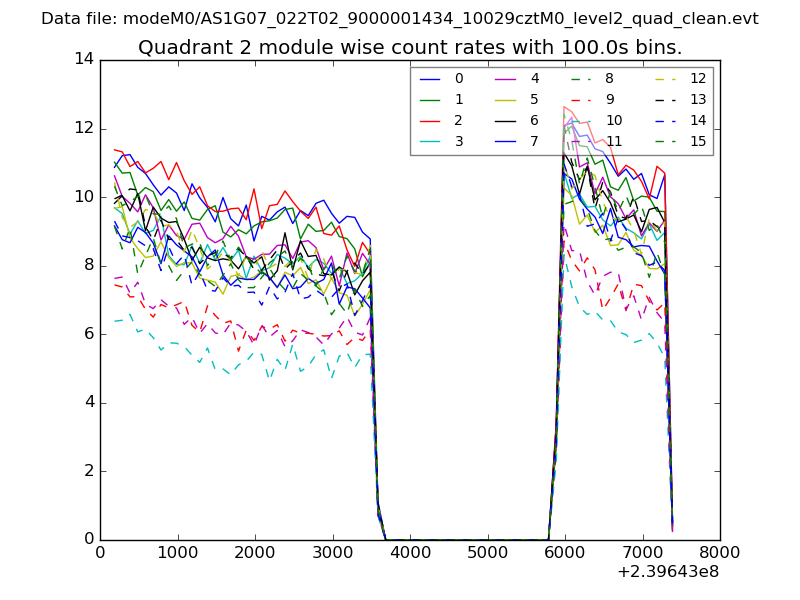
| Module-wise count rates for Quadrant B Data is divided into 100 sec bins |
 |
 |
| Module-wise count rates for Quadrant C Data is divided into 100 sec bins |
 |
 |
| Module-wise count rates for Quadrant D Data is divided into 100 sec bins |
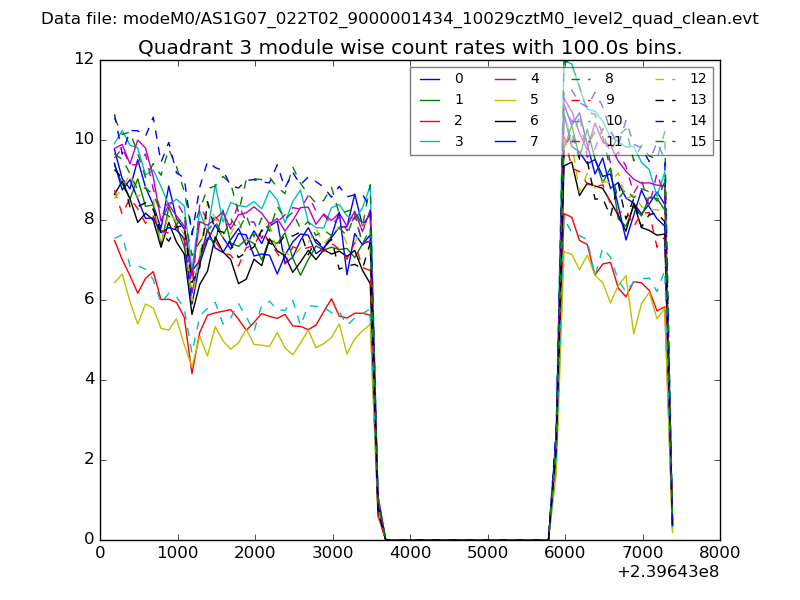 |
 |
| Parameter | Plot |
|---|---|
| CZT HV Monitor | 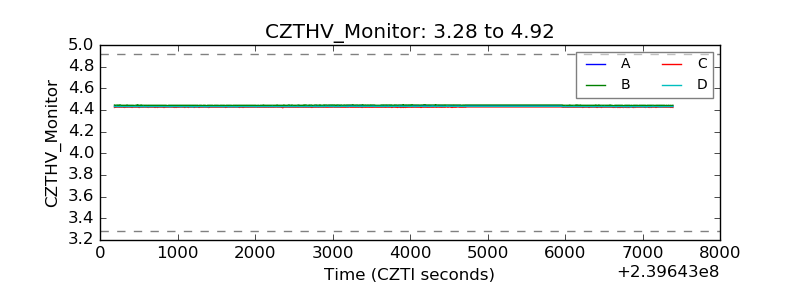 |
| D_VDD | 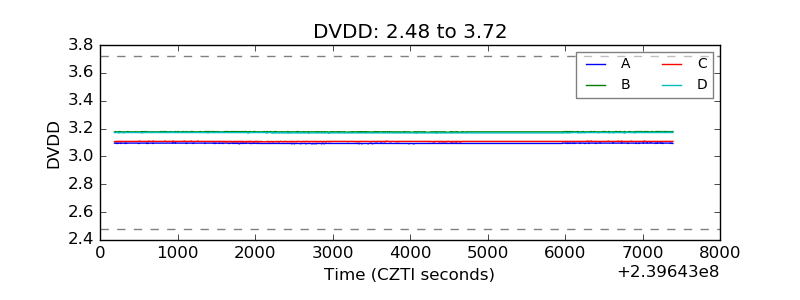 |
| Temperature 1 | 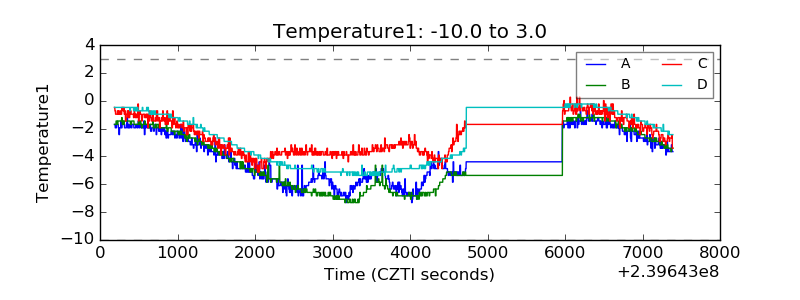 |
| Veto HV Monitor |  |
| Veto LLD | 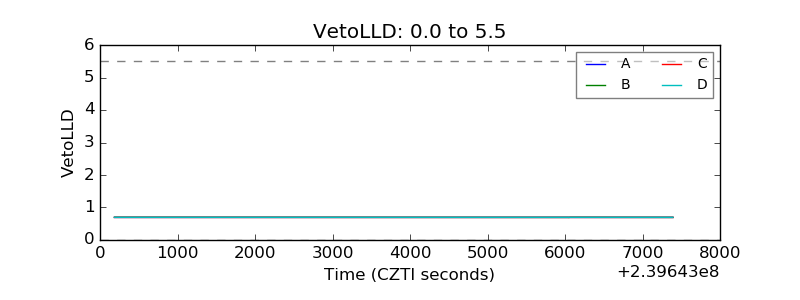 |
| Alpha Counter | 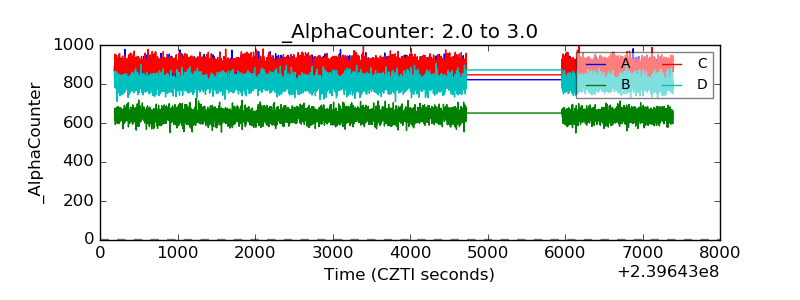 |
| _CPM_Rate | 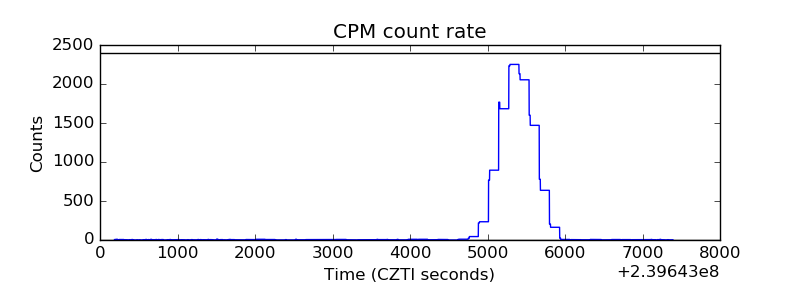 |
| CZT Counter | 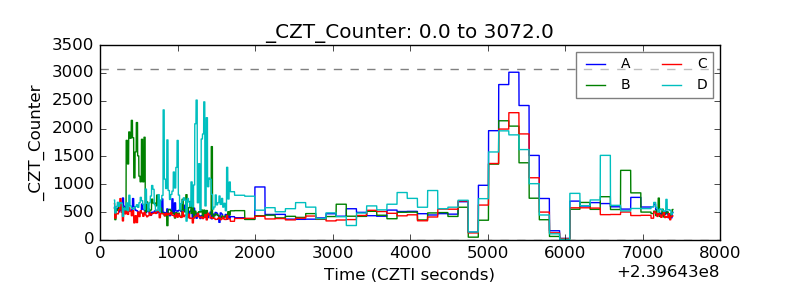 |
| +2.5 Volts monitor | 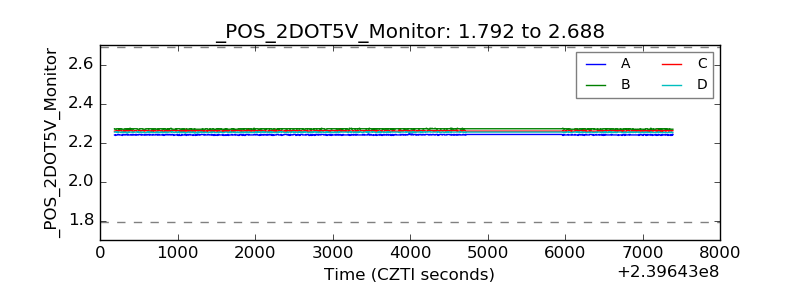 |
| +5 Volts monitor |  |
| _ROLL_ROT | 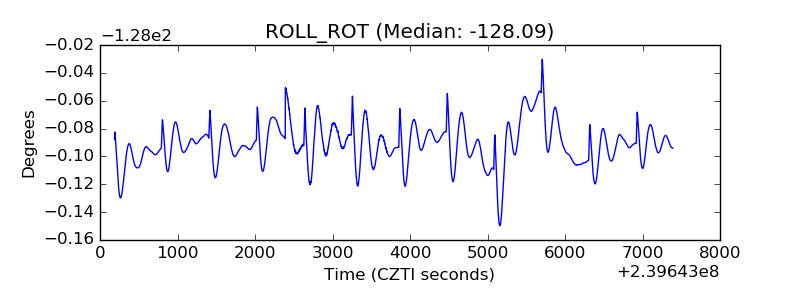 |
| _Roll_DEC | 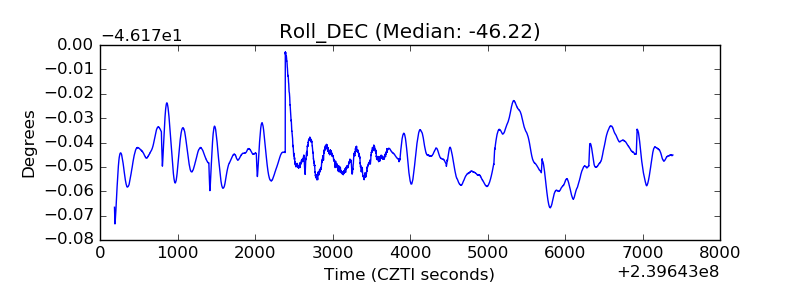 |
| _Roll_RA | 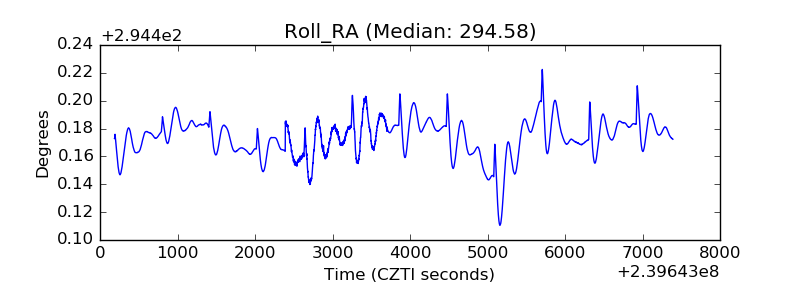 |
| Veto Counter | 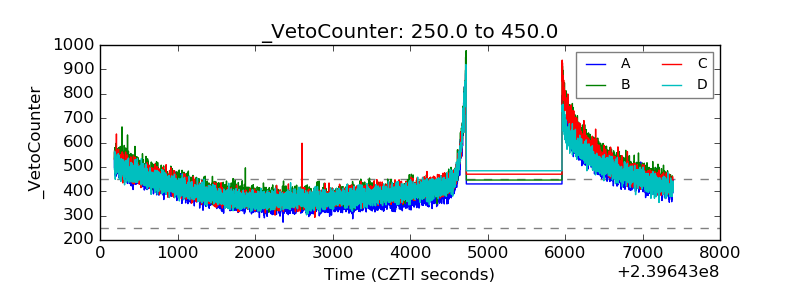 |