| Param | Original file | Final file |
|---|---|---|
| Filename | modeM0/AS1G07_022T02_9000001434_10030cztM0_level2.evt | modeM0/AS1G07_022T02_9000001434_10030cztM0_level2_quad_clean.evt |
| Size (bytes) | 469,123,200 | 102,052,800 |
| Size | 447.4 MB | 97.3 MB |
| Events in quadrant A | 3,284,786 | 668,840 |
| Events in quadrant B | 3,311,404 | 681,904 |
| Events in quadrant C | 2,919,319 | 671,085 |
| Events in quadrant D | 4,263,598 | 628,797 |
| Mode M0 | |||
|---|---|---|---|
| Quadrant | BADHDUFLAG | Total packets | Discarded packets |
| A | 0 | 14152 | 3 |
| B | 0 | 13991 | 2 |
| C | 0 | 13018 | 2 |
| D | 0 | 16707 | 2 |
| Mode M9 | |||
|---|---|---|---|
| Quadrant | BADHDUFLAG | Total packets | Discarded packets |
| A | 0 | 13 | 0 |
| B | 0 | 13 | 0 |
| C | 0 | 13 | 0 |
| D | 0 | 13 | 0 |
| Mode SS | |||
|---|---|---|---|
| Quadrant | BADHDUFLAG | Total packets | Discarded packets |
| A | 0 | 128 | 0 |
| B | 0 | 128 | 0 |
| C | 0 | 128 | 0 |
| D | 0 | 128 | 0 |
| Quadrant | Total seconds | Saturated seconds | Saturation percentage |
|---|---|---|---|
| A | 6308 | 94 | 1.490171% |
| B | 6308 | 88 | 1.395054% |
| C | 6308 | 31 | 0.491439% |
| D | 6308 | 126 | 1.997464% |
Noise dominated data is calculated using 1-second bins in cleaned event files. If a bin has >2000 counts, and if more than 50% of those come from <1% of pixels, then it is considered to be noise-dominated and hence unusable.
| Quadrant | # 1 sec bins | Bins with >0 counts | Bins with >2000 counts | High rate bins dominated by noise | Noise dominated (total time) | Noise dominated (detector-on time) | Marked lightcurve |
|---|---|---|---|---|---|---|---|
| A | 7598 | 6308 | 1 | 1 | 0.01% | 0.02% | 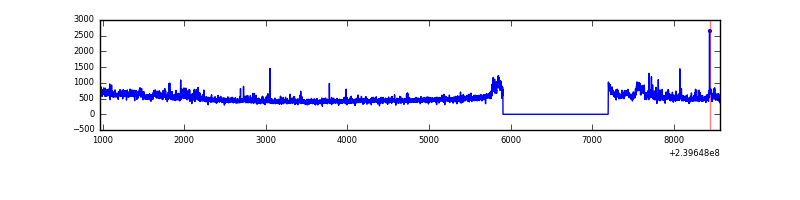 |
| B | 7598 | 6308 | 7 | 7 | 0.09% | 0.11% | 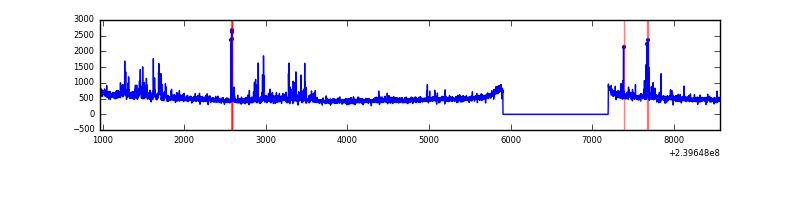 |
| C | 7598 | 6308 | 0 | 0 | 0.00% | 0.00% | 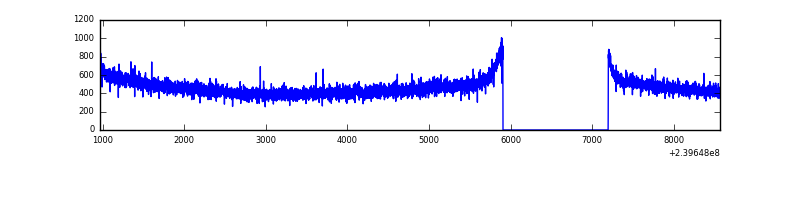 |
| D | 7598 | 6308 | 74 | 74 | 0.97% | 1.17% | 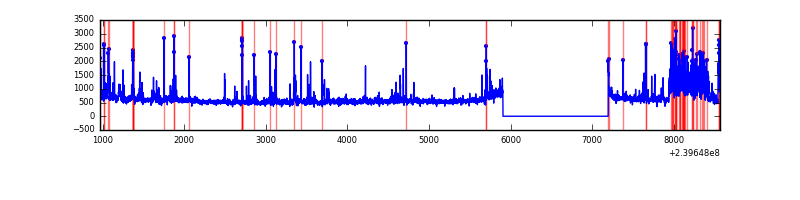 |
Top three noisy pixels from each quadrant. If the there are fewer than three noisy pixels in the level2.evt file, extra rows are filled as -1
| Pixel properties | Quadrant properties | ||||||
|---|---|---|---|---|---|---|---|
| Quadrant | DetID | PixID | Counts | Sigma | Mean | Median | Sigma |
| A | 8 | 15 | 222969 | 1416.75 | 776 | 762 | 156.8 |
| A | 8 | 5 | 61489 | 387.18 | 776 | 762 | 156.8 |
| A | 15 | 174 | 7401 | 42.33 | 776 | 762 | 156.8 |
| B | 4 | 81 | 172235 | 1151.27 | 786 | 771 | 148.9 |
| B | 4 | 239 | 48043 | 317.4 | 786 | 771 | 148.9 |
| B | 0 | 214 | 20880 | 135.02 | 786 | 771 | 148.9 |
| C | 13 | 61 | 5733 | 28.86 | 747 | 753 | 172.6 |
| C | 8 | 222 | 3281 | 14.65 | 747 | 753 | 172.6 |
| C | 14 | 67 | 2545 | 10.38 | 747 | 753 | 172.6 |
| D | 2 | 16 | 593374 | 3062.8 | 736 | 720 | 193.5 |
| D | 8 | 195 | 536906 | 2770.98 | 736 | 720 | 193.5 |
| D | 7 | 71 | 119809 | 615.45 | 736 | 720 | 193.5 |
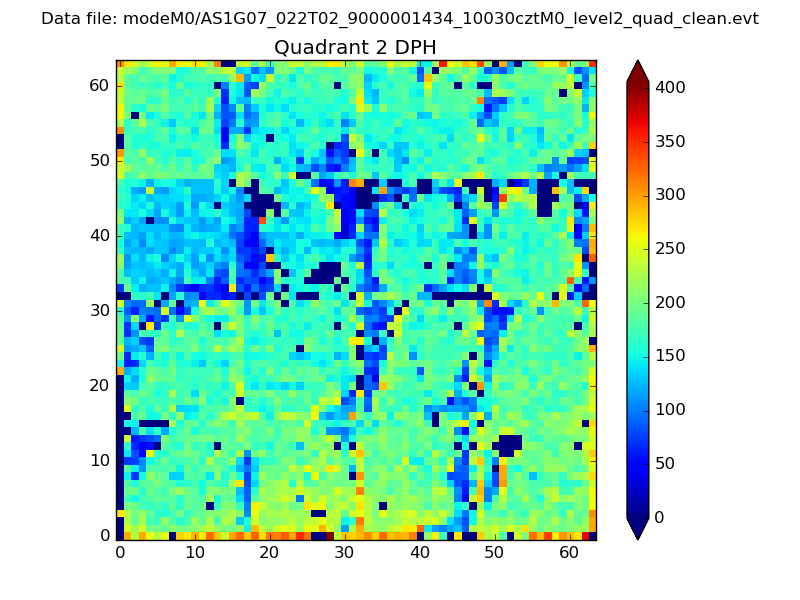
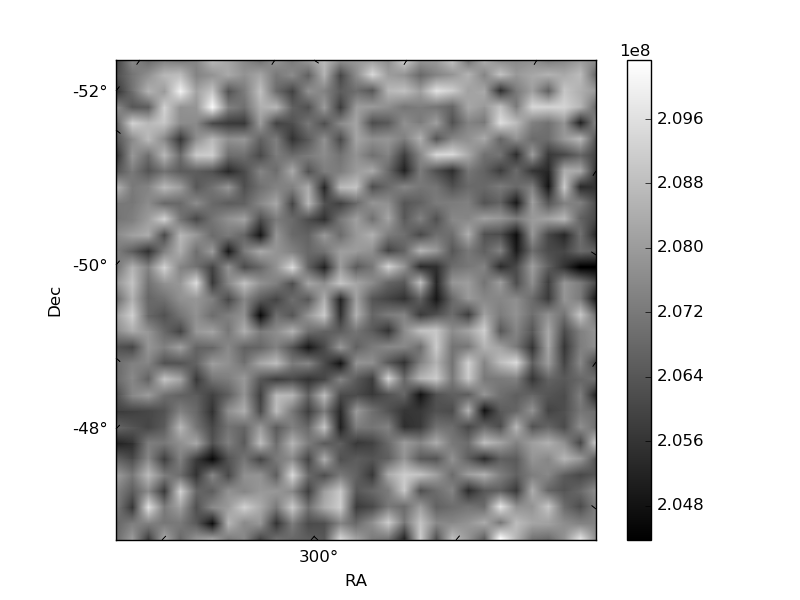
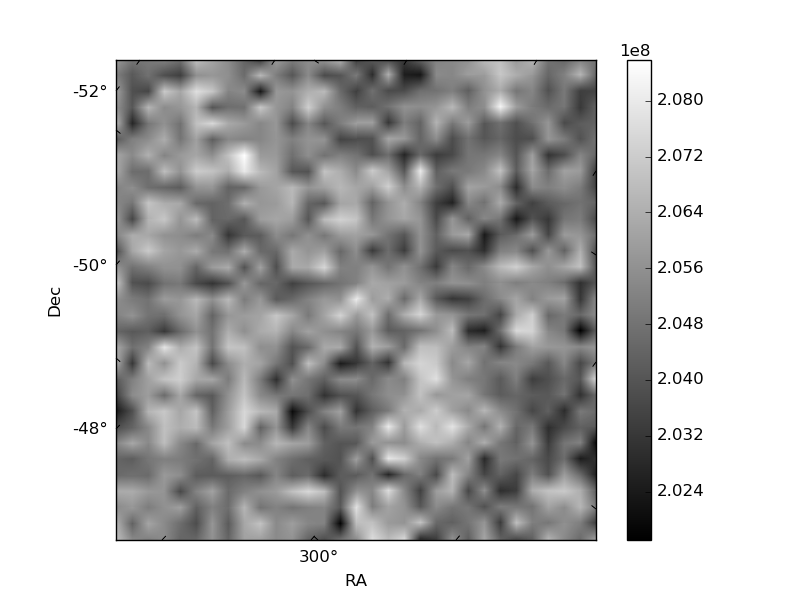
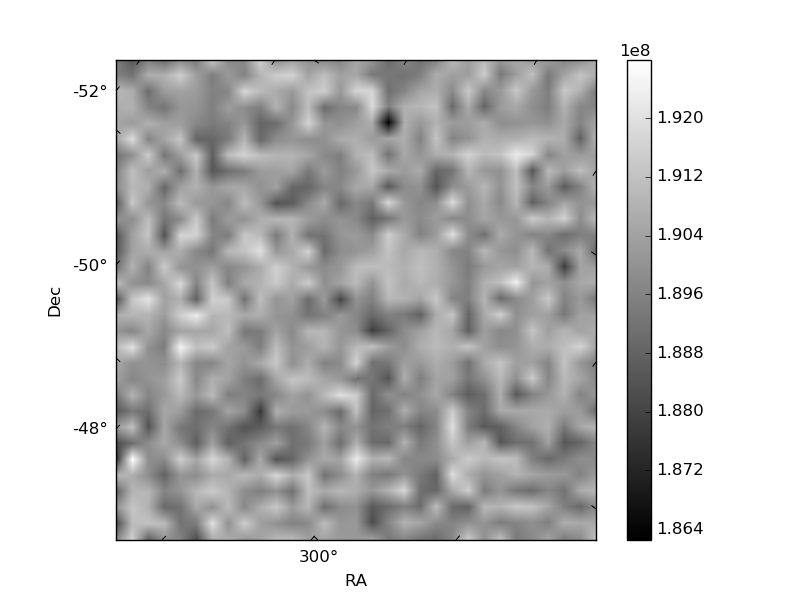
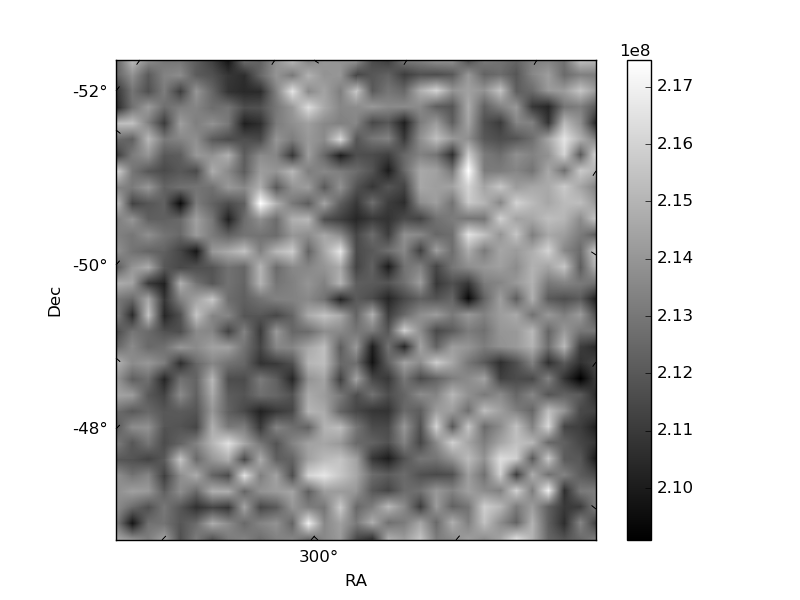
Histogram calculated using DETX and DETY for each event in the final _common_clean file
| Quadrant A | 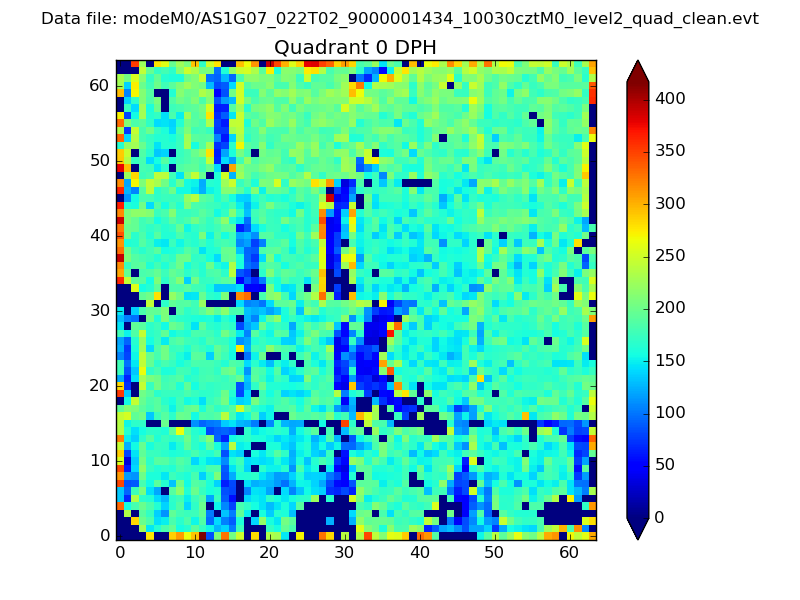 |
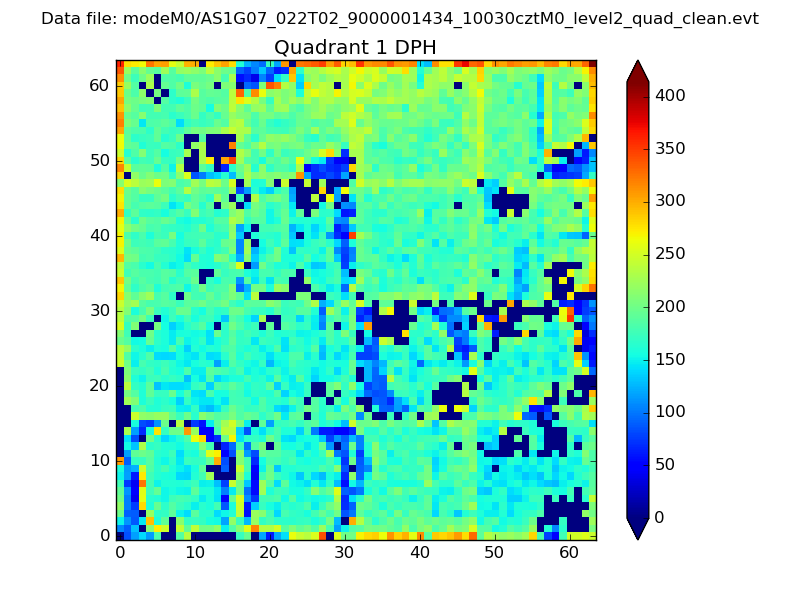 |
Quadrant B |
|---|---|---|---|
| Quadrant D | 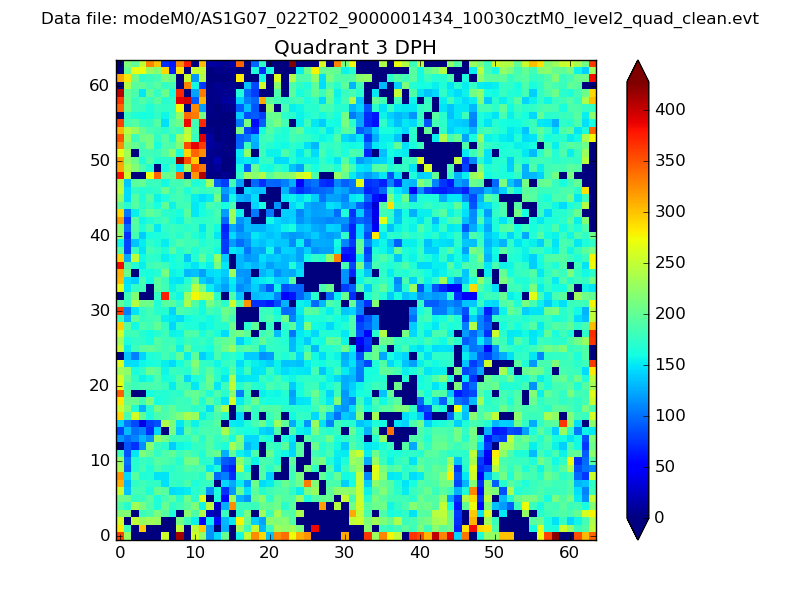 |
 |
Quadrant C |
| Plot type | Count rate plots | Images |
|---|---|---|
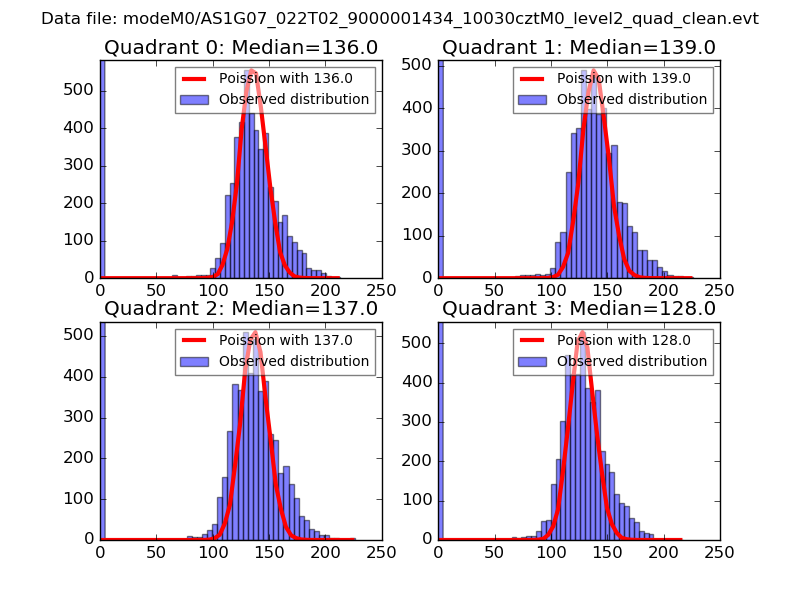
| Comparison with Poisson distribution Blue bars denote a histogram of data divided into 1 sec bins. Red curve is a Poisson curve with rate = median count rate of data. |
 |
 |
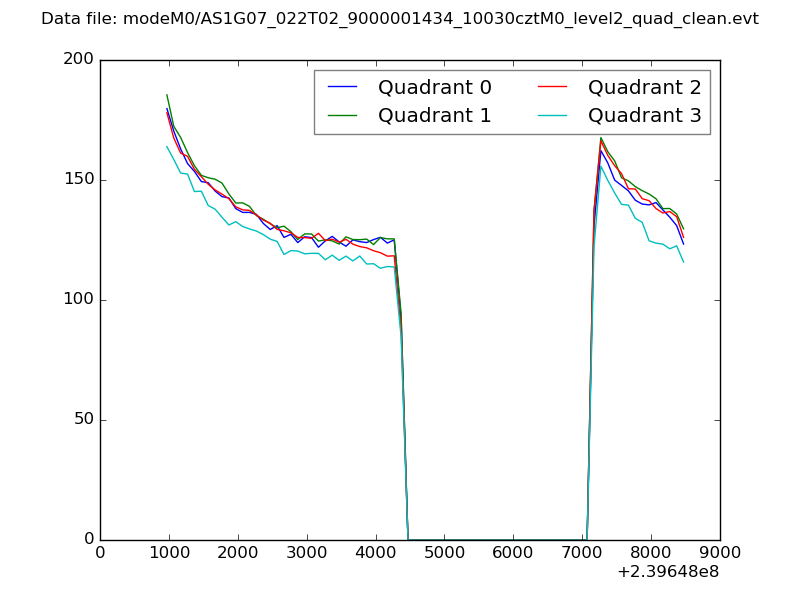
| Quadrant-wise count rates Data is divided into 100 sec bins |
 |
|
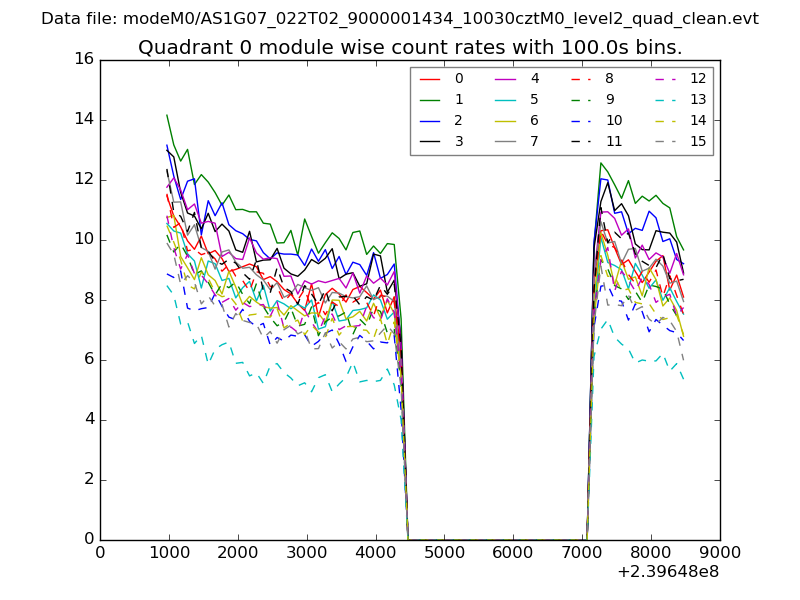
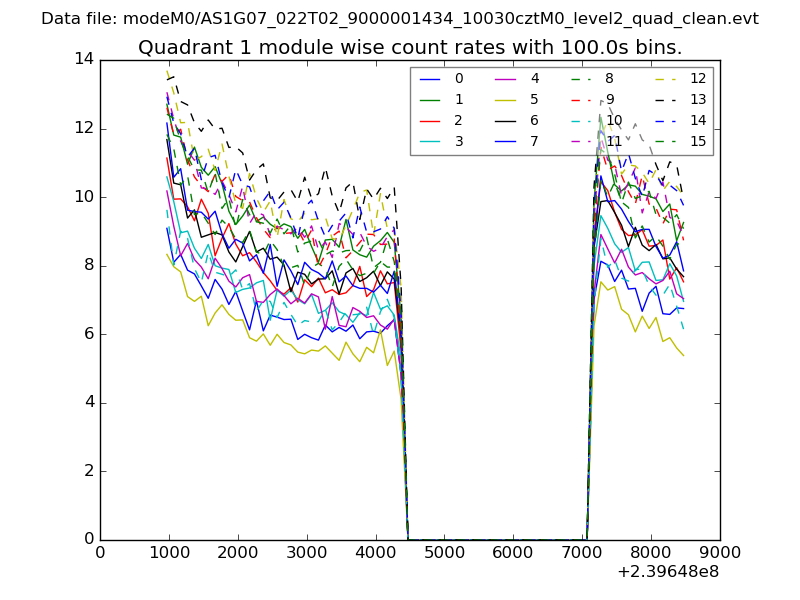
| Module-wise count rates for Quadrant A Data is divided into 100 sec bins |
 |
 |
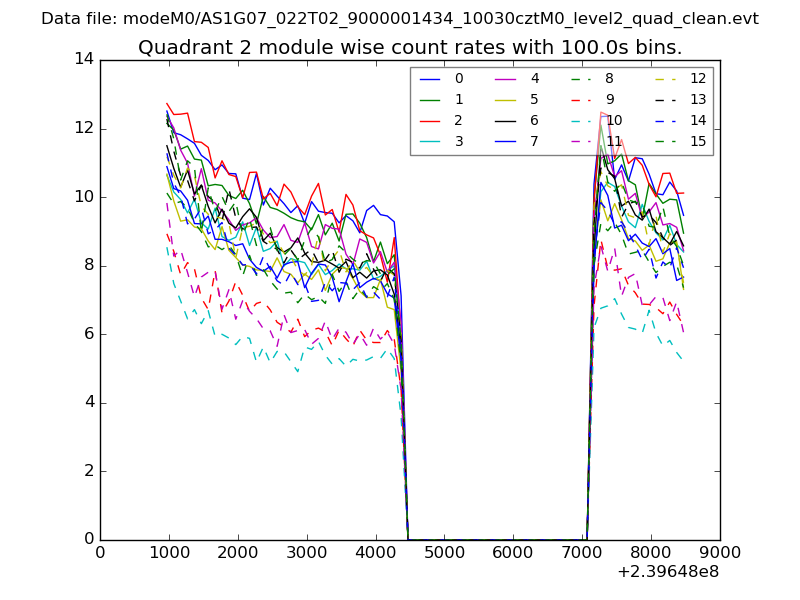
| Module-wise count rates for Quadrant B Data is divided into 100 sec bins |
 |
 |
| Module-wise count rates for Quadrant C Data is divided into 100 sec bins |
 |
 |
| Module-wise count rates for Quadrant D Data is divided into 100 sec bins |
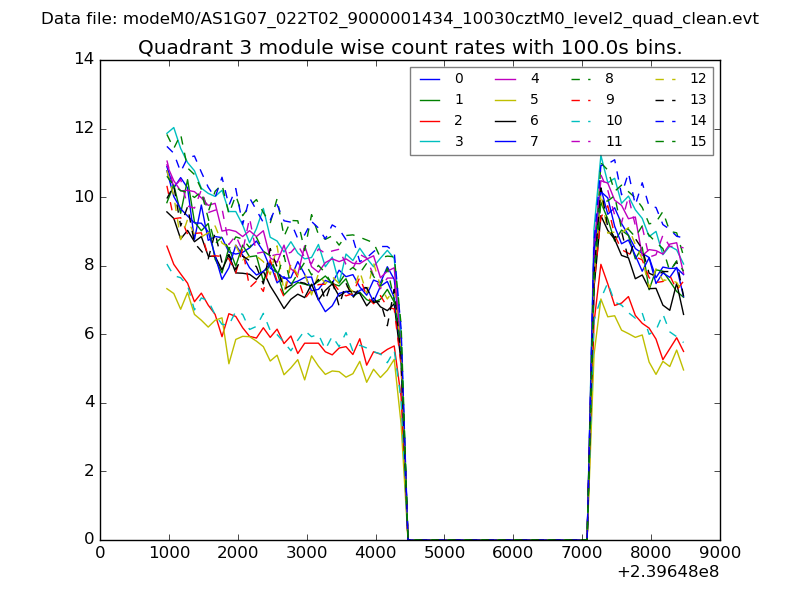 |
 |
| Parameter | Plot |
|---|---|
| CZT HV Monitor | 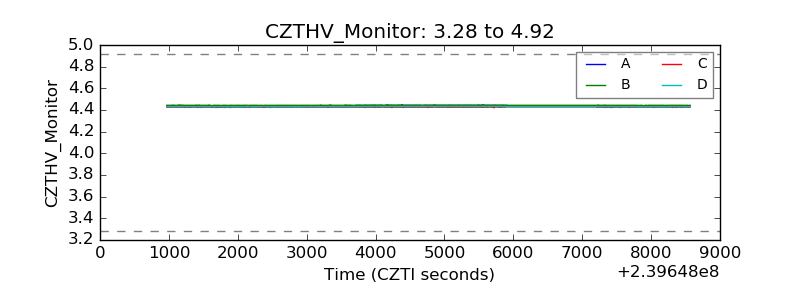 |
| D_VDD | 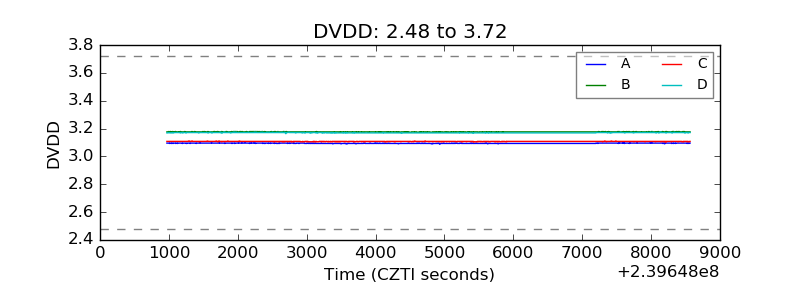 |
| Temperature 1 | 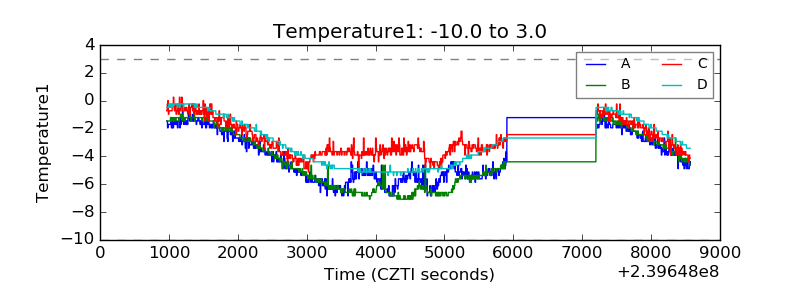 |
| Veto HV Monitor | 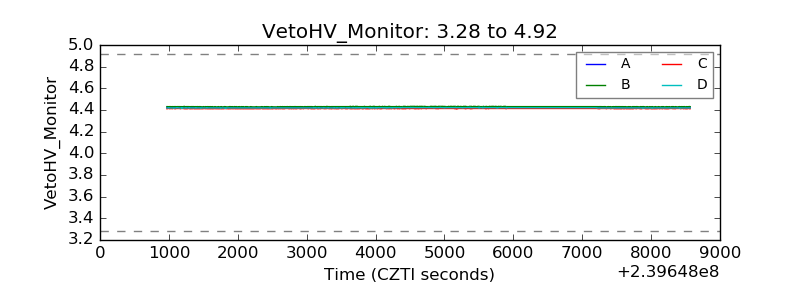 |
| Veto LLD | 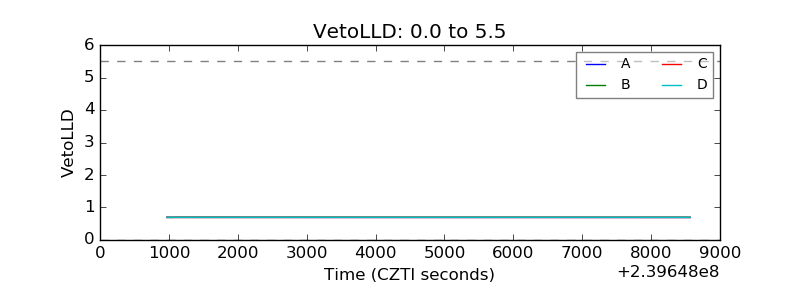 |
| Alpha Counter | 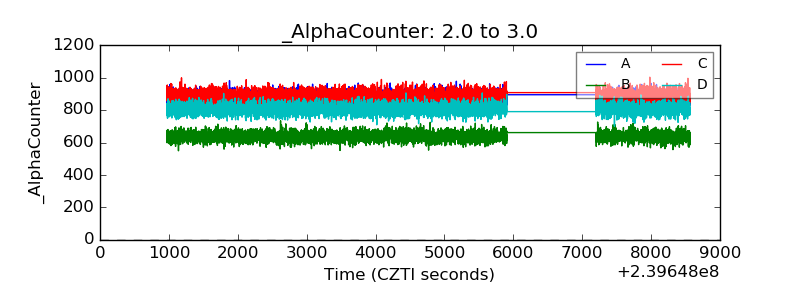 |
| _CPM_Rate | 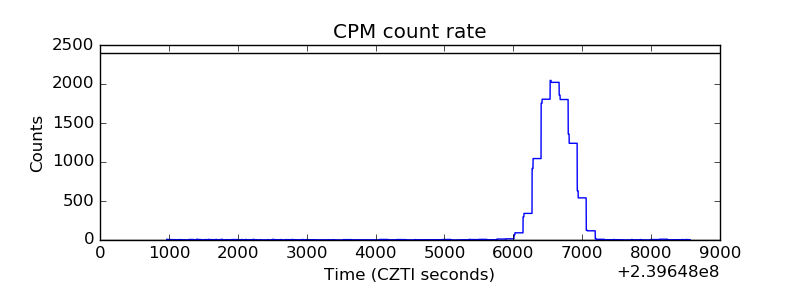 |
| CZT Counter | 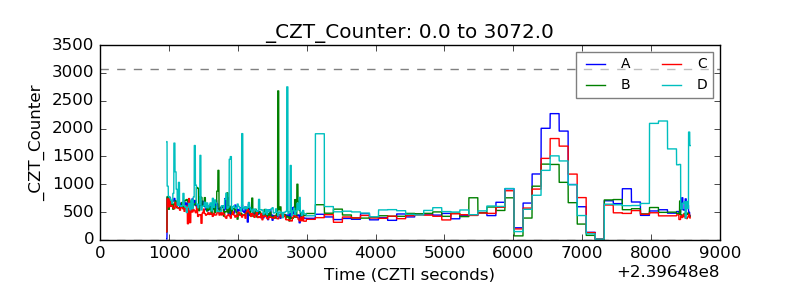 |
| +2.5 Volts monitor |  |
| +5 Volts monitor | 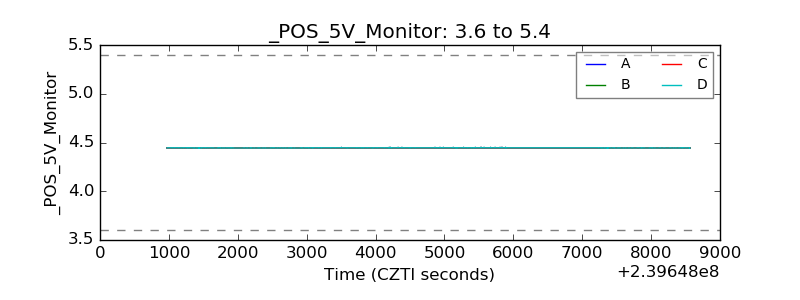 |
| _ROLL_ROT | 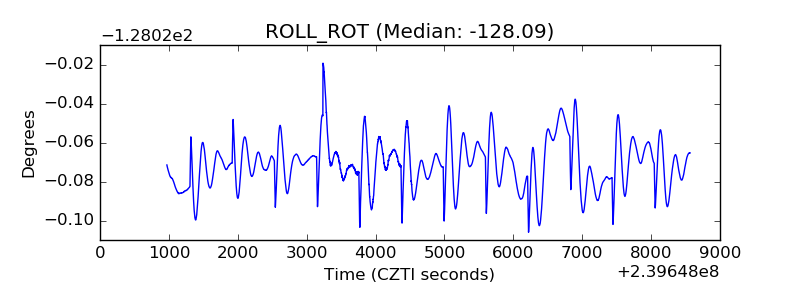 |
| _Roll_DEC | 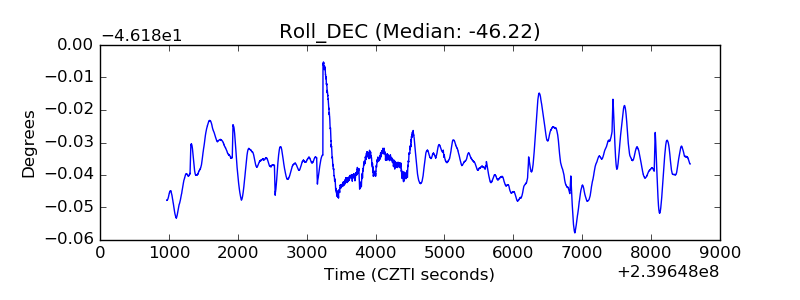 |
| _Roll_RA | 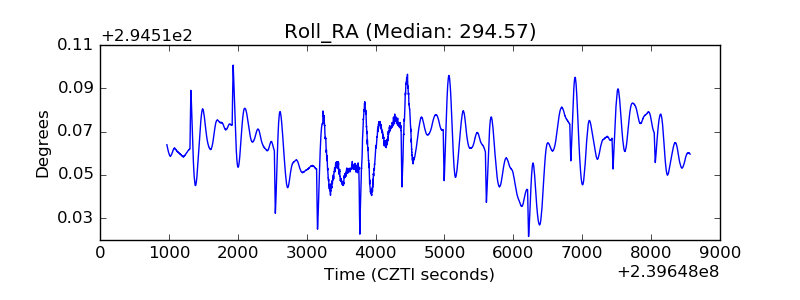 |
| Veto Counter | 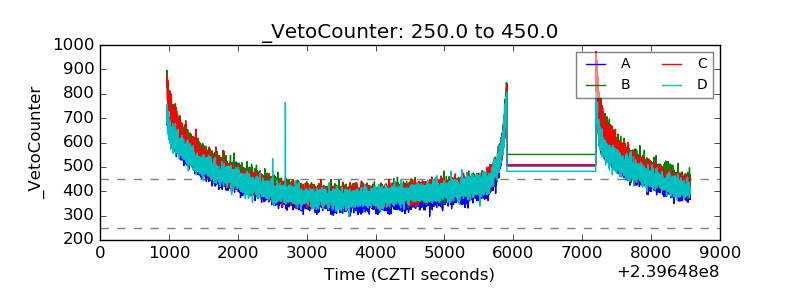 |