| Param | Original file | Final file |
|---|---|---|
| Filename | modeM0/AS1G07_022T02_9000001434_10031cztM0_level2.evt | modeM0/AS1G07_022T02_9000001434_10031cztM0_level2_quad_clean.evt |
| Size (bytes) | 33,482,880 | 7,683,840 |
| Size | 31.9 MB | 7.3 MB |
| Events in quadrant A | 249,051 | 51,335 |
| Events in quadrant B | 260,068 | 48,907 |
| Events in quadrant C | 238,779 | 54,234 |
| Events in quadrant D | 228,458 | 34,687 |
| Mode M0 | |||
|---|---|---|---|
| Quadrant | BADHDUFLAG | Total packets | Discarded packets |
| A | 0 | 13122 | 12053 |
| B | 0 | 13154 | 12102 |
| C | 0 | 12328 | 11253 |
| D | 0 | 16880 | 15967 |
| Mode M9 | |||
|---|---|---|---|
| Quadrant | BADHDUFLAG | Total packets | Discarded packets |
| A | 0 | 17 | 10 |
| B | 0 | 17 | 9 |
| C | 0 | 17 | 13 |
| D | 0 | 18 | 13 |
| Mode SS | |||
|---|---|---|---|
| Quadrant | BADHDUFLAG | Total packets | Discarded packets |
| A | 0 | 122 | 110 |
| B | 0 | 124 | 112 |
| C | 0 | 119 | 105 |
| D | 0 | 121 | 113 |
| Quadrant | Total seconds | Saturated seconds | Saturation percentage |
|---|---|---|---|
| A | 526 | 2 | 0.380228% |
| B | 502 | 0 | 0.000000% |
| C | 536 | 1 | 0.186567% |
| D | 406 | 1 | 0.246305% |
Noise dominated data is calculated using 1-second bins in cleaned event files. If a bin has >2000 counts, and if more than 50% of those come from <1% of pixels, then it is considered to be noise-dominated and hence unusable.
| Quadrant | # 1 sec bins | Bins with >0 counts | Bins with >2000 counts | High rate bins dominated by noise | Noise dominated (total time) | Noise dominated (detector-on time) | Marked lightcurve |
|---|---|---|---|---|---|---|---|
| A | 7462 | 888 | 0 | 0 | 0.00% | 0.00% | 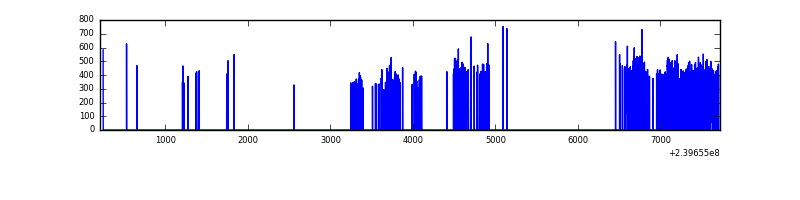 |
| B | 7515 | 846 | 0 | 0 | 0.00% | 0.00% | 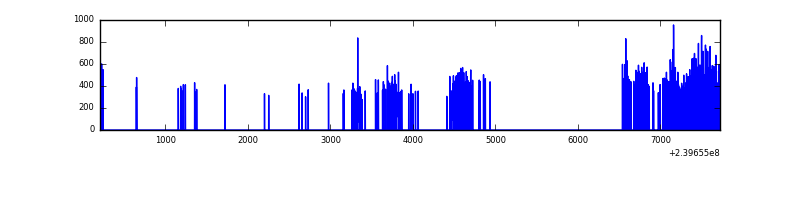 |
| C | 7181 | 885 | 0 | 0 | 0.00% | 0.00% | 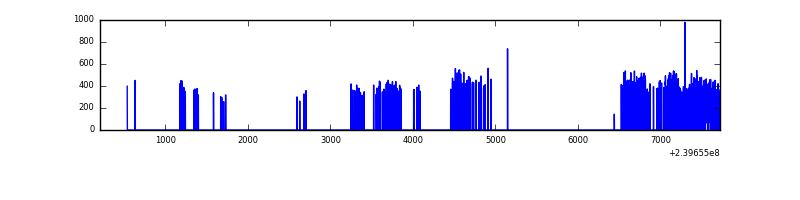 |
| D | 6527 | 694 | 0 | 0 | 0.00% | 0.00% | 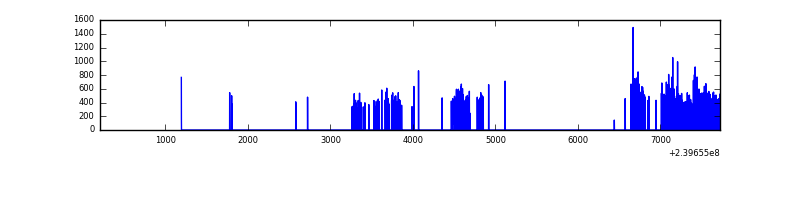 |
Top three noisy pixels from each quadrant. If the there are fewer than three noisy pixels in the level2.evt file, extra rows are filled as -1
| Pixel properties | Quadrant properties | ||||||
|---|---|---|---|---|---|---|---|
| Quadrant | DetID | PixID | Counts | Sigma | Mean | Median | Sigma |
| A | 8 | 15 | 8554 | 573.21 | 62 | 60 | 14.8 |
| A | 15 | 239 | 960 | 60.74 | 62 | 60 | 14.8 |
| A | 0 | 226 | 627 | 38.26 | 62 | 60 | 14.8 |
| B | 4 | 81 | 24270 | 1797.35 | 59 | 58 | 13.5 |
| B | 0 | 187 | 2089 | 150.77 | 59 | 58 | 13.5 |
| B | 12 | 111 | 1150 | 81.06 | 59 | 58 | 13.5 |
| C | 13 | 61 | 480 | 26.26 | 61 | 61 | 16.0 |
| C | 8 | 222 | 299 | 14.92 | 61 | 61 | 16.0 |
| C | 14 | 67 | 266 | 12.85 | 61 | 61 | 16.0 |
| D | 8 | 195 | 31683 | 2396.28 | 44 | 43 | 13.2 |
| D | 2 | 16 | 17057 | 1288.57 | 44 | 43 | 13.2 |
| D | 7 | 71 | 4227 | 316.88 | 44 | 43 | 13.2 |
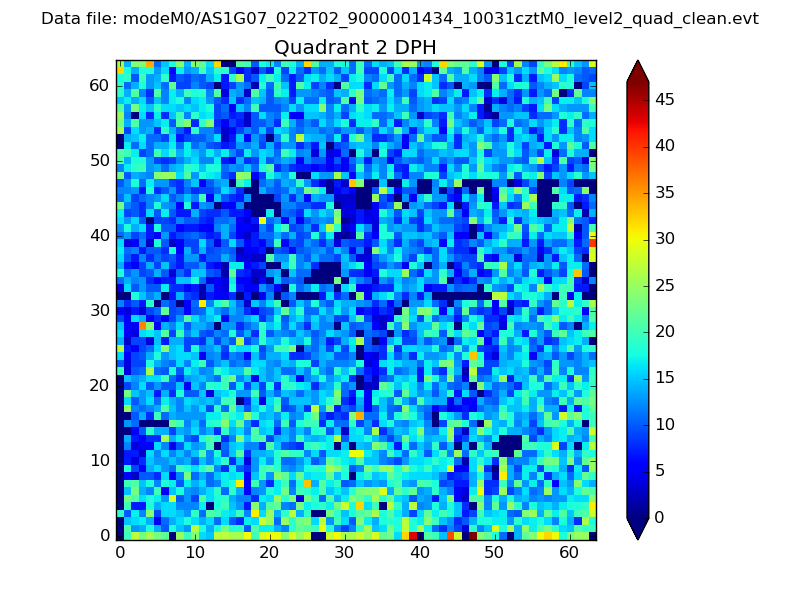
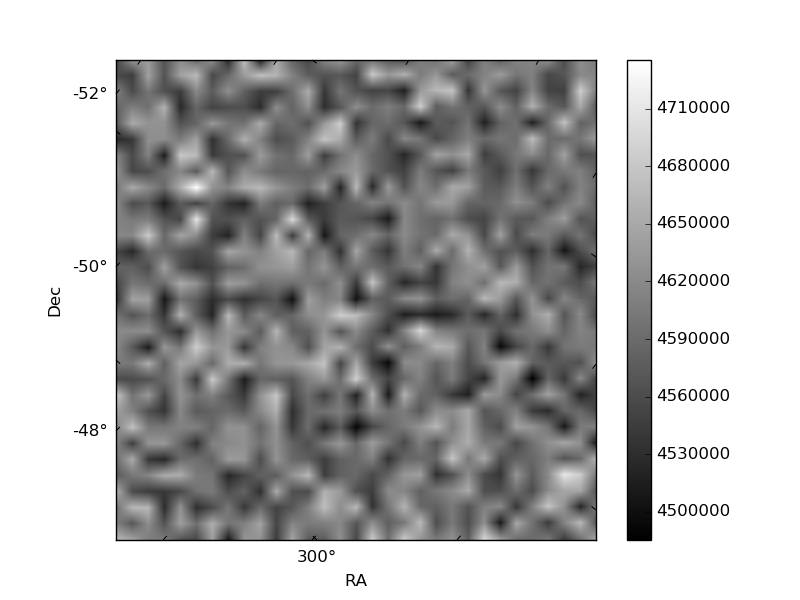
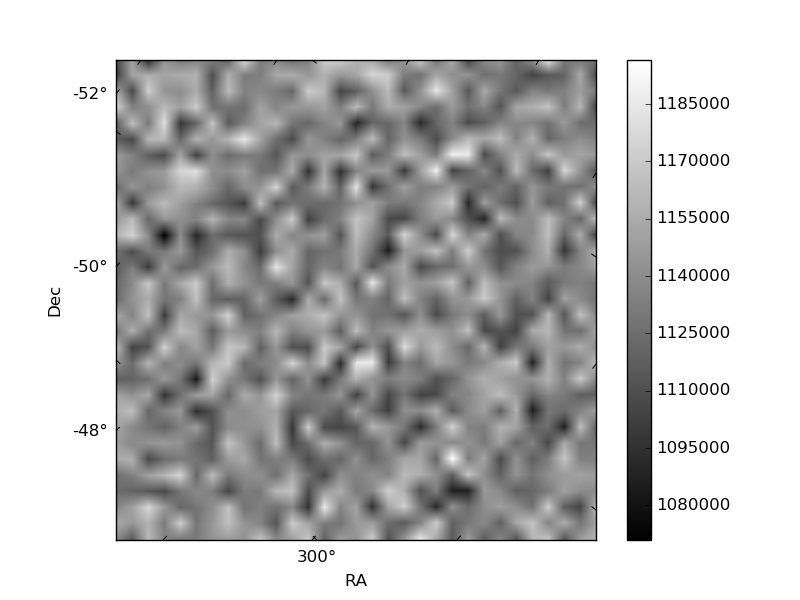
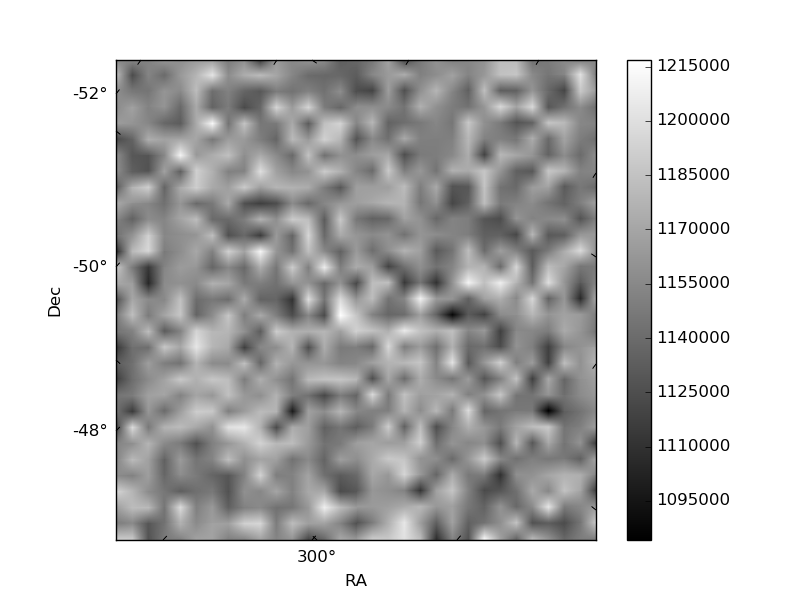
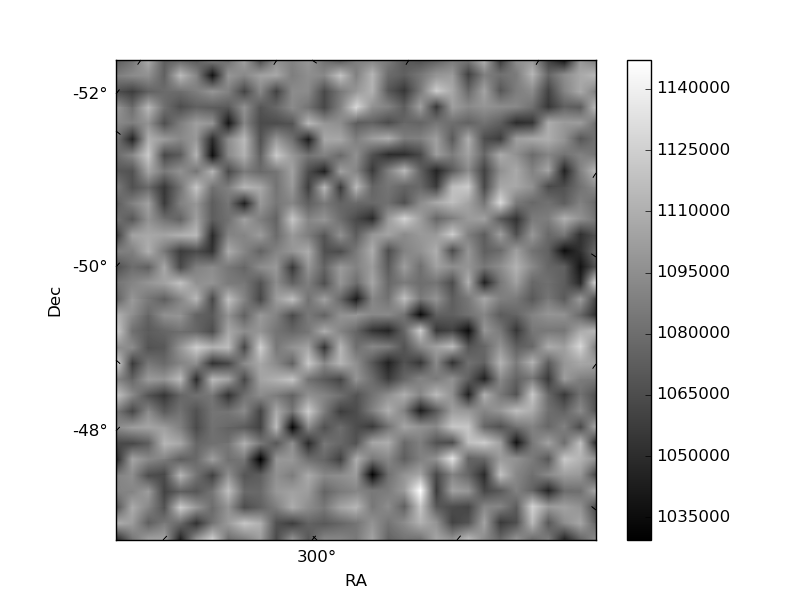
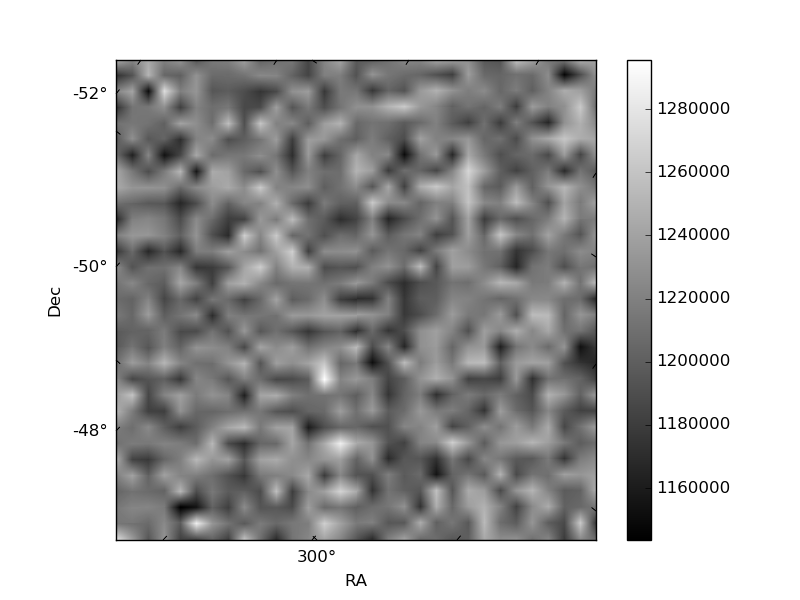
Histogram calculated using DETX and DETY for each event in the final _common_clean file
| Quadrant A | 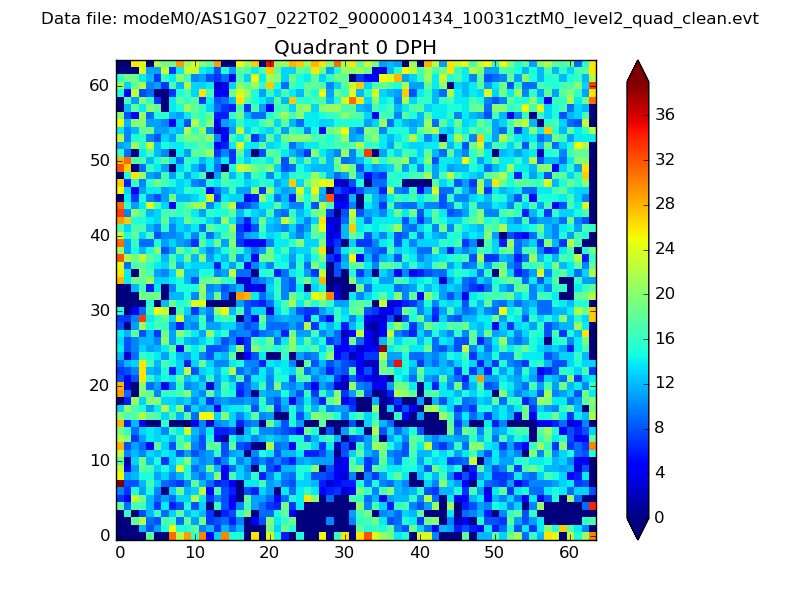 |
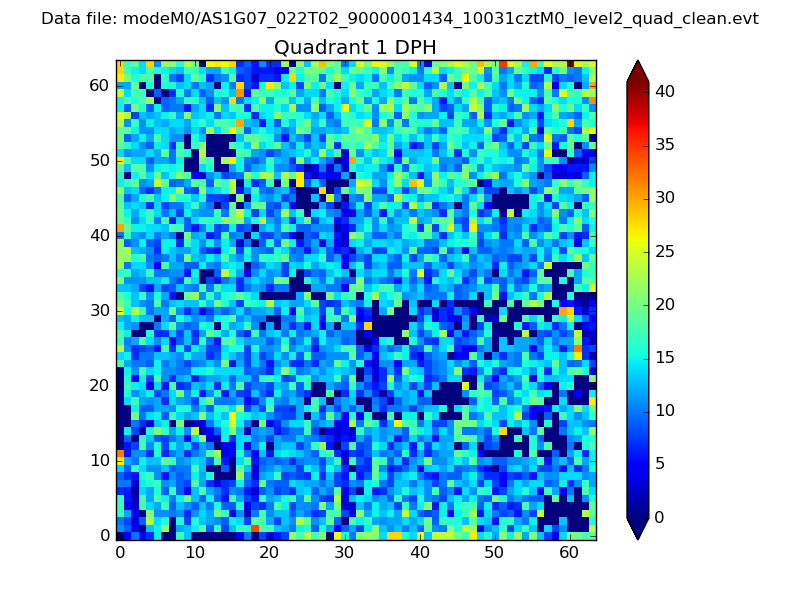 |
Quadrant B |
|---|---|---|---|
| Quadrant D | 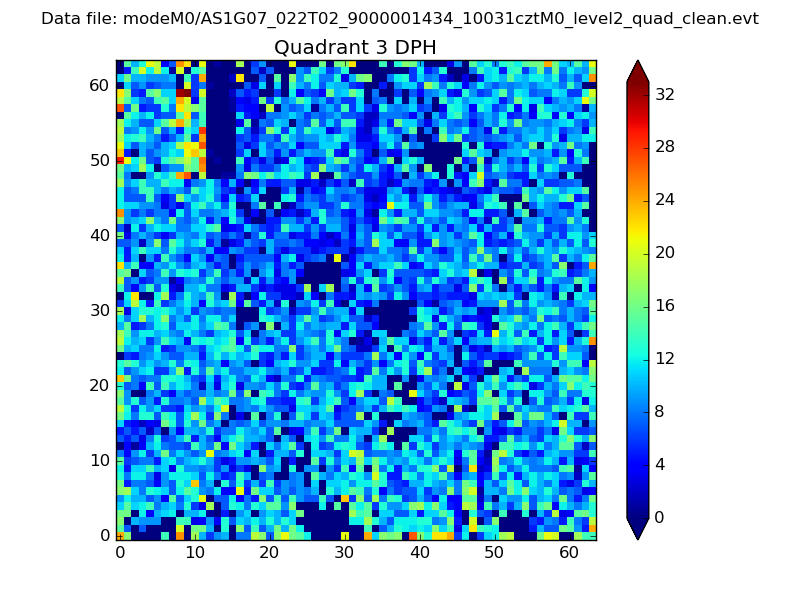 |
 |
Quadrant C |
| Plot type | Count rate plots | Images |
|---|---|---|
| Comparison with Poisson distribution Blue bars denote a histogram of data divided into 1 sec bins. Red curve is a Poisson curve with rate = median count rate of data. |
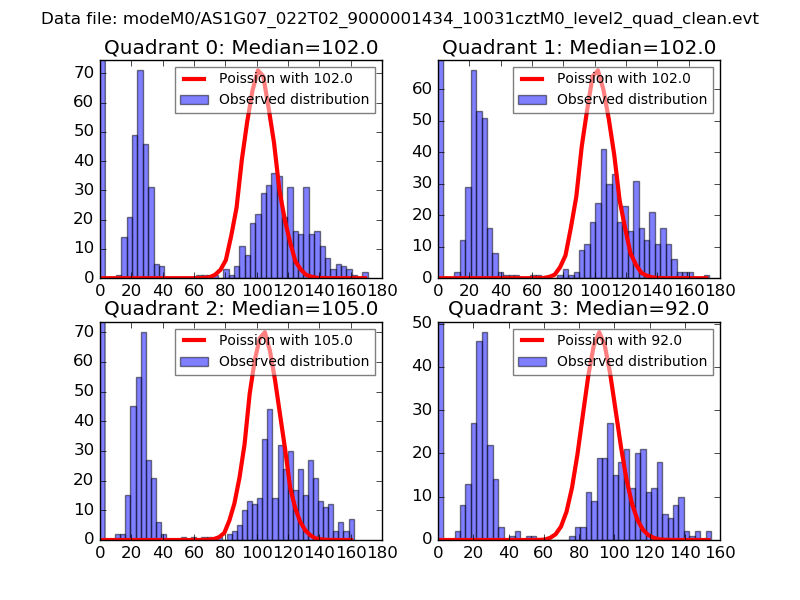 |
 |
| Quadrant-wise count rates Data is divided into 100 sec bins |
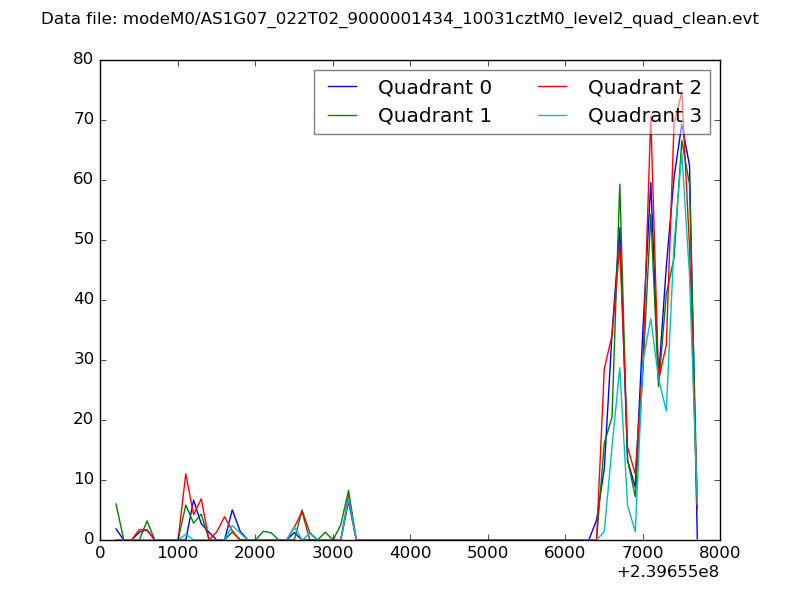 |
|
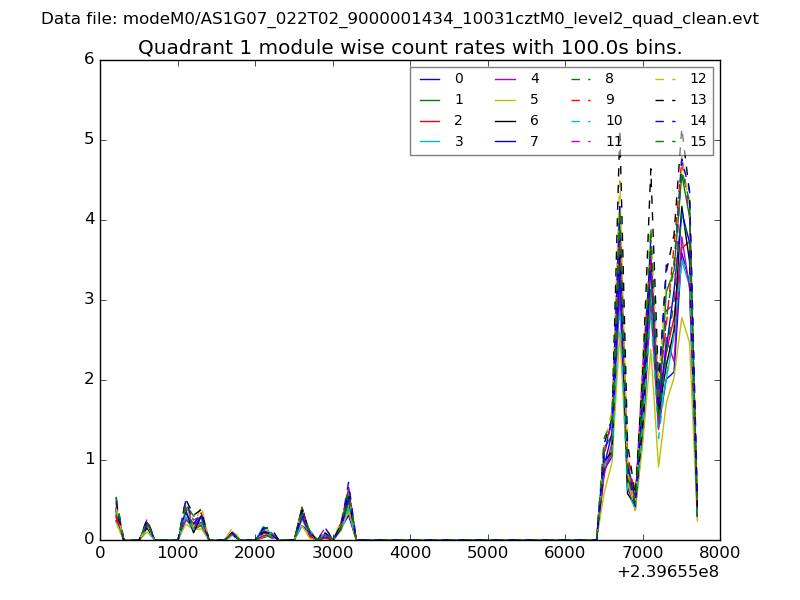
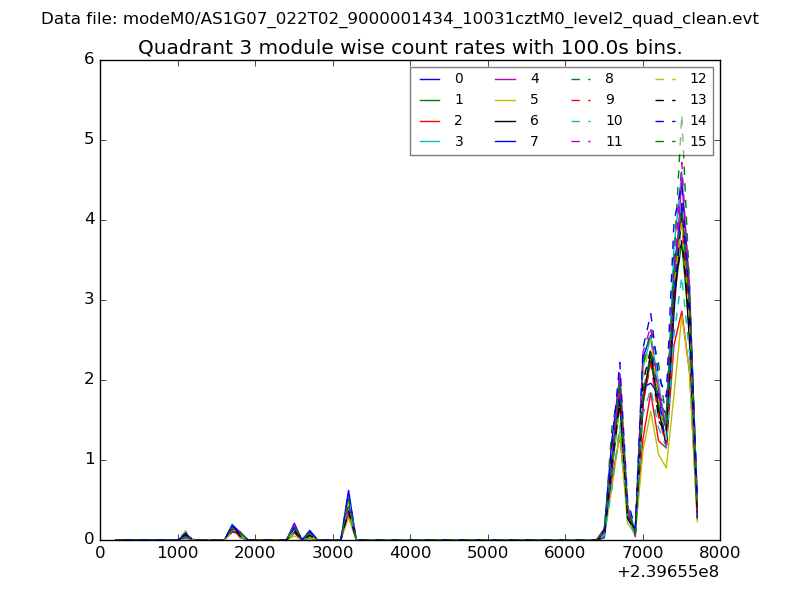
| Module-wise count rates for Quadrant A Data is divided into 100 sec bins |
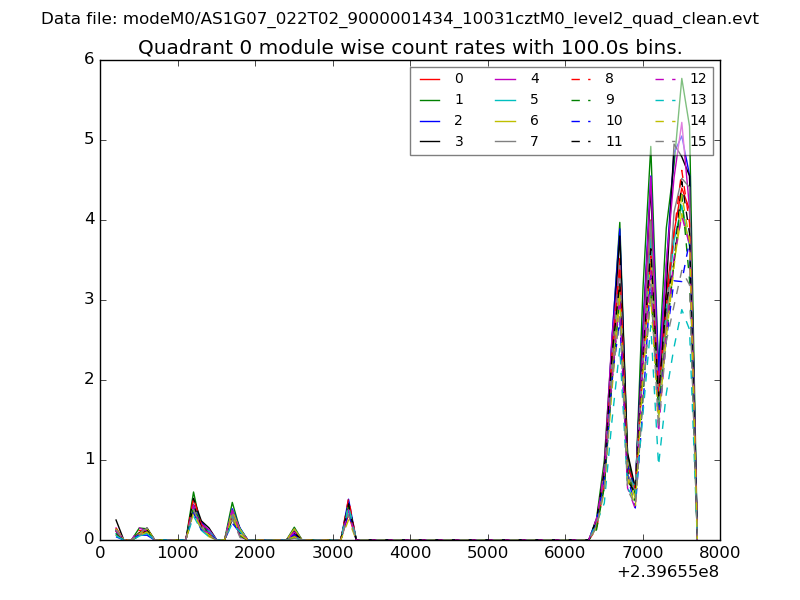 |
 |
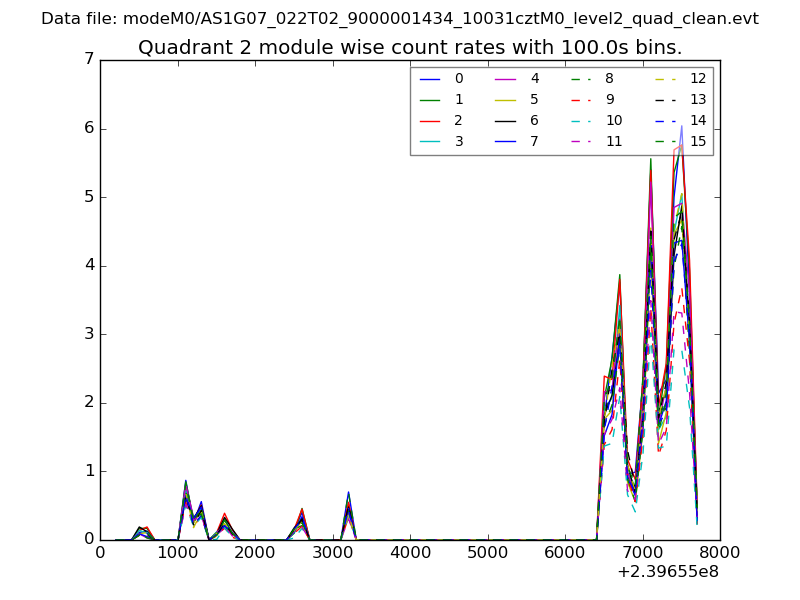
| Module-wise count rates for Quadrant B Data is divided into 100 sec bins |
 |
 |
| Module-wise count rates for Quadrant C Data is divided into 100 sec bins |
 |
 |
| Module-wise count rates for Quadrant D Data is divided into 100 sec bins |
 |
 |
| Parameter | Plot |
|---|---|
| CZT HV Monitor |  |
| D_VDD | 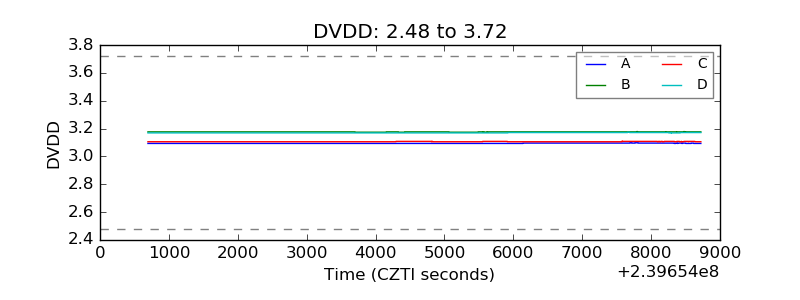 |
| Temperature 1 | 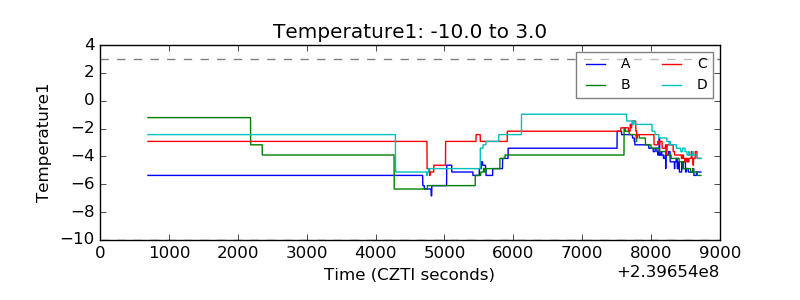 |
| Veto HV Monitor | 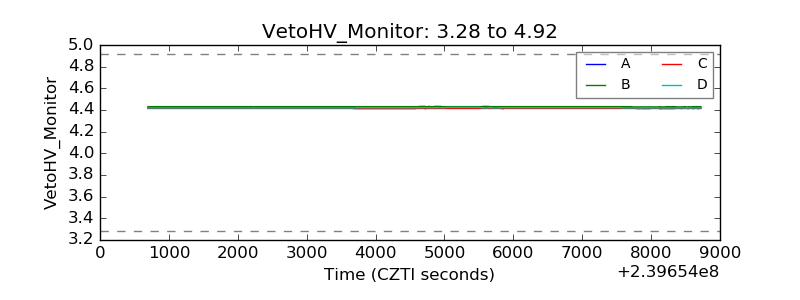 |
| Veto LLD | 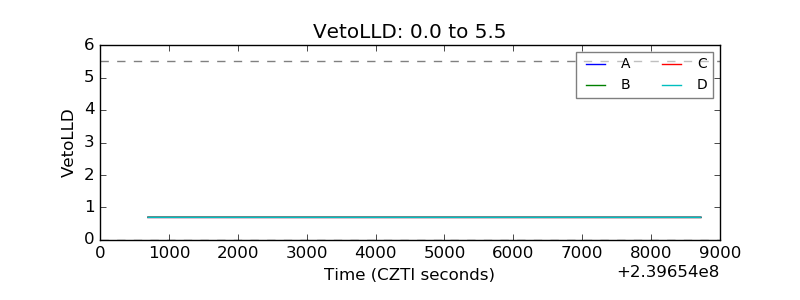 |
| Alpha Counter | 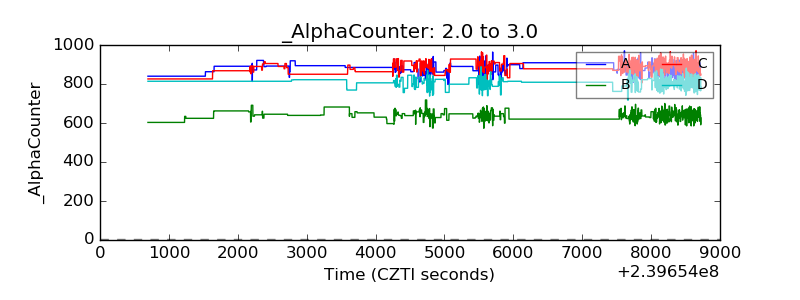 |
| _CPM_Rate | 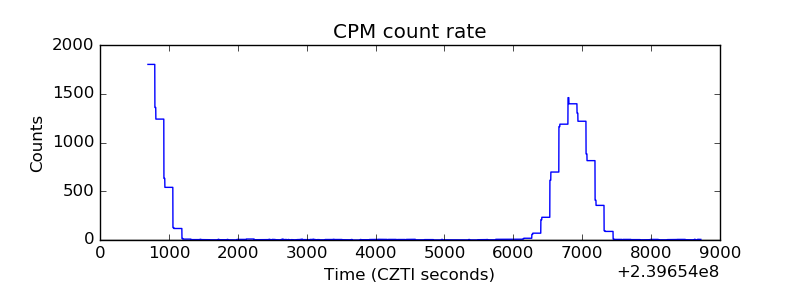 |
| CZT Counter | 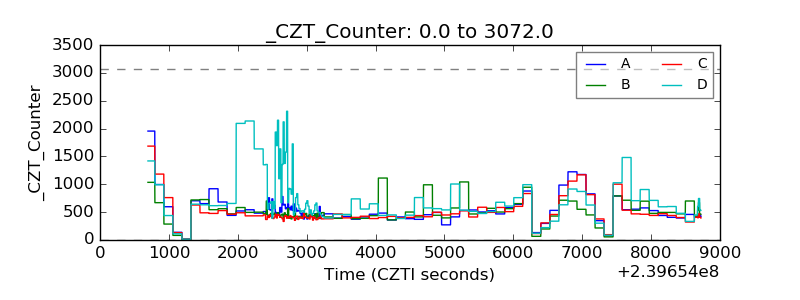 |
| +2.5 Volts monitor | 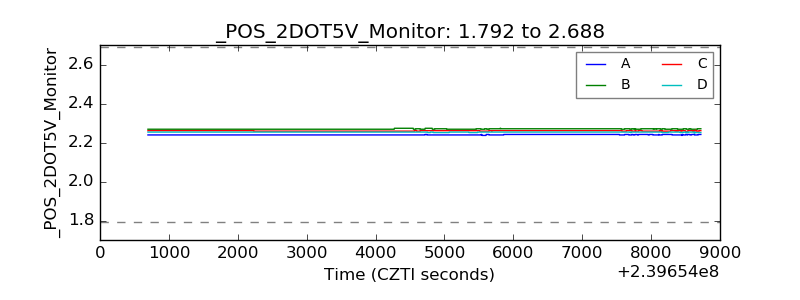 |
| +5 Volts monitor |  |
| _ROLL_ROT | 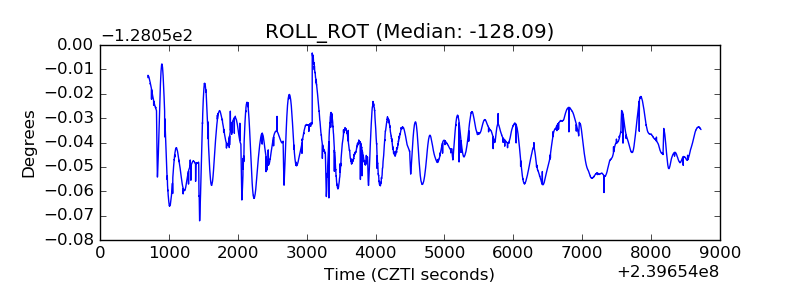 |
| _Roll_DEC | 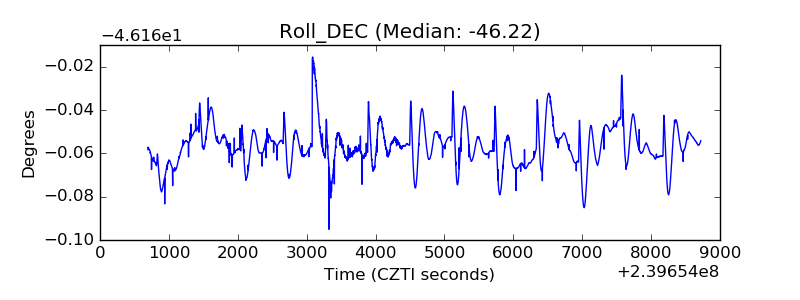 |
| _Roll_RA | 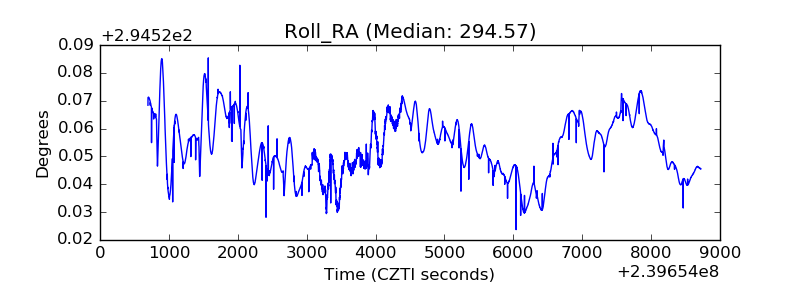 |
| Veto Counter | 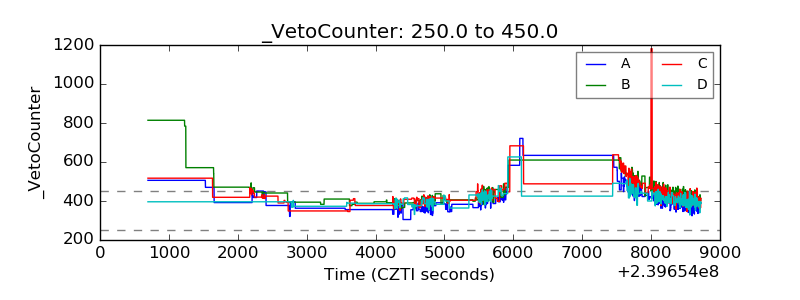 |