| Param | Original file | Final file |
|---|---|---|
| Filename | modeM0/AS1G07_022T02_9000001434_10032cztM0_level2.evt | modeM0/AS1G07_022T02_9000001434_10032cztM0_level2_quad_clean.evt |
| Size (bytes) | 300,159,360 | 58,331,520 |
| Size | 286.3 MB | 55.6 MB |
| Events in quadrant A | 1,988,417 | 375,727 |
| Events in quadrant B | 2,179,139 | 383,376 |
| Events in quadrant C | 1,916,376 | 380,197 |
| Events in quadrant D | 2,714,125 | 326,298 |
| Mode M0 | |||
|---|---|---|---|
| Quadrant | BADHDUFLAG | Total packets | Discarded packets |
| A | 0 | 13286 | 4377 |
| B | 0 | 13928 | 4552 |
| C | 0 | 13082 | 4245 |
| D | 0 | 18449 | 7813 |
| Mode M9 | |||
|---|---|---|---|
| Quadrant | BADHDUFLAG | Total packets | Discarded packets |
| A | 0 | 21 | 3 |
| B | 0 | 22 | 4 |
| C | 0 | 22 | 3 |
| D | 0 | 23 | 6 |
| Mode SS | |||
|---|---|---|---|
| Quadrant | BADHDUFLAG | Total packets | Discarded packets |
| A | 0 | 131 | 33 |
| B | 0 | 132 | 36 |
| C | 0 | 131 | 38 |
| D | 0 | 131 | 42 |
| Quadrant | Total seconds | Saturated seconds | Saturation percentage |
|---|---|---|---|
| A | 4318 | 8 | 0.185271% |
| B | 4331 | 25 | 0.577234% |
| C | 4330 | 4 | 0.092379% |
| D | 3929 | 115 | 2.926953% |
Noise dominated data is calculated using 1-second bins in cleaned event files. If a bin has >2000 counts, and if more than 50% of those come from <1% of pixels, then it is considered to be noise-dominated and hence unusable.
| Quadrant | # 1 sec bins | Bins with >0 counts | Bins with >2000 counts | High rate bins dominated by noise | Noise dominated (total time) | Noise dominated (detector-on time) | Marked lightcurve |
|---|---|---|---|---|---|---|---|
| A | 7577 | 5249 | 1 | 1 | 0.01% | 0.02% | 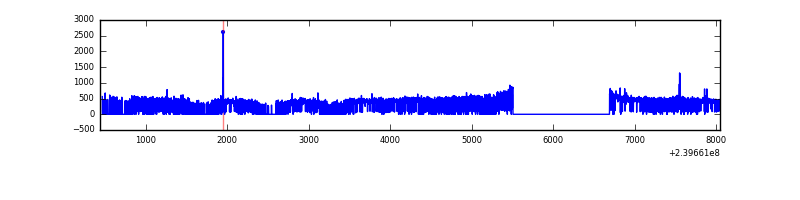 |
| B | 7603 | 5251 | 2 | 2 | 0.03% | 0.04% | 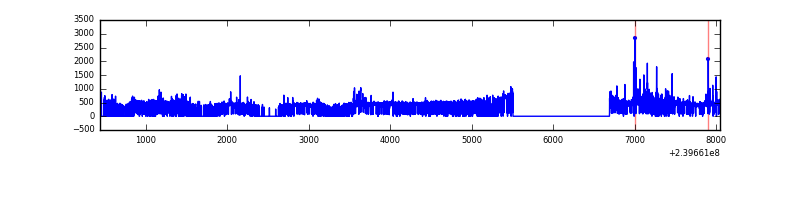 |
| C | 7605 | 5270 | 0 | 0 | 0.00% | 0.00% | 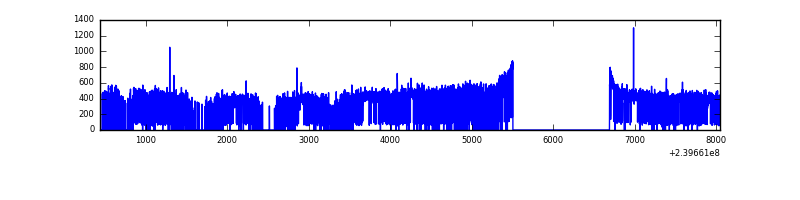 |
| D | 7598 | 4861 | 85 | 85 | 1.12% | 1.75% | 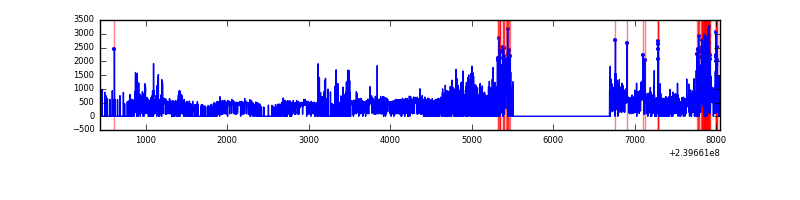 |
Top three noisy pixels from each quadrant. If the there are fewer than three noisy pixels in the level2.evt file, extra rows are filled as -1
| Pixel properties | Quadrant properties | ||||||
|---|---|---|---|---|---|---|---|
| Quadrant | DetID | PixID | Counts | Sigma | Mean | Median | Sigma |
| A | 8 | 15 | 34047 | 331.82 | 498 | 487 | 101.1 |
| A | 15 | 174 | 17529 | 168.5 | 498 | 487 | 101.1 |
| A | 15 | 239 | 14509 | 138.64 | 498 | 487 | 101.1 |
| B | 4 | 81 | 164955 | 1687.03 | 510 | 497 | 97.5 |
| B | 0 | 214 | 14601 | 144.68 | 510 | 497 | 97.5 |
| B | 12 | 111 | 10130 | 98.82 | 510 | 497 | 97.5 |
| C | 13 | 61 | 3666 | 28.1 | 489 | 490 | 113.0 |
| C | 8 | 222 | 2485 | 17.65 | 489 | 490 | 113.0 |
| C | 14 | 67 | 1847 | 12.01 | 489 | 490 | 113.0 |
| D | 2 | 16 | 447193 | 4102.16 | 428 | 417 | 108.9 |
| D | 8 | 195 | 291163 | 2669.54 | 428 | 417 | 108.9 |
| D | 1 | 52 | 185570 | 1700.02 | 428 | 417 | 108.9 |
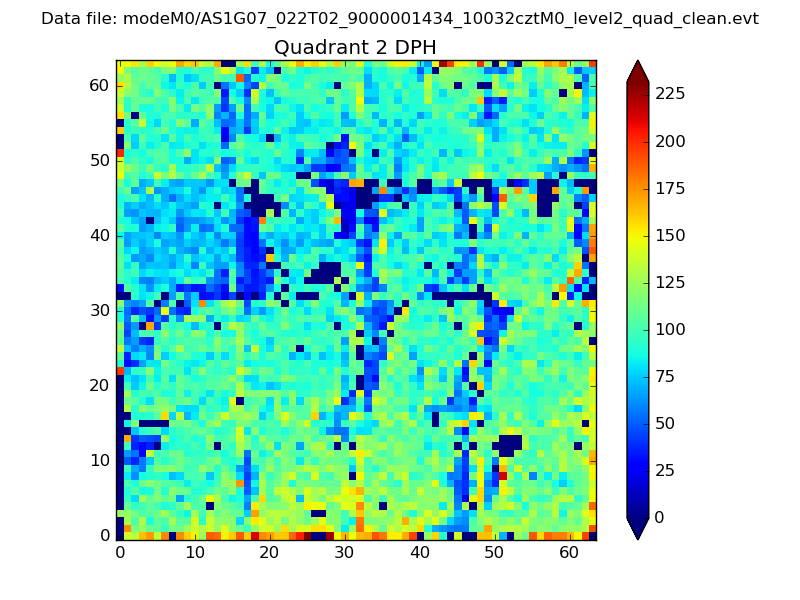
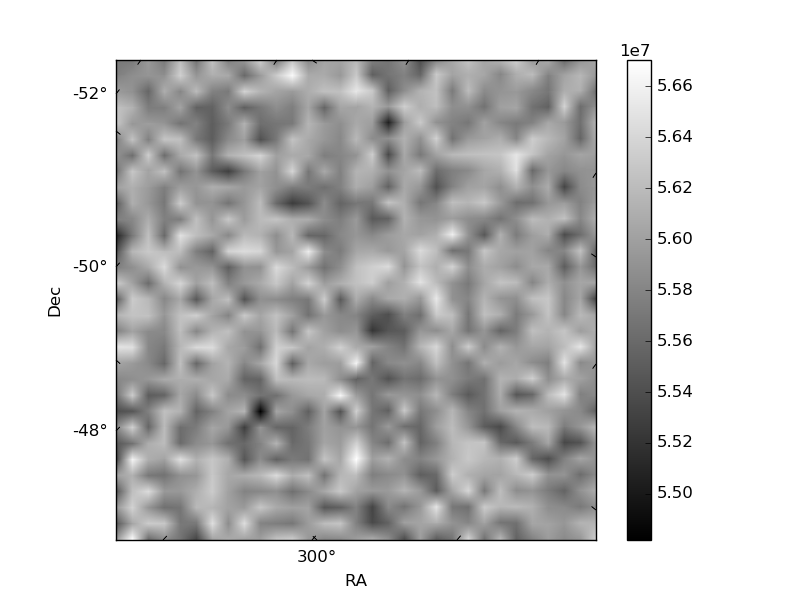
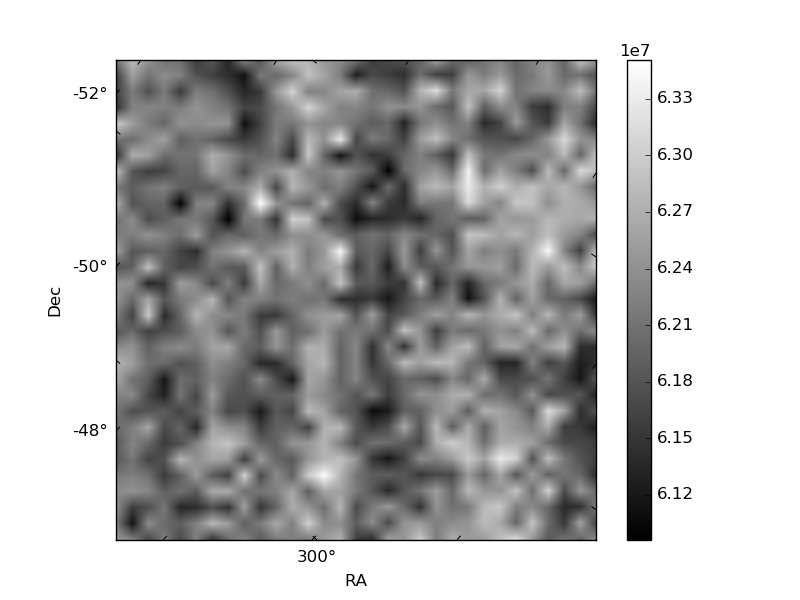
Histogram calculated using DETX and DETY for each event in the final _common_clean file
| Quadrant A | 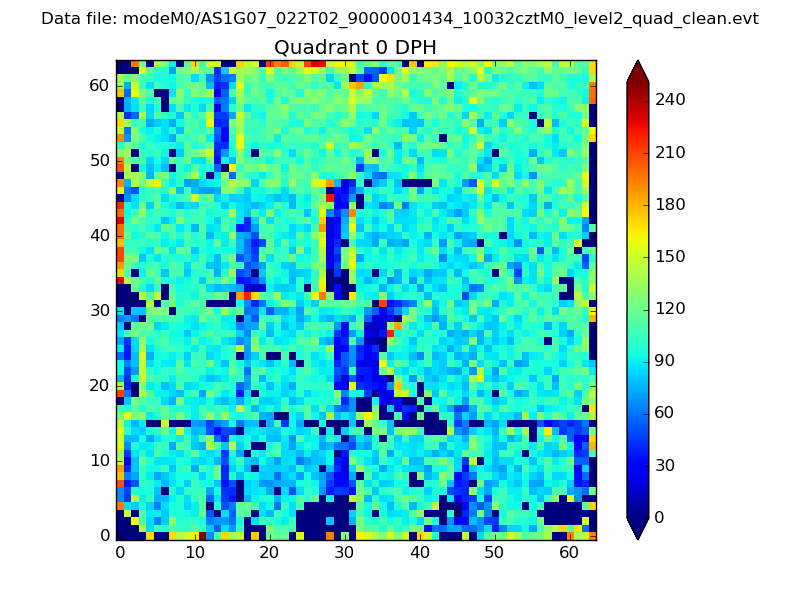 |
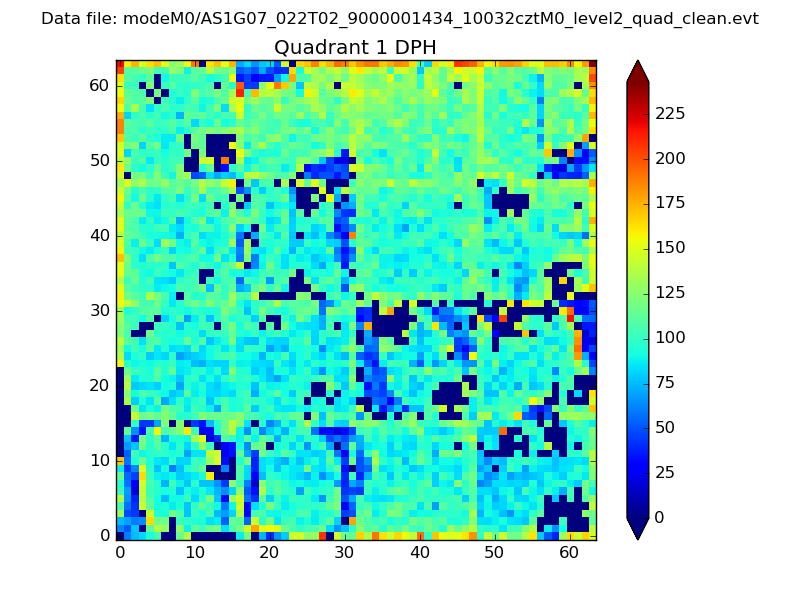 |
Quadrant B |
|---|---|---|---|
| Quadrant D | 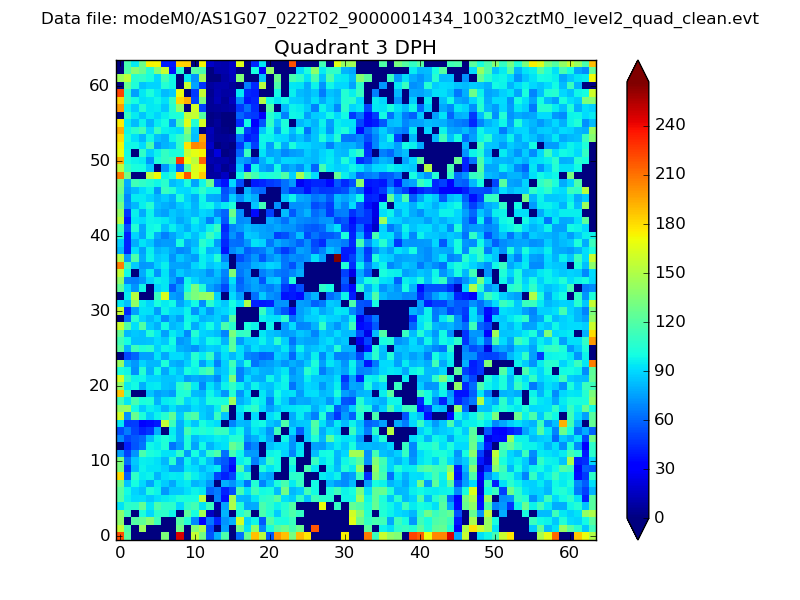 |
 |
Quadrant C |
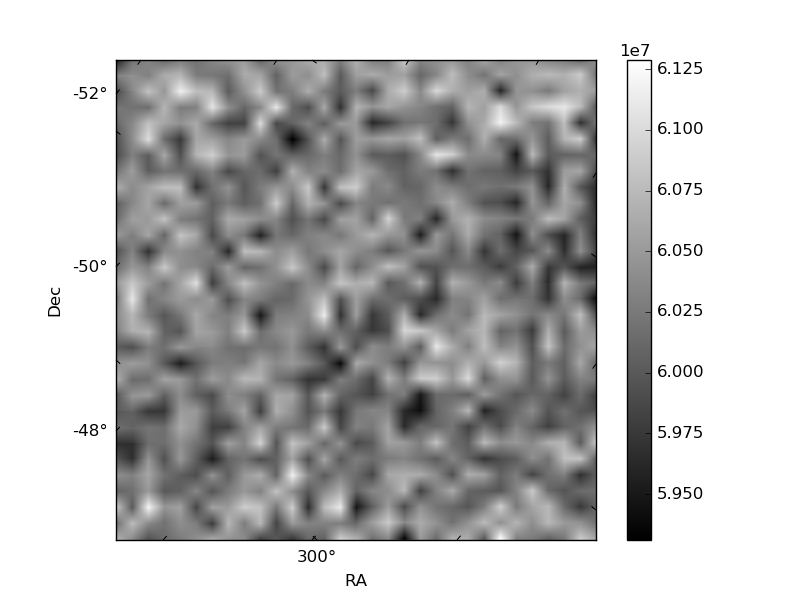
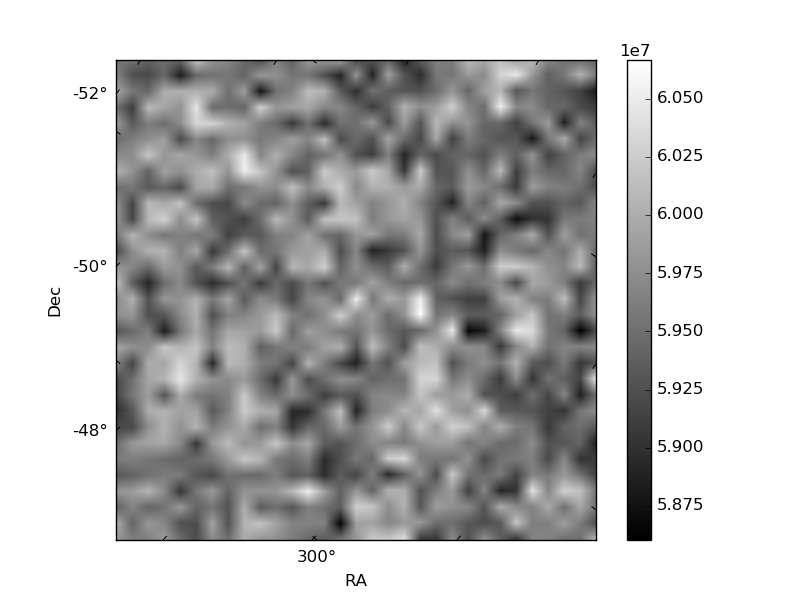
| Plot type | Count rate plots | Images |
|---|---|---|
| Comparison with Poisson distribution Blue bars denote a histogram of data divided into 1 sec bins. Red curve is a Poisson curve with rate = median count rate of data. |
 |
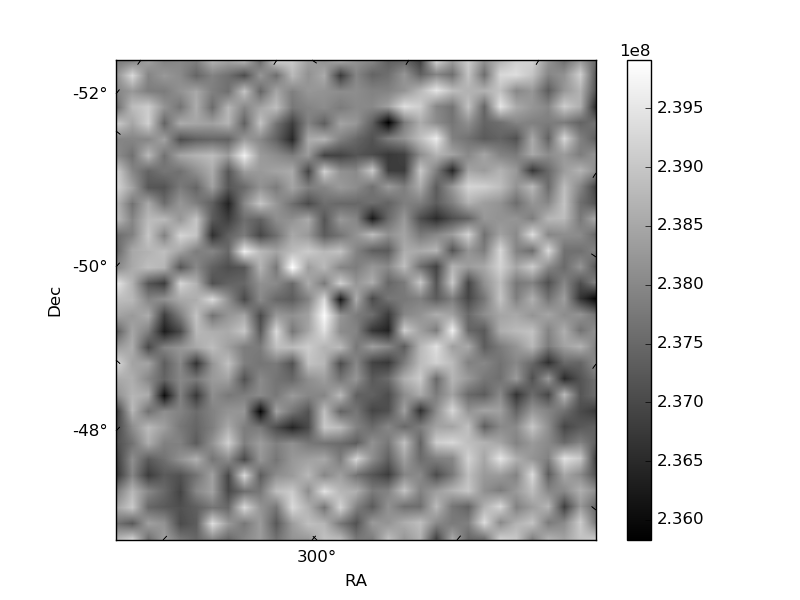 |
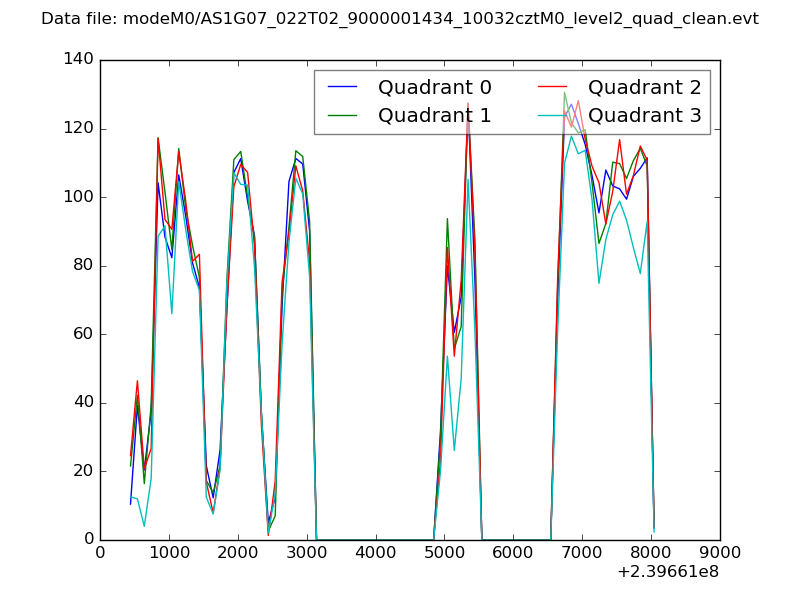
| Quadrant-wise count rates Data is divided into 100 sec bins |
 |
|
| Module-wise count rates for Quadrant A Data is divided into 100 sec bins |
 |
 |
| Module-wise count rates for Quadrant B Data is divided into 100 sec bins |
 |
 |
| Module-wise count rates for Quadrant C Data is divided into 100 sec bins |
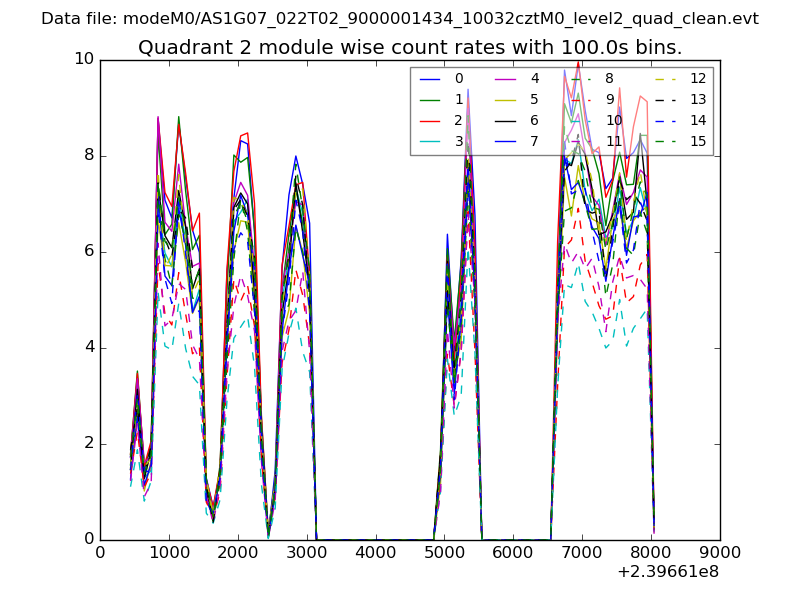 |
 |
| Module-wise count rates for Quadrant D Data is divided into 100 sec bins |
 |
 |
| Parameter | Plot |
|---|---|
| CZT HV Monitor | 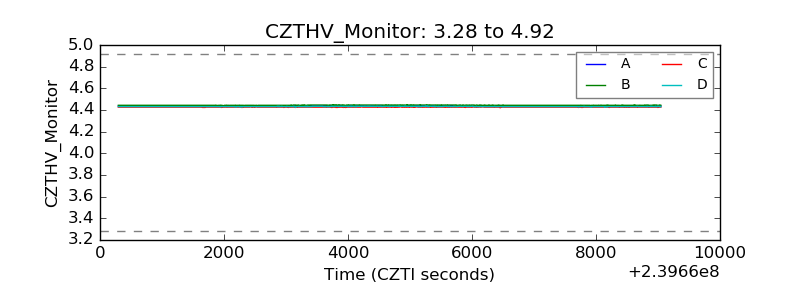 |
| D_VDD |  |
| Temperature 1 |  |
| Veto HV Monitor | 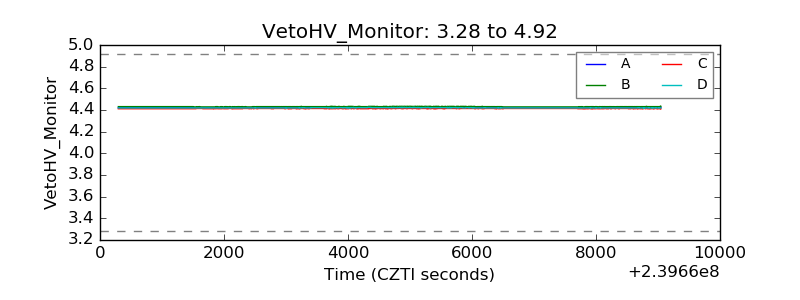 |
| Veto LLD |  |
| Alpha Counter | 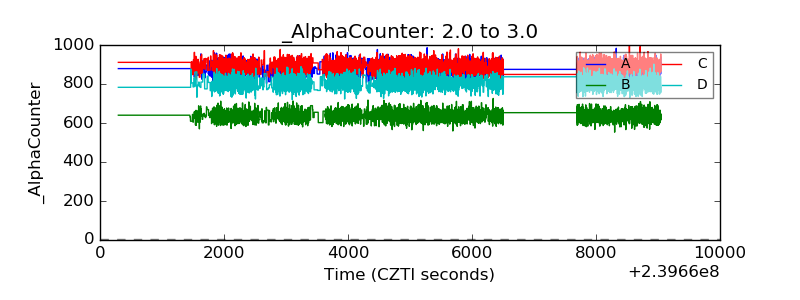 |
| _CPM_Rate | 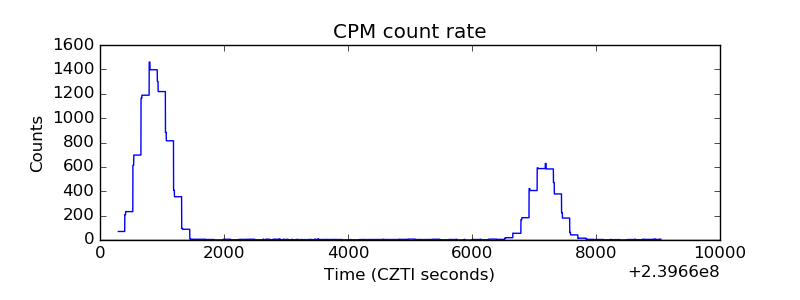 |
| CZT Counter | 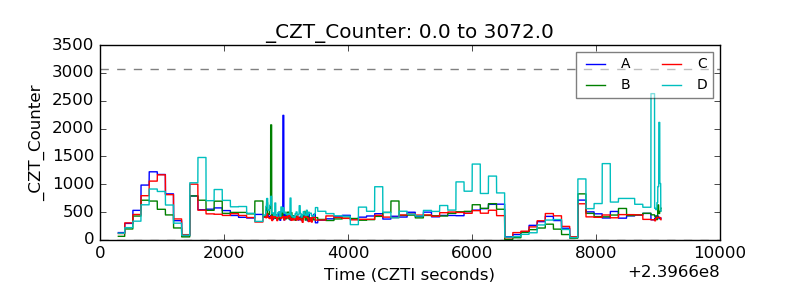 |
| +2.5 Volts monitor | 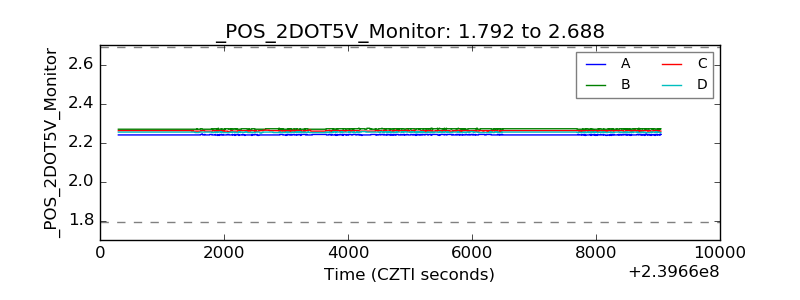 |
| +5 Volts monitor |  |
| _ROLL_ROT |  |
| _Roll_DEC |  |
| _Roll_RA | 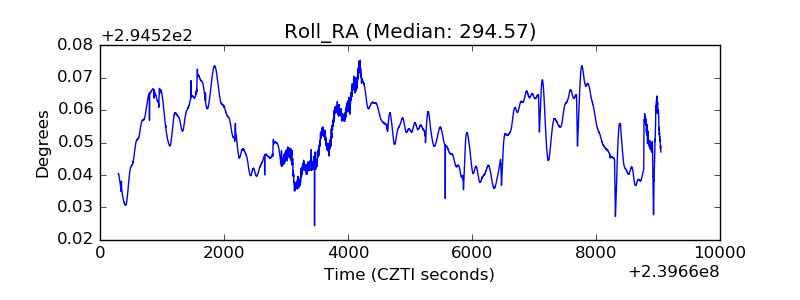 |
| Veto Counter |  |