| Param | Original file | Final file |
|---|---|---|
| Filename | modeM0/AS1G07_022T02_9000001434_10035cztM0_level2.evt | modeM0/AS1G07_022T02_9000001434_10035cztM0_level2_quad_clean.evt |
| Size (bytes) | 2,053,082,880 | 370,137,600 |
| Size | 1.9 GB | 353.0 MB |
| Events in quadrant A | 13,230,665 | 2,321,587 |
| Events in quadrant B | 13,728,554 | 2,372,775 |
| Events in quadrant C | 12,527,571 | 2,373,319 |
| Events in quadrant D | 20,769,704 | 2,186,311 |
| Mode M0 | |||
|---|---|---|---|
| Quadrant | BADHDUFLAG | Total packets | Discarded packets |
| A | 0 | 59417 | 102 |
| B | 0 | 60496 | 108 |
| C | 0 | 57998 | 83 |
| D | 0 | 81149 | 179 |
| Mode M9 | |||
|---|---|---|---|
| Quadrant | BADHDUFLAG | Total packets | Discarded packets |
| A | 0 | 45 | 0 |
| B | 0 | 45 | 0 |
| C | 0 | 45 | 0 |
| D | 0 | 46 | 0 |
| Mode SS | |||
|---|---|---|---|
| Quadrant | BADHDUFLAG | Total packets | Discarded packets |
| A | 0 | 582 | 0 |
| B | 0 | 582 | 0 |
| C | 0 | 582 | 2 |
| D | 0 | 582 | 2 |
| Quadrant | Total seconds | Saturated seconds | Saturation percentage |
|---|---|---|---|
| A | 28456 | 152 | 0.534158% |
| B | 28451 | 214 | 0.752170% |
| C | 28463 | 58 | 0.203773% |
| D | 28449 | 1177 | 4.137228% |
Noise dominated data is calculated using 1-second bins in cleaned event files. If a bin has >2000 counts, and if more than 50% of those come from <1% of pixels, then it is considered to be noise-dominated and hence unusable.
| Quadrant | # 1 sec bins | Bins with >0 counts | Bins with >2000 counts | High rate bins dominated by noise | Noise dominated (total time) | Noise dominated (detector-on time) | Marked lightcurve |
|---|---|---|---|---|---|---|---|
| A | 32690 | 28505 | 24 | 24 | 0.07% | 0.08% | 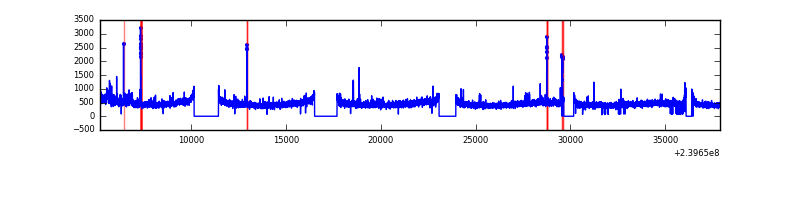 |
| B | 32690 | 28504 | 29 | 29 | 0.09% | 0.10% | 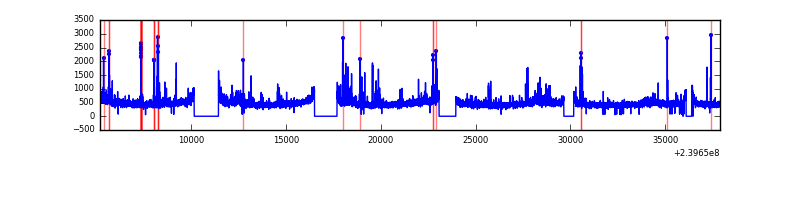 |
| C | 32690 | 28504 | 0 | 0 | 0.00% | 0.00% | 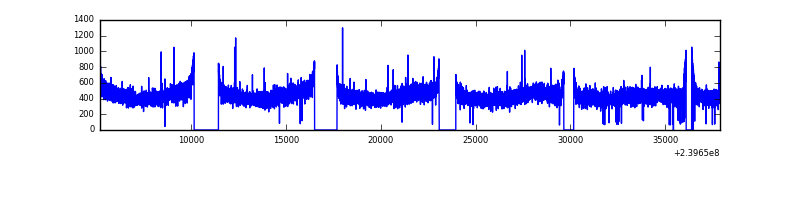 |
| D | 32690 | 28499 | 1059 | 1059 | 3.24% | 3.72% | 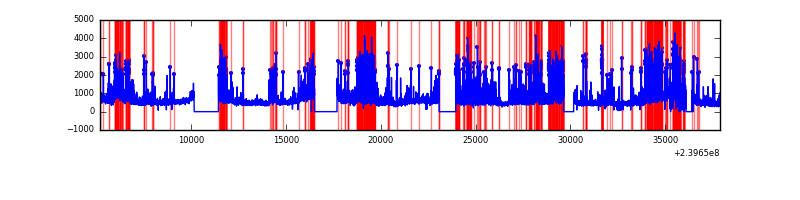 |
Top three noisy pixels from each quadrant. If the there are fewer than three noisy pixels in the level2.evt file, extra rows are filled as -1
| Pixel properties | Quadrant properties | ||||||
|---|---|---|---|---|---|---|---|
| Quadrant | DetID | PixID | Counts | Sigma | Mean | Median | Sigma |
| A | 8 | 15 | 423259 | 641.7 | 3269 | 3200 | 654.6 |
| A | 15 | 174 | 155015 | 231.92 | 3269 | 3200 | 654.6 |
| A | 8 | 5 | 38223 | 53.5 | 3269 | 3200 | 654.6 |
| B | 4 | 81 | 487309 | 775.97 | 3314 | 3235 | 623.8 |
| B | 4 | 239 | 168234 | 264.49 | 3314 | 3235 | 623.8 |
| B | 0 | 214 | 124633 | 194.6 | 3314 | 3235 | 623.8 |
| C | 13 | 61 | 23828 | 27.85 | 3207 | 3222 | 739.9 |
| C | 8 | 222 | 15180 | 16.16 | 3207 | 3222 | 739.9 |
| C | 14 | 67 | 12727 | 12.85 | 3207 | 3222 | 739.9 |
| D | 2 | 16 | 5252880 | 6688.41 | 3112 | 3030 | 784.9 |
| D | 8 | 195 | 1440237 | 1831.03 | 3112 | 3030 | 784.9 |
| D | 1 | 52 | 848607 | 1077.28 | 3112 | 3030 | 784.9 |
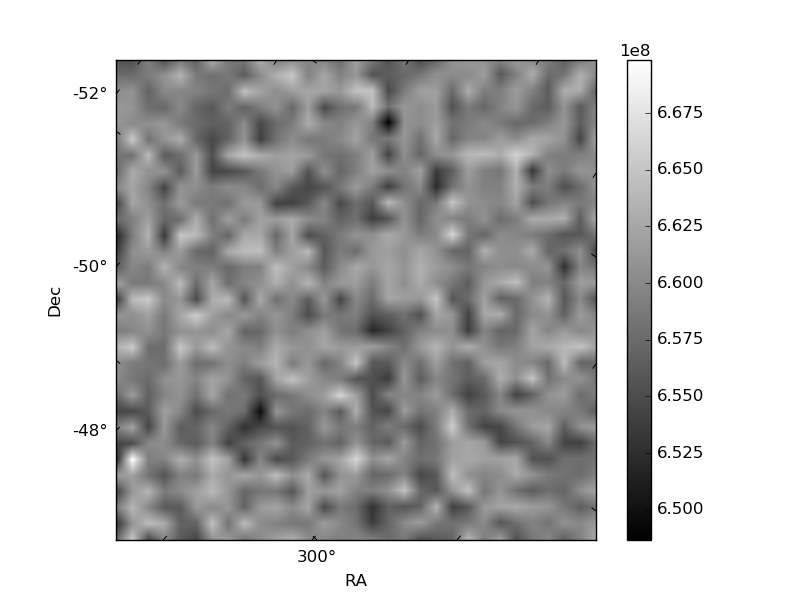
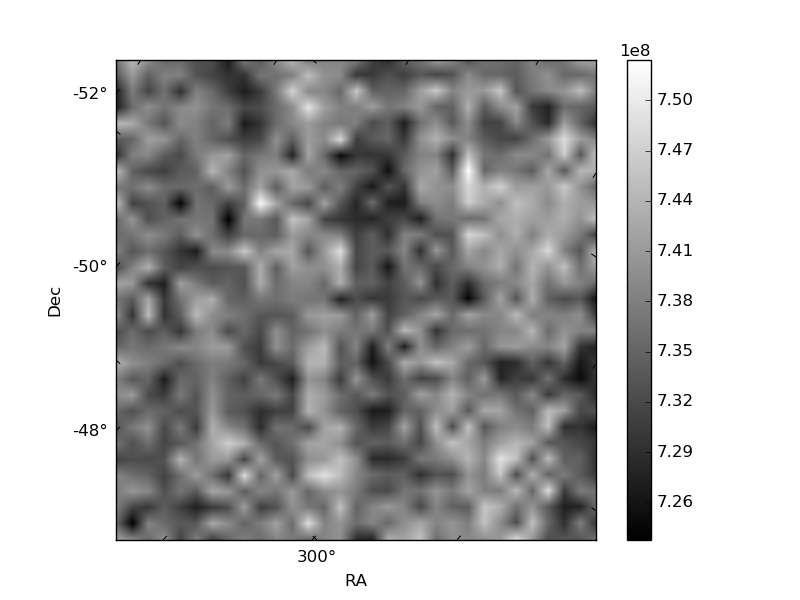
Histogram calculated using DETX and DETY for each event in the final _common_clean file
| Quadrant A | 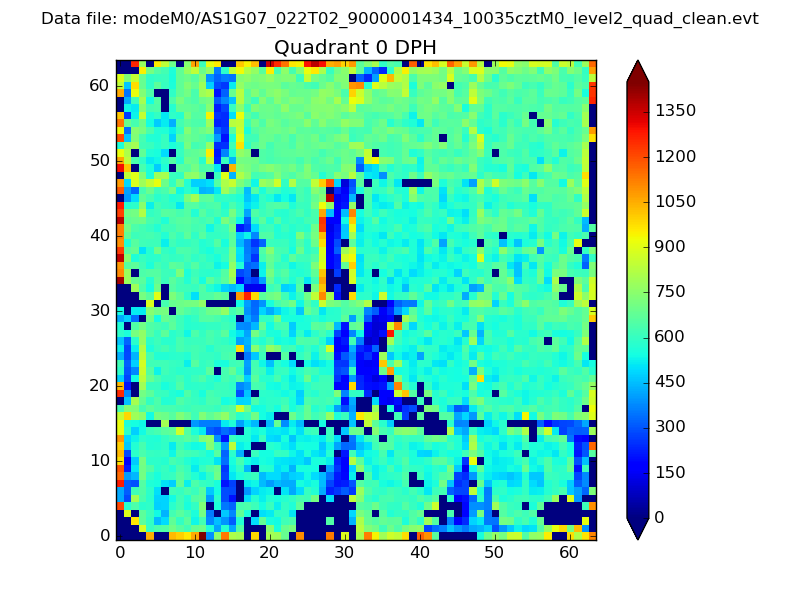 |
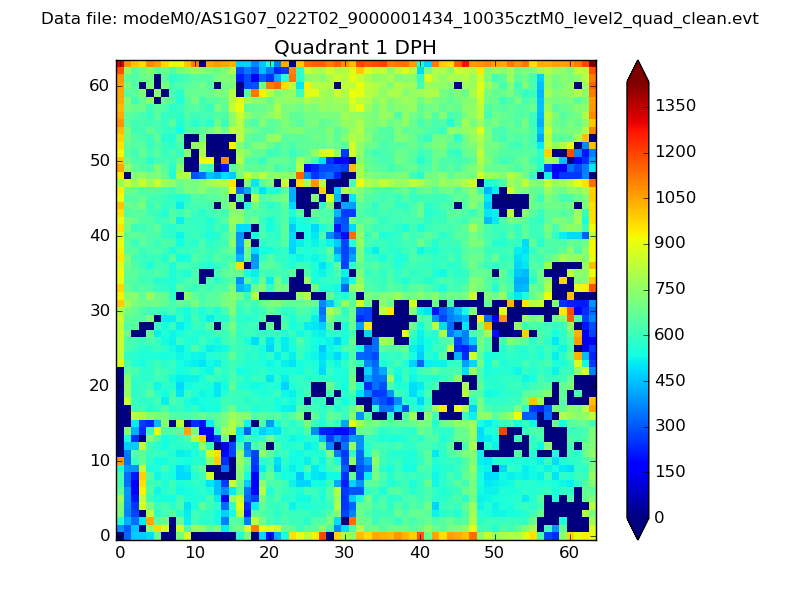 |
Quadrant B |
|---|---|---|---|
| Quadrant D | 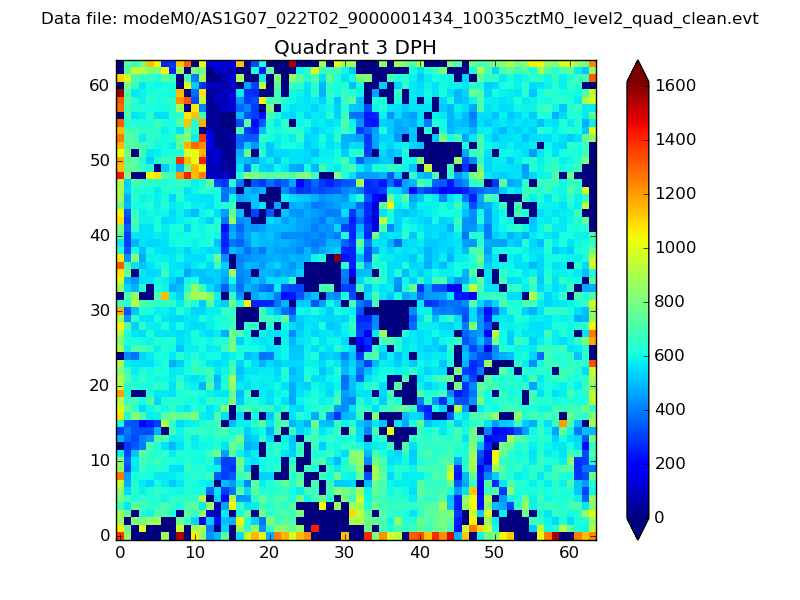 |
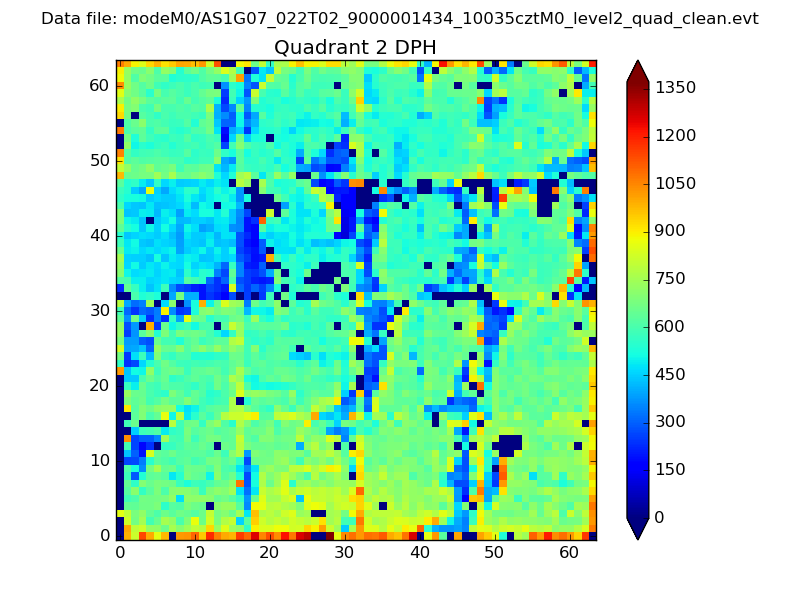 |
Quadrant C |
| Plot type | Count rate plots | Images |
|---|---|---|
| Comparison with Poisson distribution Blue bars denote a histogram of data divided into 1 sec bins. Red curve is a Poisson curve with rate = median count rate of data. |
 |
 |
| Quadrant-wise count rates Data is divided into 100 sec bins |
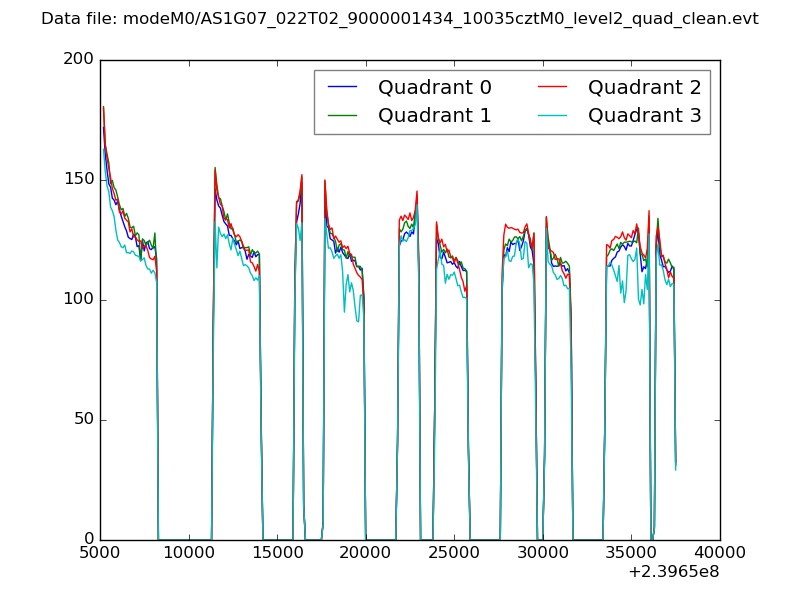 |
|
| Module-wise count rates for Quadrant A Data is divided into 100 sec bins |
 |
 |
| Module-wise count rates for Quadrant B Data is divided into 100 sec bins |
 |
 |
| Module-wise count rates for Quadrant C Data is divided into 100 sec bins |
 |
 |
| Module-wise count rates for Quadrant D Data is divided into 100 sec bins |
 |
 |
| Parameter | Plot |
|---|---|
| CZT HV Monitor |  |
| D_VDD | 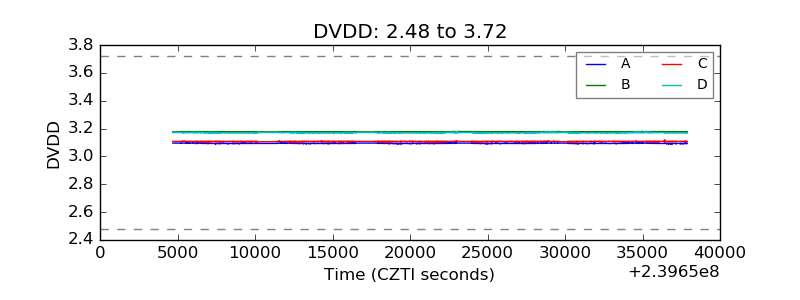 |
| Temperature 1 | 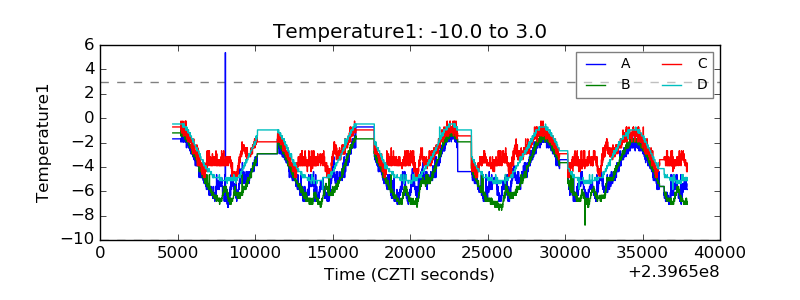 |
| Veto HV Monitor | 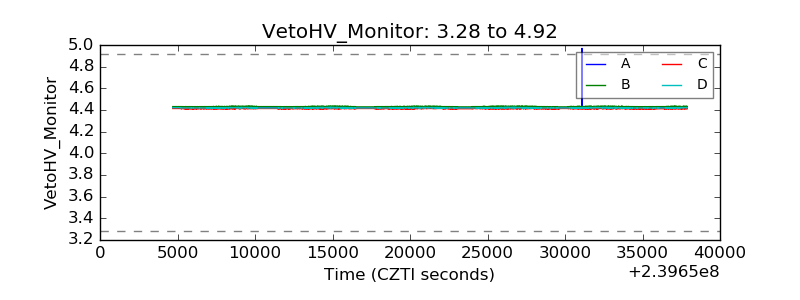 |
| Veto LLD | 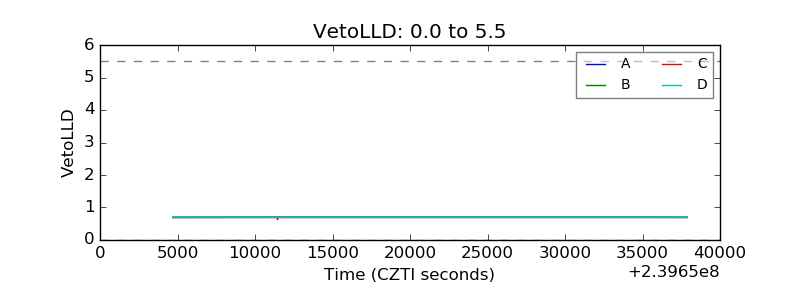 |
| Alpha Counter | 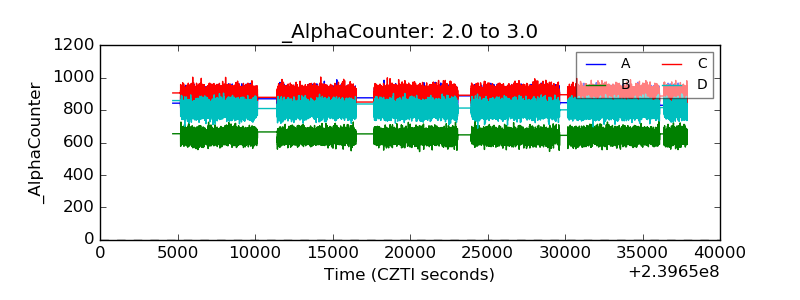 |
| _CPM_Rate | 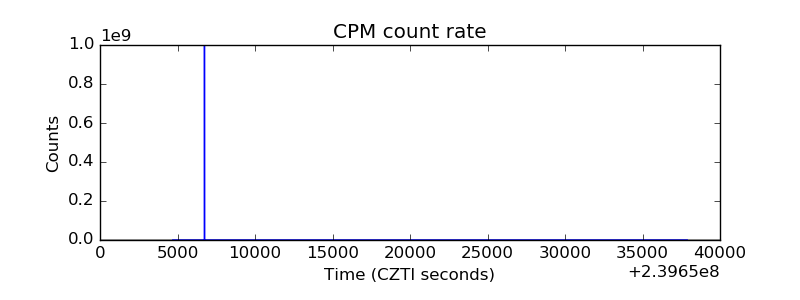 |
| CZT Counter | 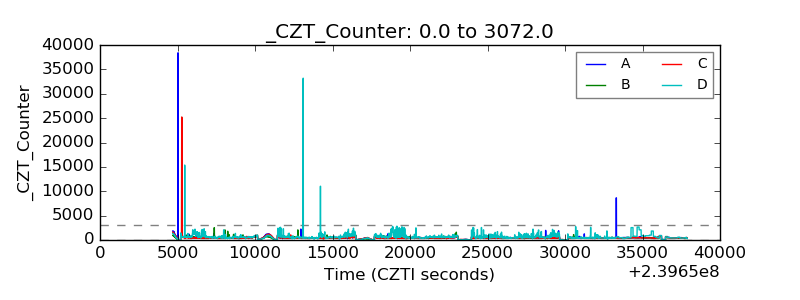 |
| +2.5 Volts monitor |  |
| +5 Volts monitor |  |
| _ROLL_ROT | 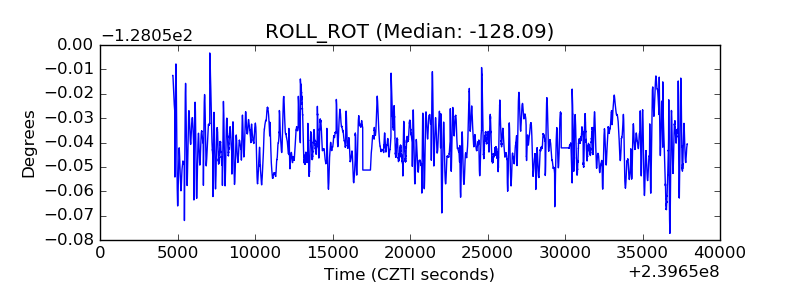 |
| _Roll_DEC |  |
| _Roll_RA | 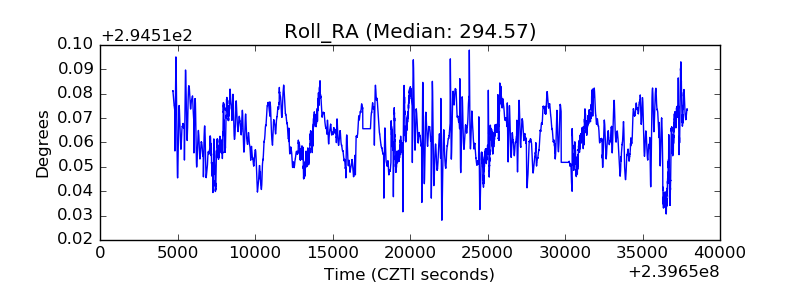 |
| Veto Counter |  |