| Param | Original file | Final file |
|---|---|---|
| Filename | modeM0/AS1G07_022T02_9000001434_10036cztM0_level2.evt | modeM0/AS1G07_022T02_9000001434_10036cztM0_level2_quad_clean.evt |
| Size (bytes) | 466,320,960 | 87,338,880 |
| Size | 444.7 MB | 83.3 MB |
| Events in quadrant A | 3,222,208 | 532,232 |
| Events in quadrant B | 3,289,188 | 547,149 |
| Events in quadrant C | 3,113,872 | 548,963 |
| Events in quadrant D | 4,010,789 | 518,313 |
| Mode M0 | |||
|---|---|---|---|
| Quadrant | BADHDUFLAG | Total packets | Discarded packets |
| A | 0 | 14990 | 228 |
| B | 0 | 14986 | 179 |
| C | 0 | 14750 | 208 |
| D | 0 | 17160 | 427 |
| Mode M9 | |||
|---|---|---|---|
| Quadrant | BADHDUFLAG | Total packets | Discarded packets |
| A | 0 | 4 | 0 |
| B | 0 | 4 | 0 |
| C | 0 | 4 | 0 |
| D | 0 | 4 | 0 |
| Mode SS | |||
|---|---|---|---|
| Quadrant | BADHDUFLAG | Total packets | Discarded packets |
| A | 0 | 146 | 0 |
| B | 0 | 146 | 2 |
| C | 0 | 146 | 2 |
| D | 0 | 146 | 4 |
| Quadrant | Total seconds | Saturated seconds | Saturation percentage |
|---|---|---|---|
| A | 7150 | 49 | 0.685315% |
| B | 7174 | 54 | 0.752718% |
| C | 7157 | 44 | 0.614783% |
| D | 7140 | 124 | 1.736695% |
Noise dominated data is calculated using 1-second bins in cleaned event files. If a bin has >2000 counts, and if more than 50% of those come from <1% of pixels, then it is considered to be noise-dominated and hence unusable.
| Quadrant | # 1 sec bins | Bins with >0 counts | Bins with >2000 counts | High rate bins dominated by noise | Noise dominated (total time) | Noise dominated (detector-on time) | Marked lightcurve |
|---|---|---|---|---|---|---|---|
| A | 7631 | 7249 | 3 | 3 | 0.04% | 0.04% | 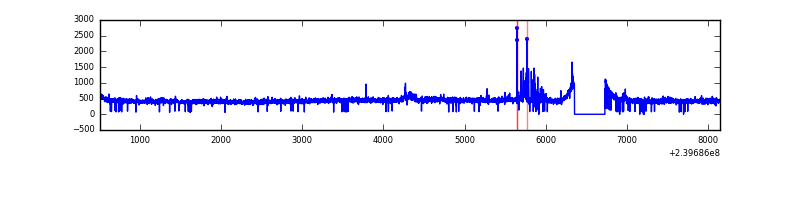 |
| B | 7631 | 7253 | 1 | 1 | 0.01% | 0.01% | 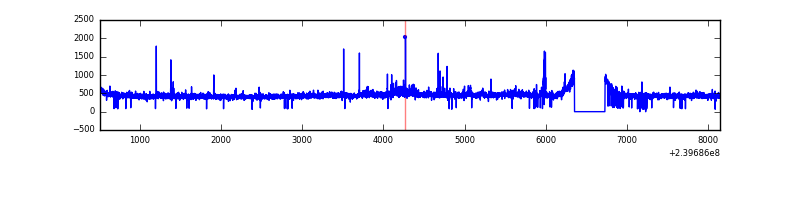 |
| C | 7631 | 7250 | 0 | 0 | 0.00% | 0.00% | 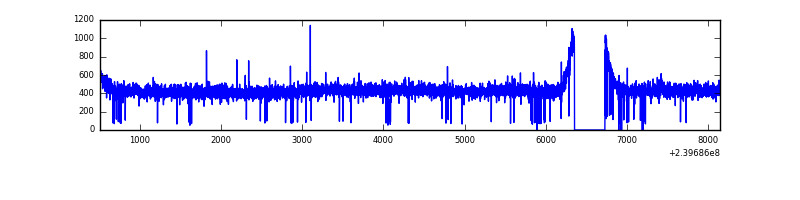 |
| D | 7631 | 7232 | 86 | 86 | 1.13% | 1.19% | 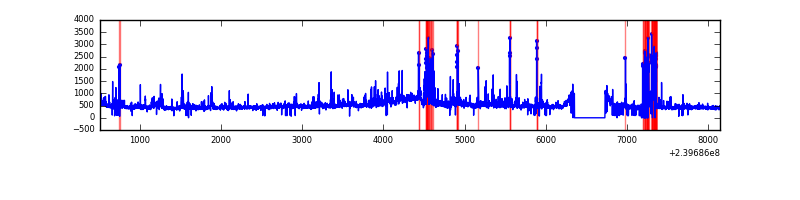 |
Top three noisy pixels from each quadrant. If the there are fewer than three noisy pixels in the level2.evt file, extra rows are filled as -1
| Pixel properties | Quadrant properties | ||||||
|---|---|---|---|---|---|---|---|
| Quadrant | DetID | PixID | Counts | Sigma | Mean | Median | Sigma |
| A | 15 | 239 | 65155 | 388.6 | 804 | 786 | 165.6 |
| A | 8 | 15 | 50091 | 297.66 | 804 | 786 | 165.6 |
| A | 0 | 226 | 7314 | 39.41 | 804 | 786 | 165.6 |
| B | 0 | 214 | 52509 | 329.21 | 817 | 796 | 157.1 |
| B | 4 | 239 | 21399 | 131.16 | 817 | 796 | 157.1 |
| B | 12 | 111 | 17559 | 106.71 | 817 | 796 | 157.1 |
| C | 13 | 61 | 5887 | 27.4 | 795 | 798 | 185.7 |
| C | 8 | 128 | 4199 | 18.31 | 795 | 798 | 185.7 |
| C | 9 | 221 | 2922 | 11.44 | 795 | 798 | 185.7 |
| D | 2 | 16 | 230743 | 1179.4 | 776 | 756 | 195.0 |
| D | 8 | 195 | 213237 | 1089.62 | 776 | 756 | 195.0 |
| D | 13 | 122 | 185362 | 946.68 | 776 | 756 | 195.0 |
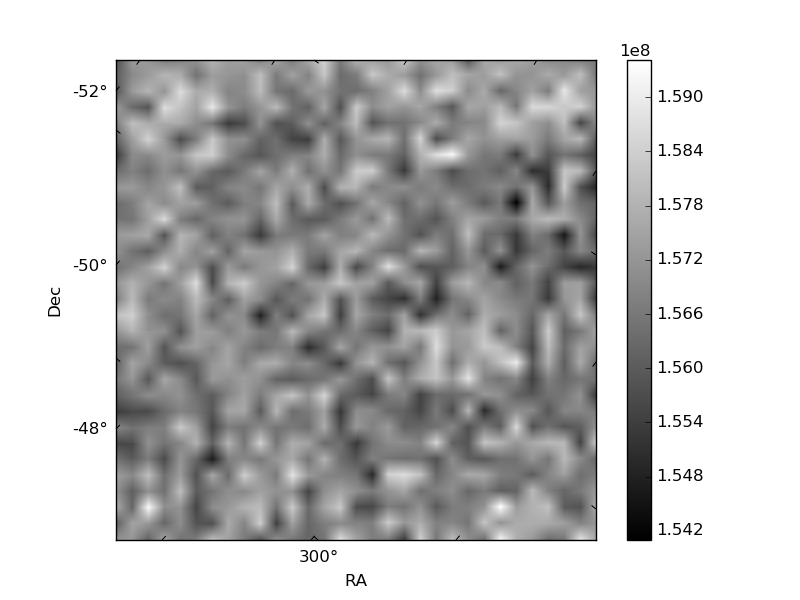
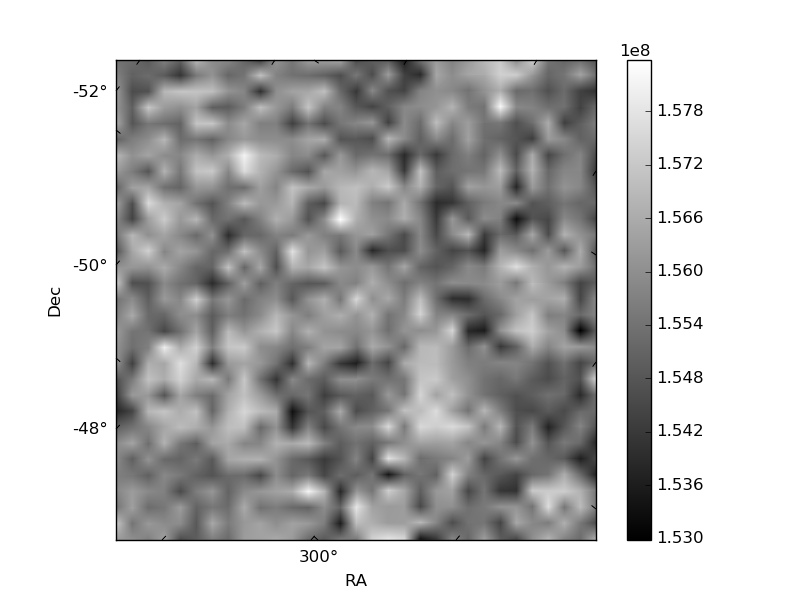
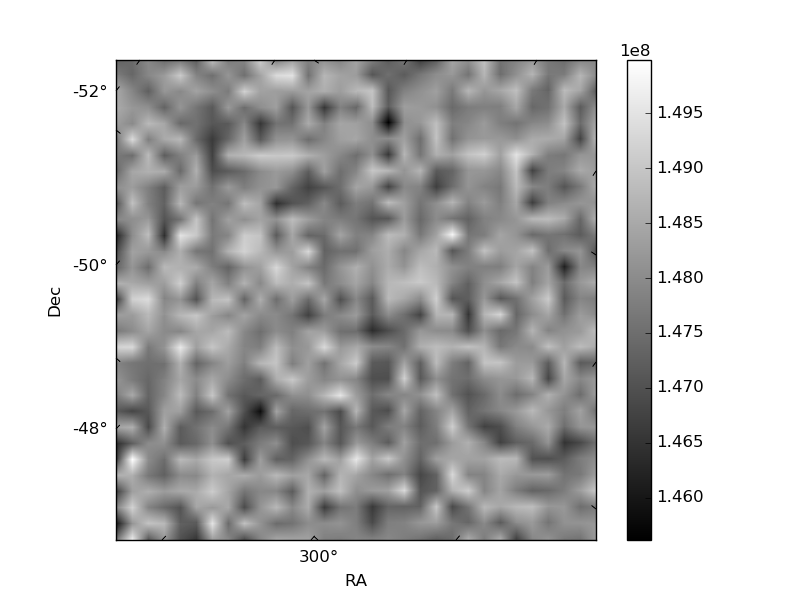
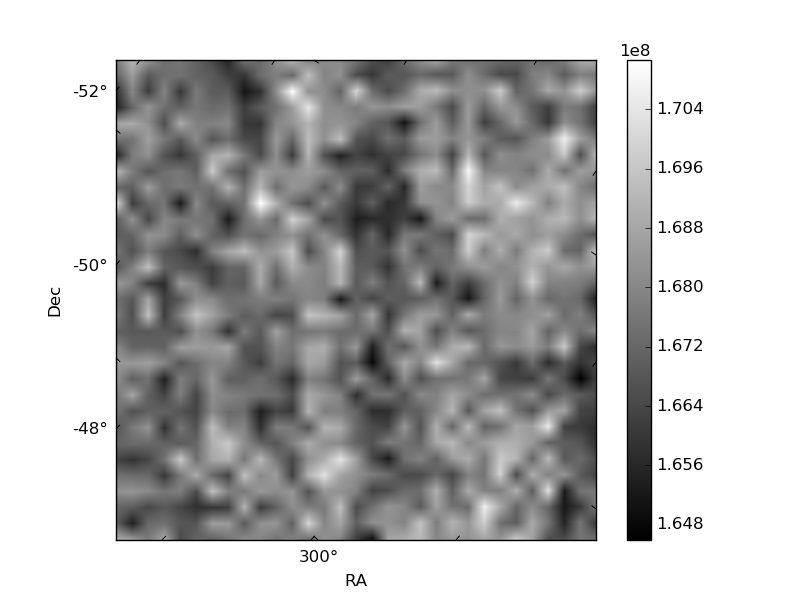
Histogram calculated using DETX and DETY for each event in the final _common_clean file
| Quadrant A | 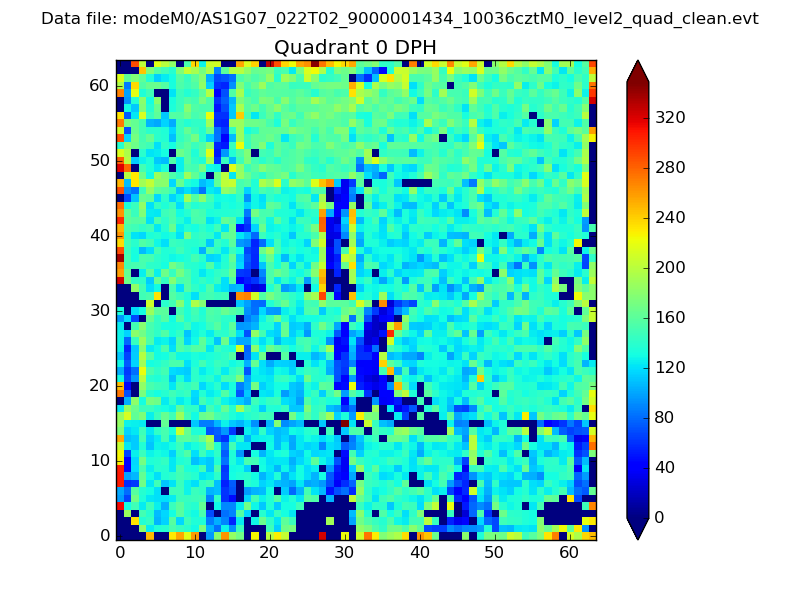 |
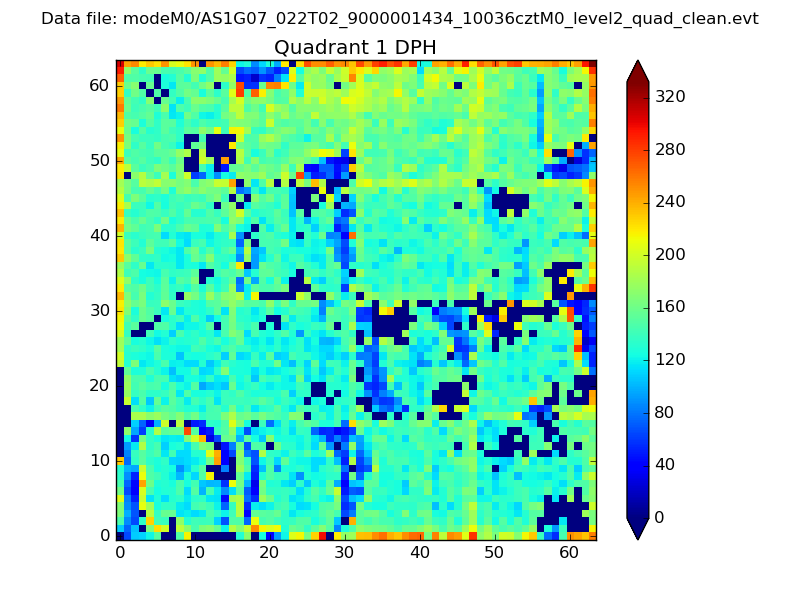 |
Quadrant B |
|---|---|---|---|
| Quadrant D | 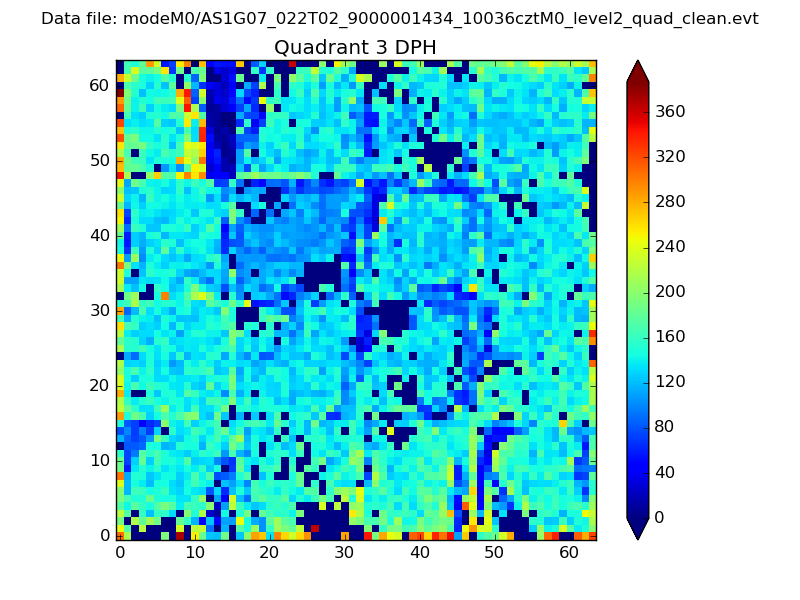 |
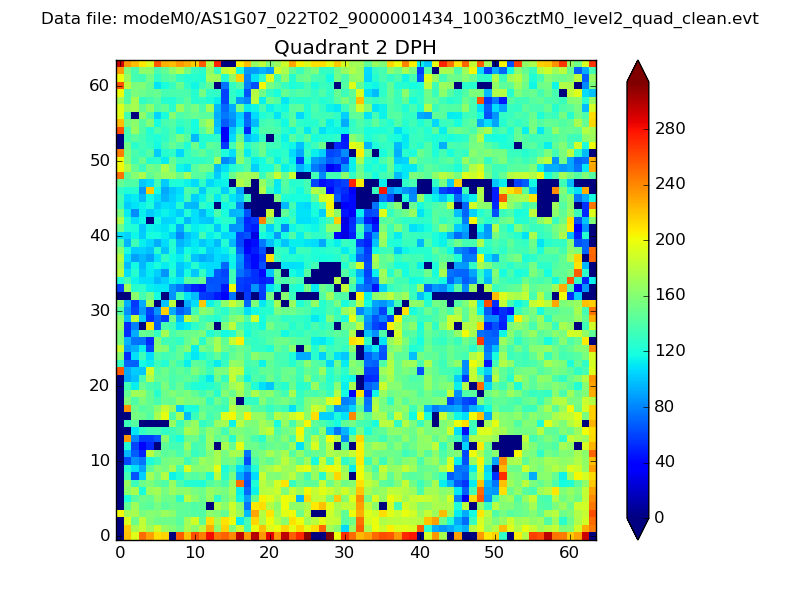 |
Quadrant C |
| Plot type | Count rate plots | Images |
|---|---|---|
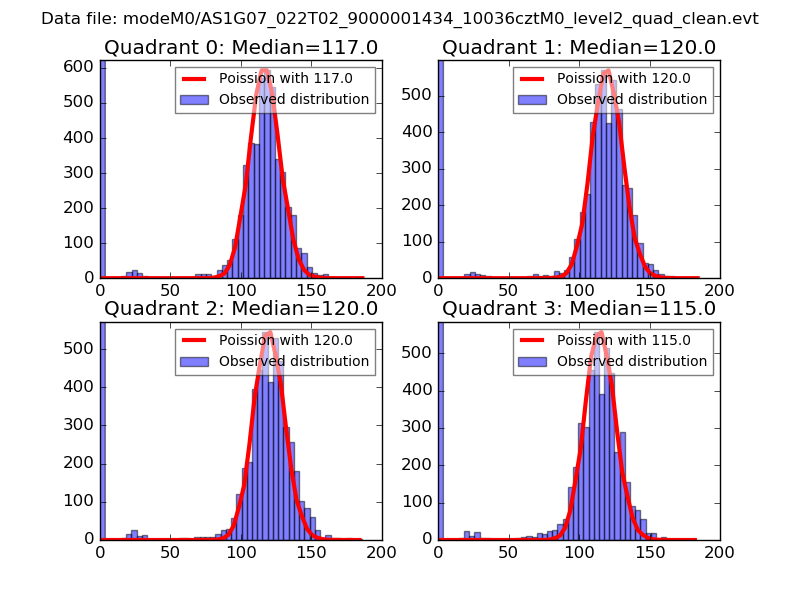
| Comparison with Poisson distribution Blue bars denote a histogram of data divided into 1 sec bins. Red curve is a Poisson curve with rate = median count rate of data. |
 |
 |
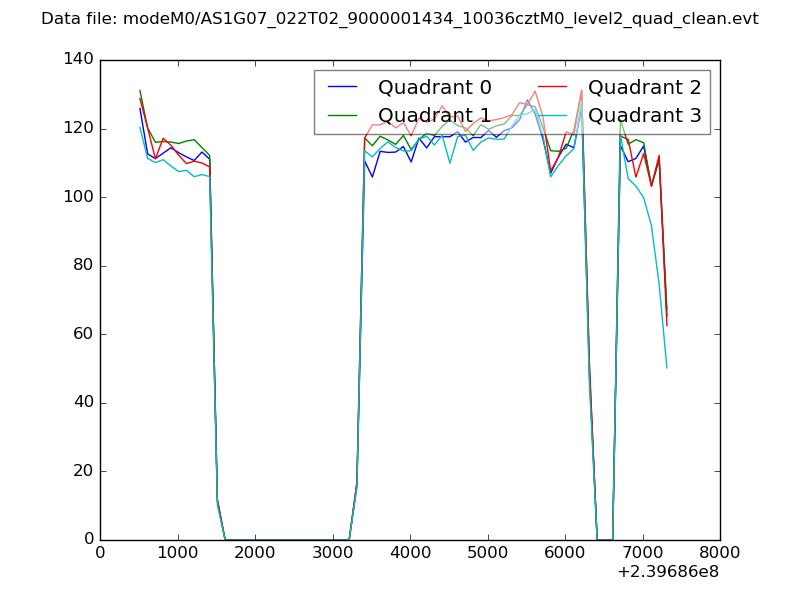
| Quadrant-wise count rates Data is divided into 100 sec bins |
 |
|
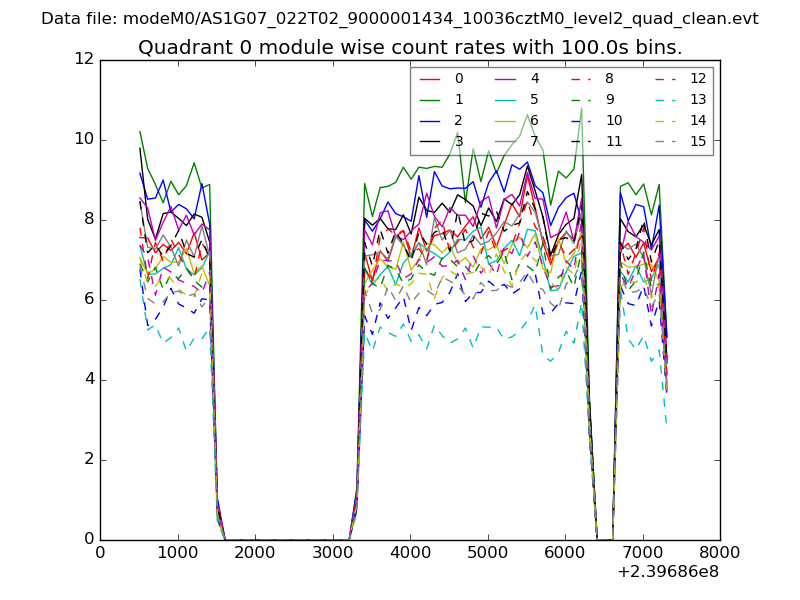
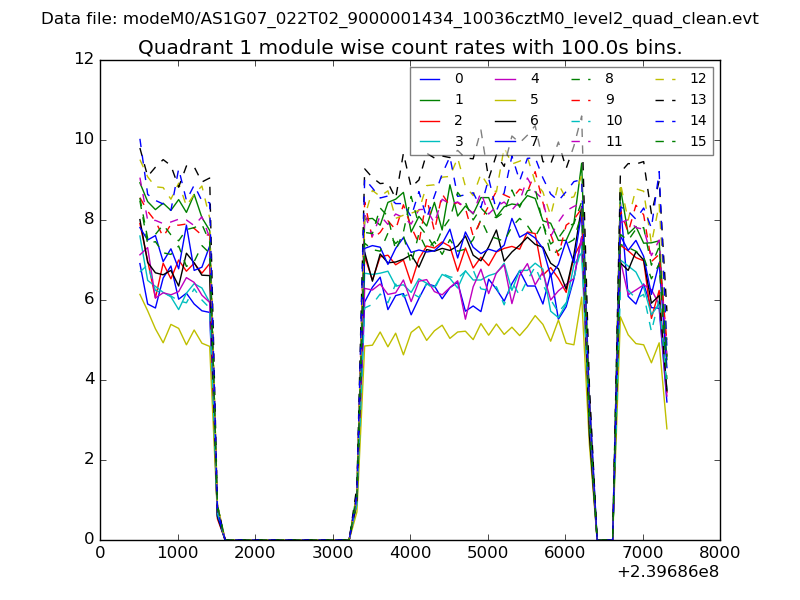
| Module-wise count rates for Quadrant A Data is divided into 100 sec bins |
 |
 |
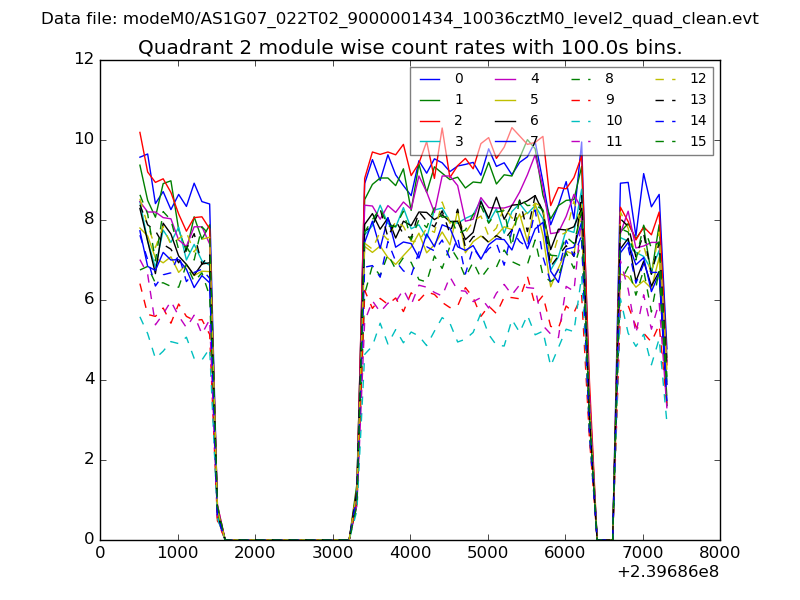
| Module-wise count rates for Quadrant B Data is divided into 100 sec bins |
 |
 |
| Module-wise count rates for Quadrant C Data is divided into 100 sec bins |
 |
 |
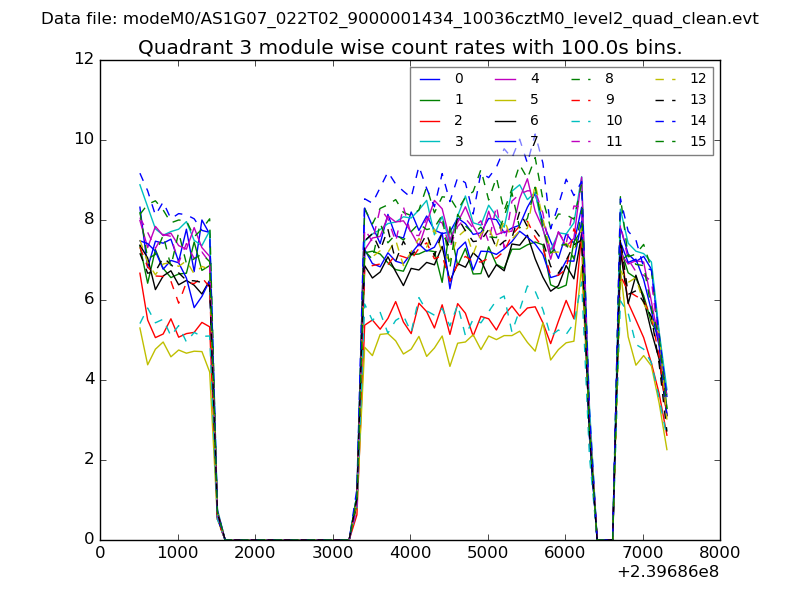
| Module-wise count rates for Quadrant D Data is divided into 100 sec bins |
 |
 |
| Parameter | Plot |
|---|---|
| CZT HV Monitor | 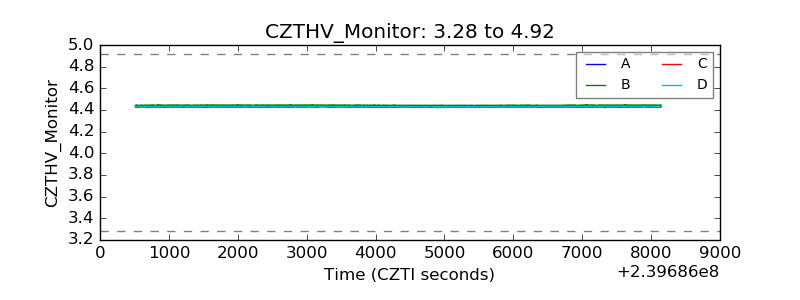 |
| D_VDD | 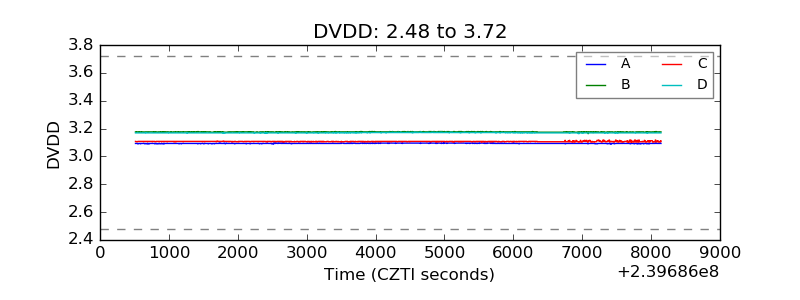 |
| Temperature 1 | 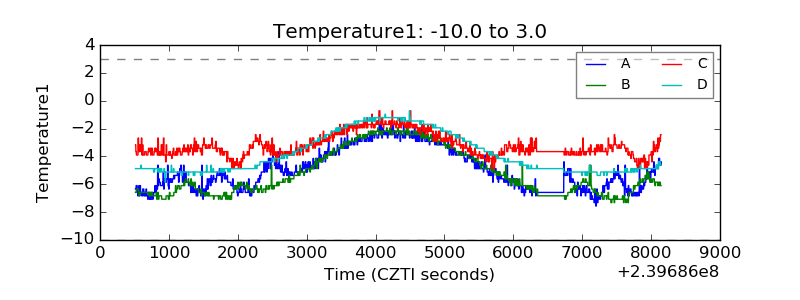 |
| Veto HV Monitor | 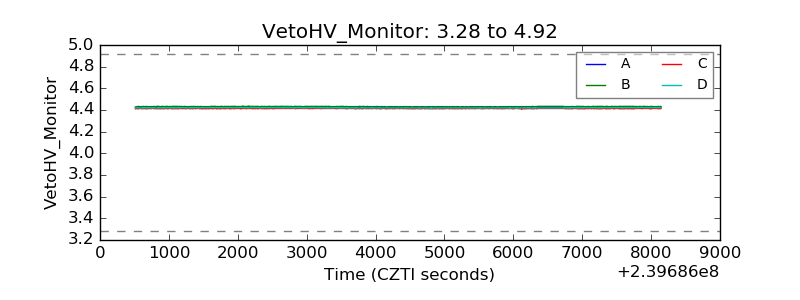 |
| Veto LLD | 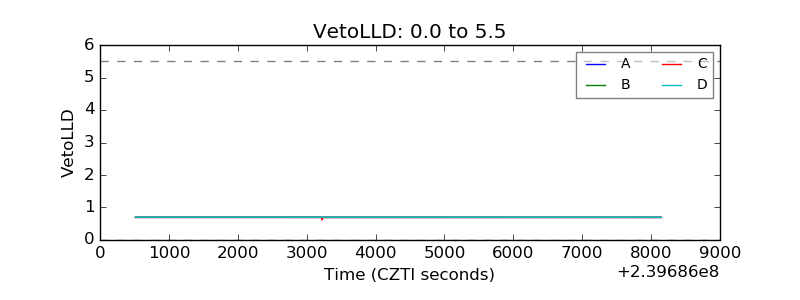 |
| Alpha Counter | 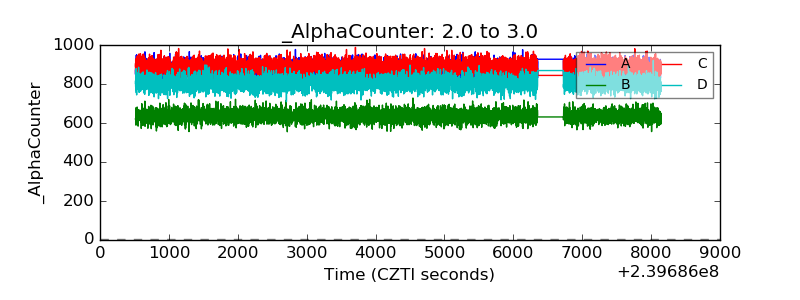 |
| _CPM_Rate | 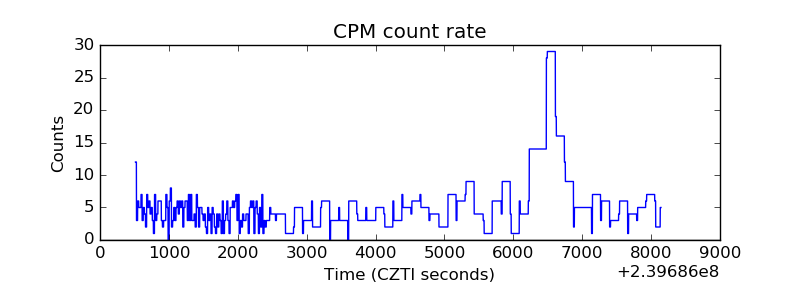 |
| CZT Counter | 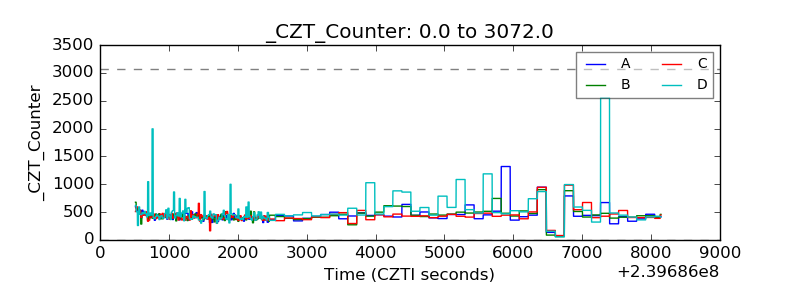 |
| +2.5 Volts monitor |  |
| +5 Volts monitor |  |
| _ROLL_ROT | 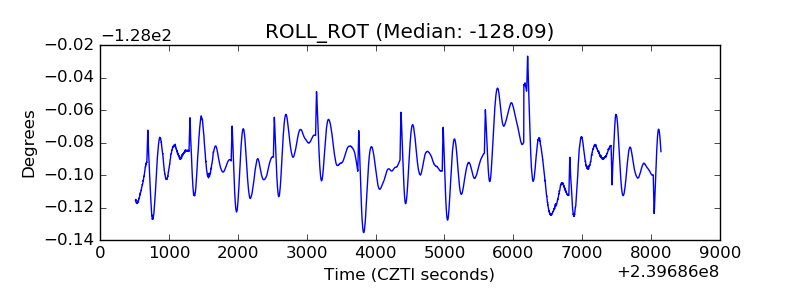 |
| _Roll_DEC | 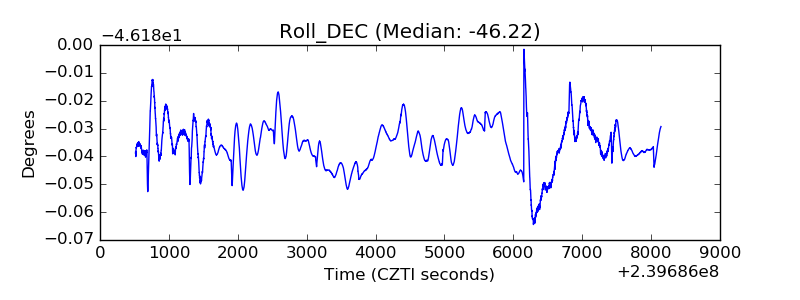 |
| _Roll_RA | 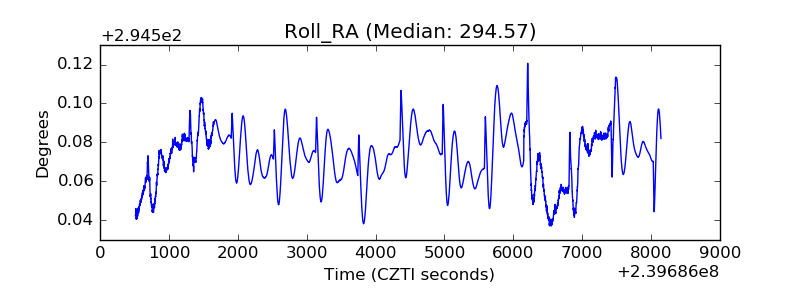 |
| Veto Counter | 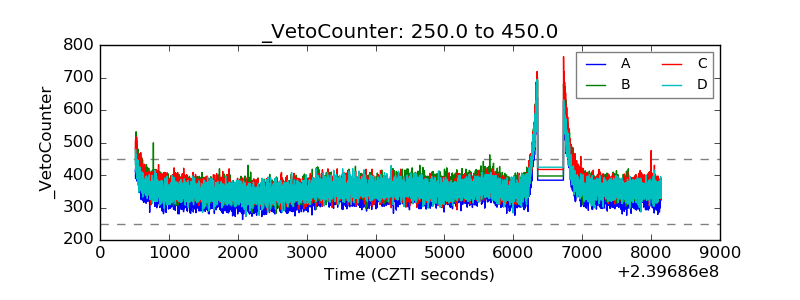 |