| Param | Original file | Final file |
|---|---|---|
| Filename | modeM0/AS1G07_022T02_9000001434_10038cztM0_level2.evt | modeM0/AS1G07_022T02_9000001434_10038cztM0_level2_quad_clean.evt |
| Size (bytes) | 23,114,880 | 4,685,760 |
| Size | 22.0 MB | 4.5 MB |
| Events in quadrant A | 157,166 | 24,017 |
| Events in quadrant B | 166,102 | 28,558 |
| Events in quadrant C | 168,680 | 29,715 |
| Events in quadrant D | 178,763 | 24,832 |
| Mode M0 | |||
|---|---|---|---|
| Quadrant | BADHDUFLAG | Total packets | Discarded packets |
| A | 0 | 16795 | 16094 |
| B | 0 | 16720 | 15978 |
| C | 0 | 16518 | 15724 |
| D | 0 | 18534 | 17800 |
| Mode M9 | |||
|---|---|---|---|
| Quadrant | BADHDUFLAG | Total packets | Discarded packets |
| A | 0 | 8 | 8 |
| B | 0 | 11 | 11 |
| C | 0 | 7 | 7 |
| D | 0 | 7 | 7 |
| Mode SS | |||
|---|---|---|---|
| Quadrant | BADHDUFLAG | Total packets | Discarded packets |
| A | 0 | 168 | 156 |
| B | 0 | 169 | 161 |
| C | 0 | 166 | 158 |
| D | 0 | 166 | 158 |
| Quadrant | Total seconds | Saturated seconds | Saturation percentage |
|---|---|---|---|
| A | 346 | 0 | 0.000000% |
| B | 368 | 0 | 0.000000% |
| C | 397 | 0 | 0.000000% |
| D | 356 | 0 | 0.000000% |
Noise dominated data is calculated using 1-second bins in cleaned event files. If a bin has >2000 counts, and if more than 50% of those come from <1% of pixels, then it is considered to be noise-dominated and hence unusable.
| Quadrant | # 1 sec bins | Bins with >0 counts | Bins with >2000 counts | High rate bins dominated by noise | Noise dominated (total time) | Noise dominated (detector-on time) | Marked lightcurve |
|---|---|---|---|---|---|---|---|
| A | 9096 | 553 | 0 | 0 | 0.00% | 0.00% | 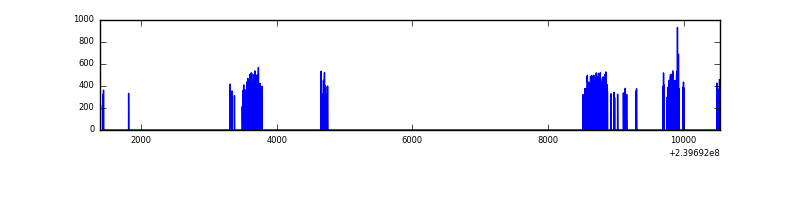 |
| B | 9089 | 594 | 0 | 0 | 0.00% | 0.00% | 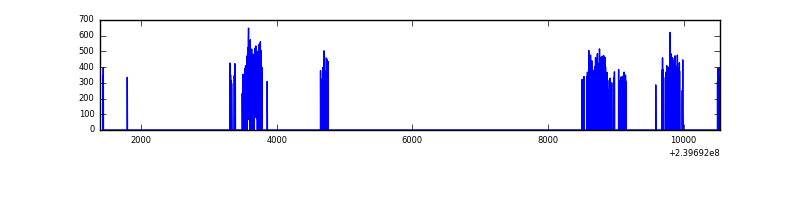 |
| C | 9120 | 631 | 0 | 0 | 0.00% | 0.00% | 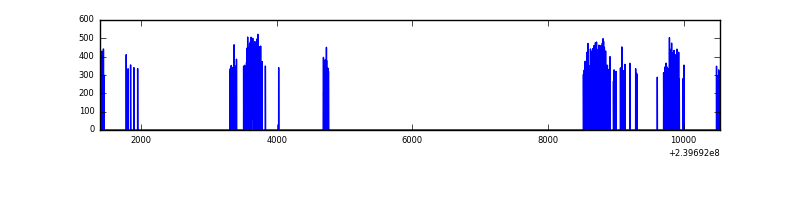 |
| D | 8621 | 569 | 0 | 0 | 0.00% | 0.00% | 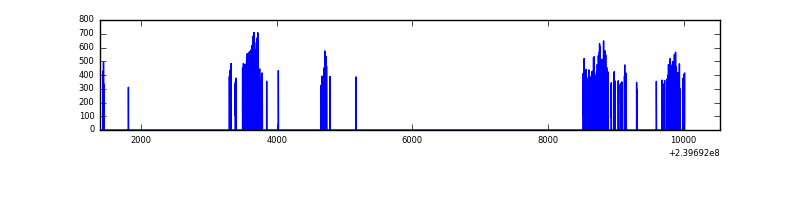 |
Top three noisy pixels from each quadrant. If the there are fewer than three noisy pixels in the level2.evt file, extra rows are filled as -1
| Pixel properties | Quadrant properties | ||||||
|---|---|---|---|---|---|---|---|
| Quadrant | DetID | PixID | Counts | Sigma | Mean | Median | Sigma |
| A | 8 | 15 | 5110 | 506.8 | 38 | 37 | 10.0 |
| A | 13 | 251 | 2251 | 221.18 | 38 | 37 | 10.0 |
| A | 0 | 8 | 1818 | 177.92 | 38 | 37 | 10.0 |
| B | 0 | 214 | 5778 | 583.7 | 40 | 39 | 9.8 |
| B | 0 | 229 | 1034 | 101.2 | 40 | 39 | 9.8 |
| B | 12 | 111 | 863 | 83.81 | 40 | 39 | 9.8 |
| C | 8 | 128 | 393 | 29.54 | 42 | 43 | 11.8 |
| C | 9 | 221 | 306 | 22.2 | 42 | 43 | 11.8 |
| C | 13 | 61 | 305 | 22.11 | 42 | 43 | 11.8 |
| D | 8 | 195 | 15236 | 1342.94 | 38 | 37 | 11.3 |
| D | 2 | 16 | 6866 | 603.39 | 38 | 37 | 11.3 |
| D | 1 | 52 | 5075 | 445.14 | 38 | 37 | 11.3 |
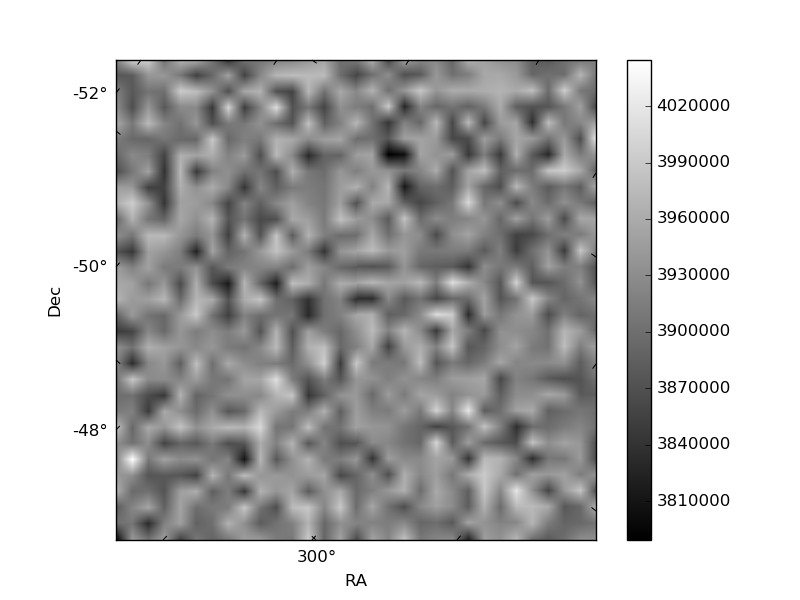
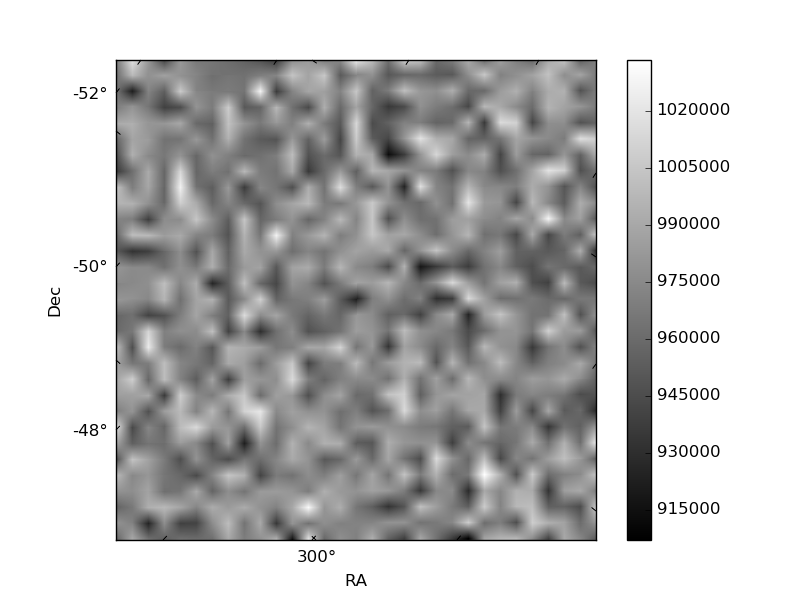
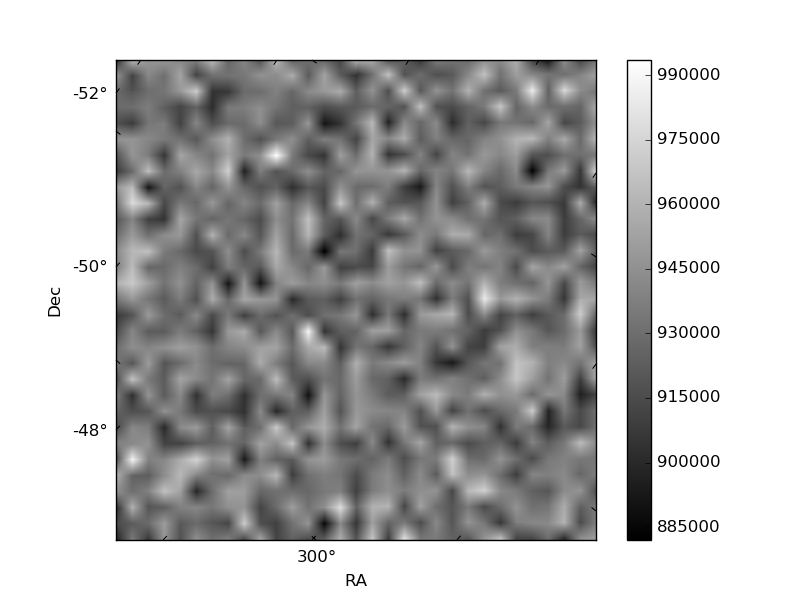
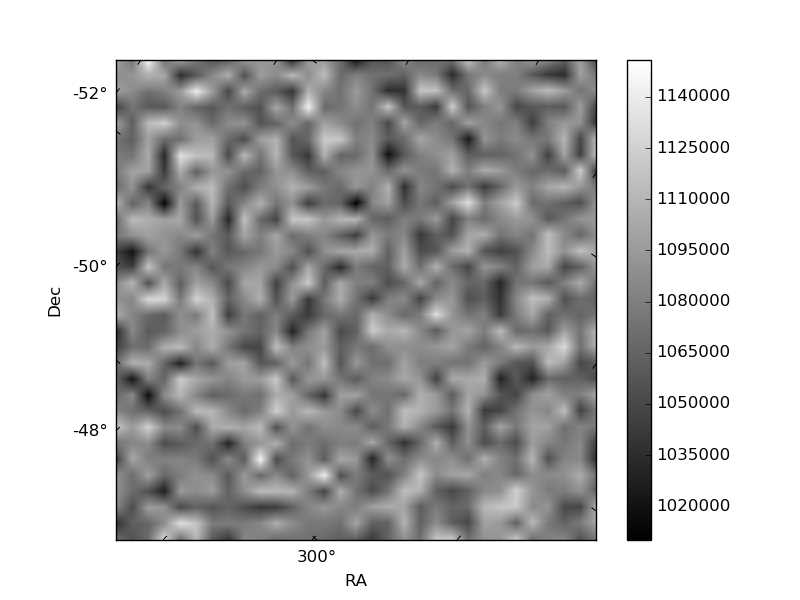
Histogram calculated using DETX and DETY for each event in the final _common_clean file
| Quadrant A | 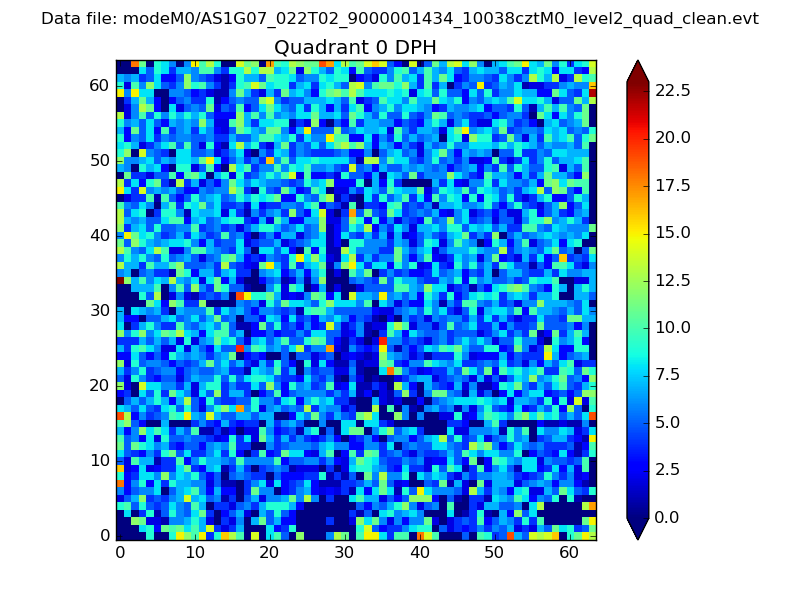 |
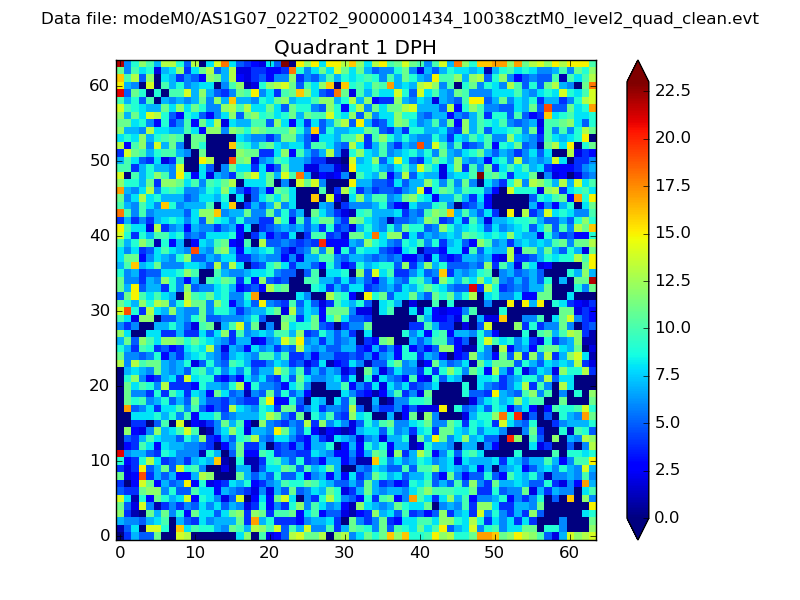 |
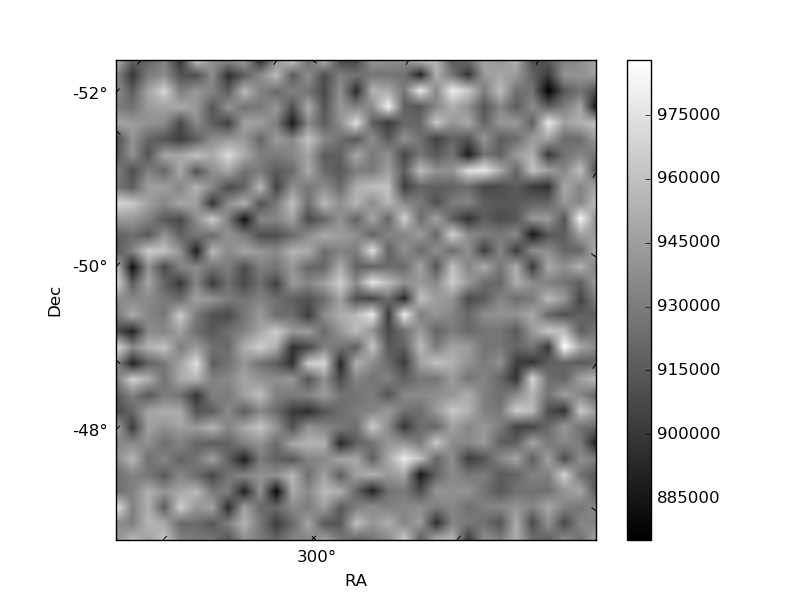
Quadrant B |
|---|---|---|---|
| Quadrant D | 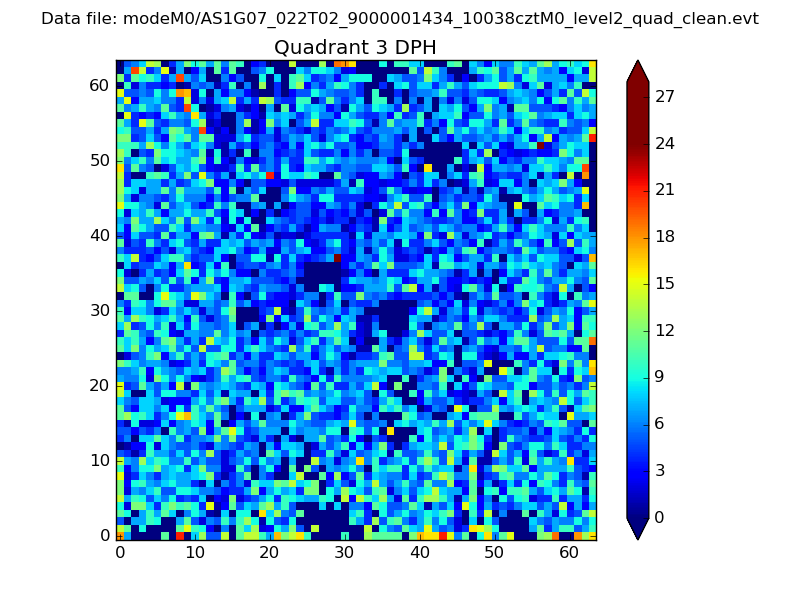 |
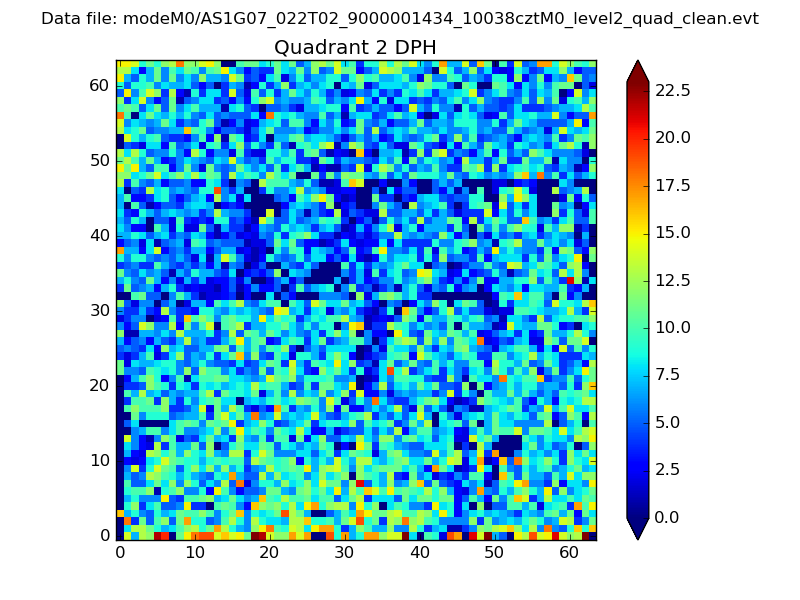 |
Quadrant C |
| Plot type | Count rate plots | Images |
|---|---|---|
| Comparison with Poisson distribution Blue bars denote a histogram of data divided into 1 sec bins. Red curve is a Poisson curve with rate = median count rate of data. |
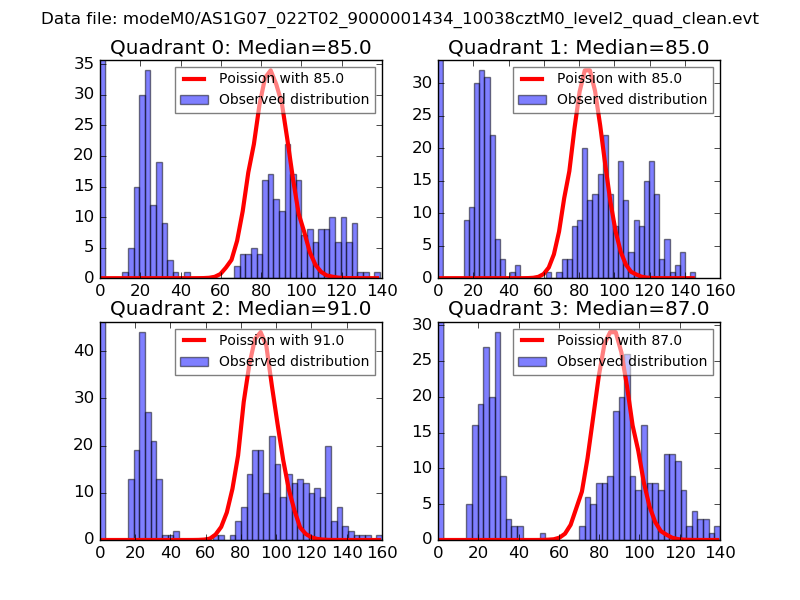 |
 |
| Quadrant-wise count rates Data is divided into 100 sec bins |
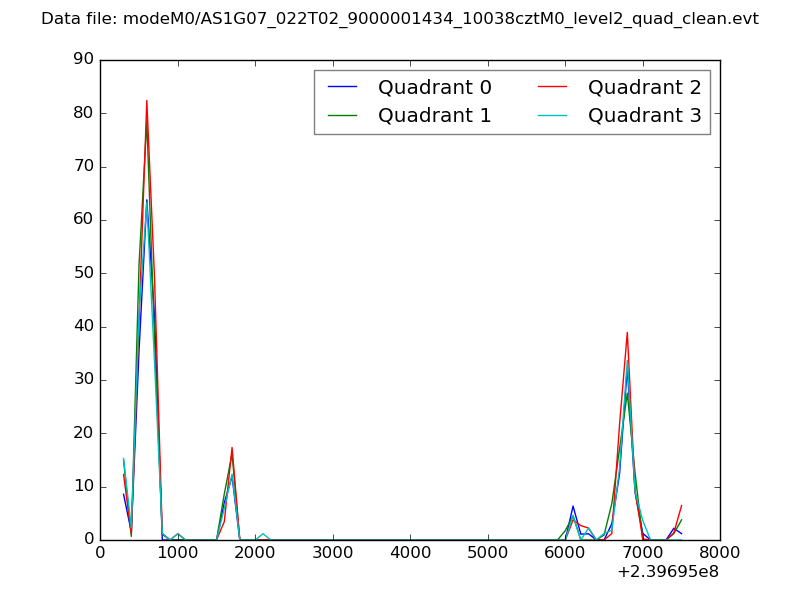 |
|
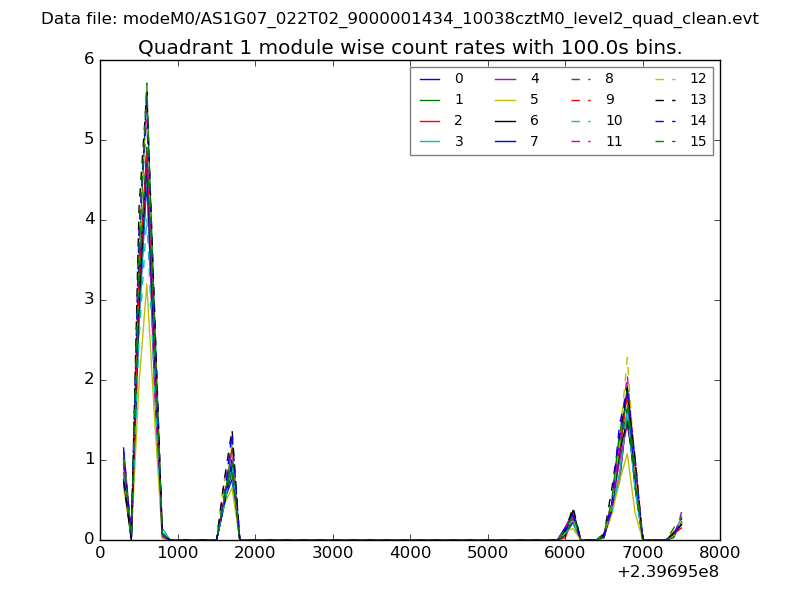
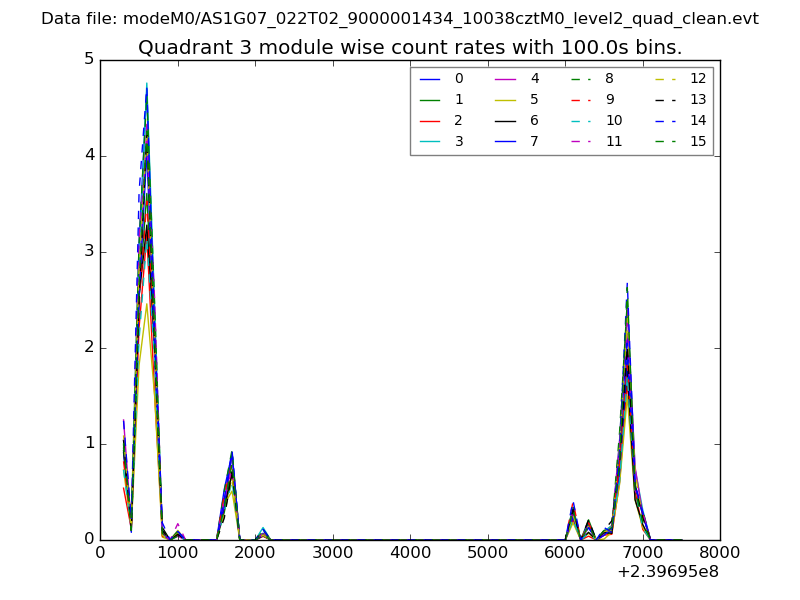
| Module-wise count rates for Quadrant A Data is divided into 100 sec bins |
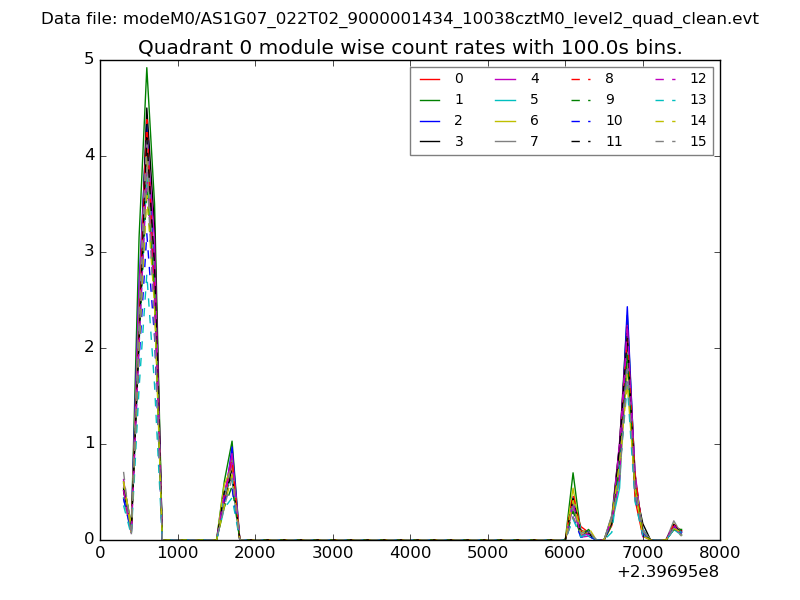 |
 |
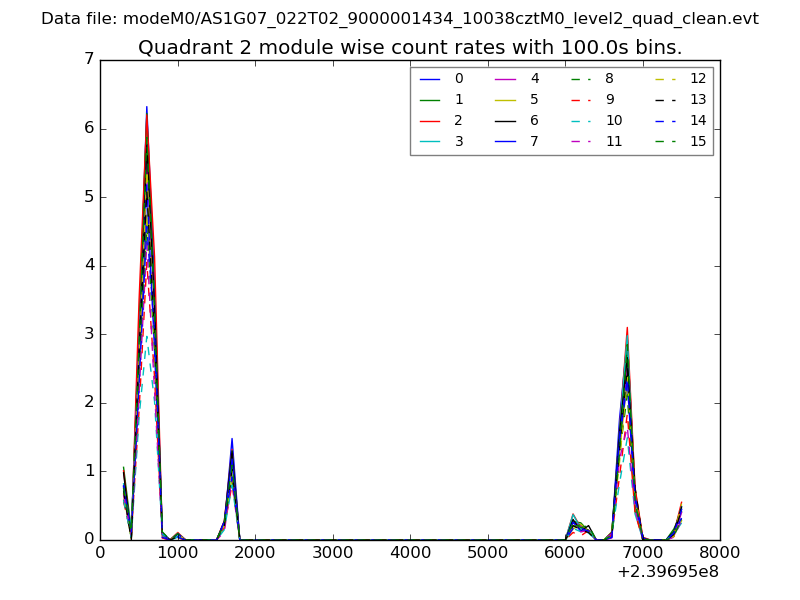
| Module-wise count rates for Quadrant B Data is divided into 100 sec bins |
 |
 |
| Module-wise count rates for Quadrant C Data is divided into 100 sec bins |
 |
 |
| Module-wise count rates for Quadrant D Data is divided into 100 sec bins |
 |
 |
| Parameter | Plot |
|---|---|
| CZT HV Monitor | 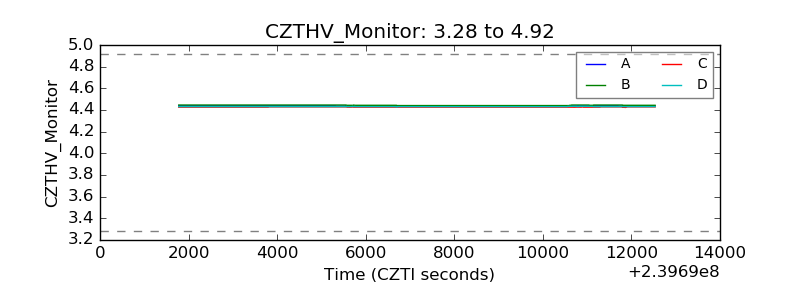 |
| D_VDD | 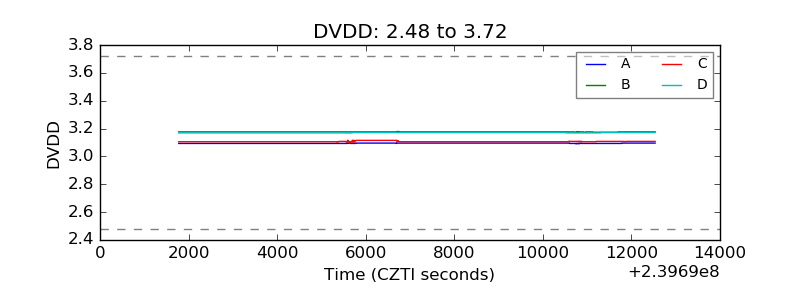 |
| Temperature 1 | 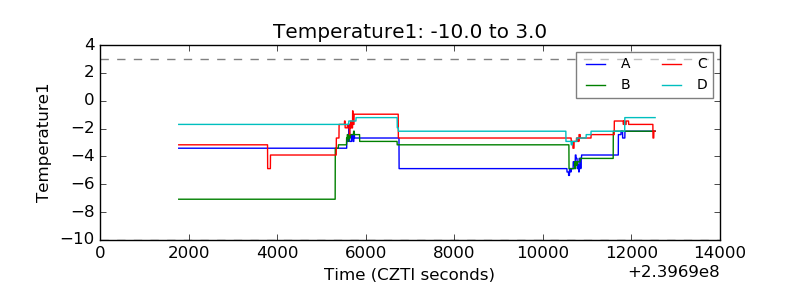 |
| Veto HV Monitor | 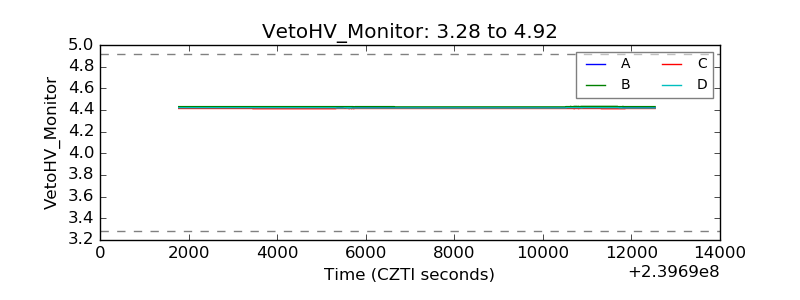 |
| Veto LLD | 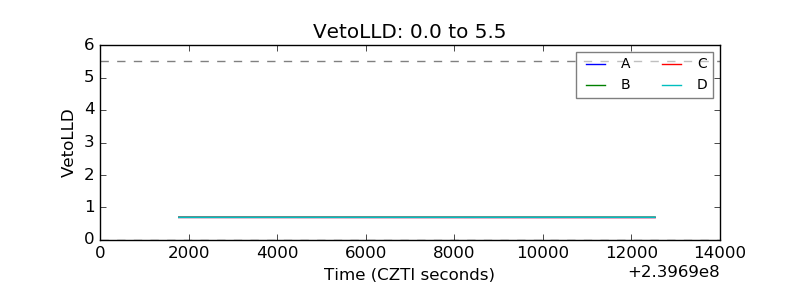 |
| Alpha Counter | 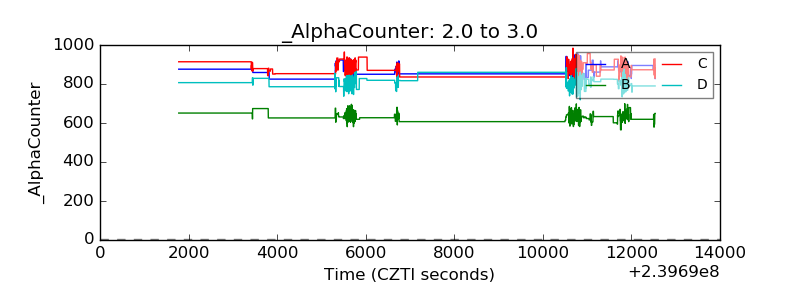 |
| _CPM_Rate | 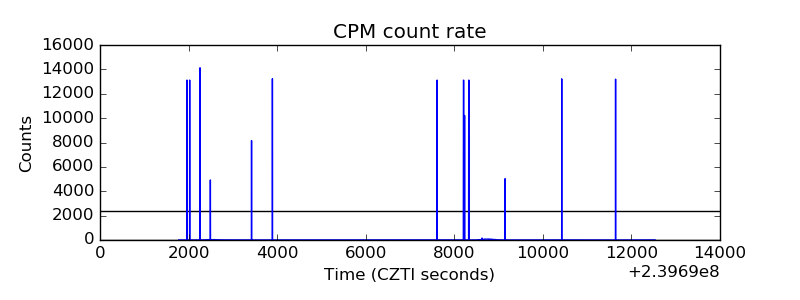 |
| CZT Counter | 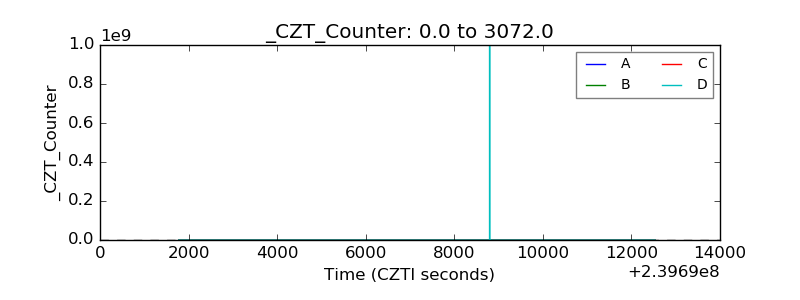 |
| +2.5 Volts monitor |  |
| +5 Volts monitor |  |
| _ROLL_ROT | 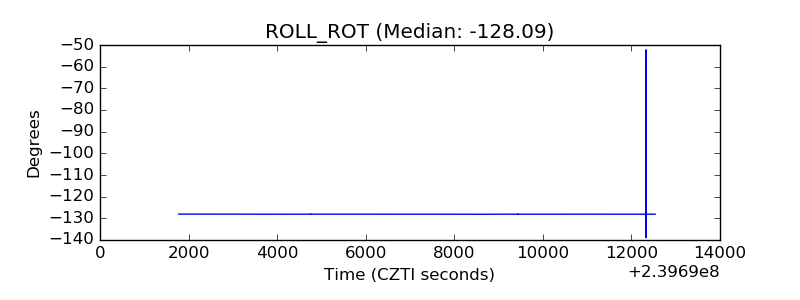 |
| _Roll_DEC | 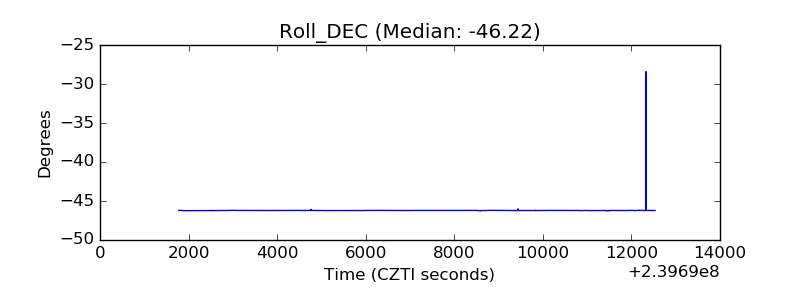 |
| _Roll_RA | 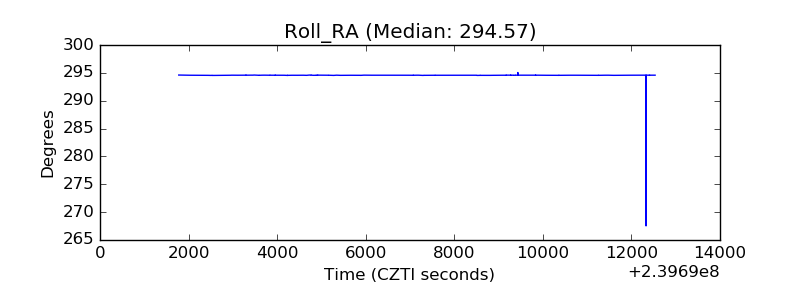 |
| Veto Counter | 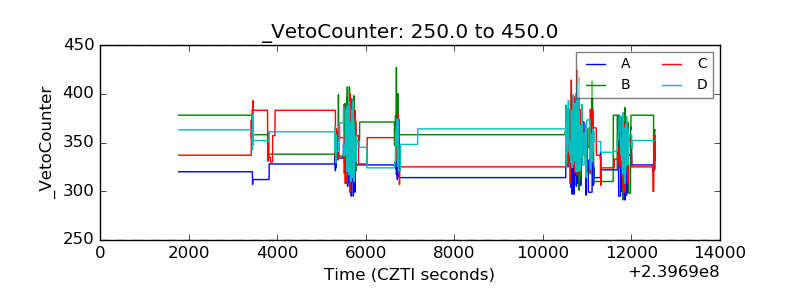 |