| Param | Original file | Final file |
|---|---|---|
| Filename | modeM0/AS1A03_052T01_9000001436cztM0_level2.fits | modeM0/AS1A03_052T01_9000001436cztM0_level2_quad_clean.evt |
| Size (bytes) | 475,657,920 | 467,210,880 |
| Size | 453.6 MB | 445.6 MB |
| Events in quadrant A | 2,975,608 | 3,336,426 |
| Events in quadrant B | 4,812,344 | 3,876,791 |
| Events in quadrant C | 2,982,494 | 3,183,490 |
| Events in quadrant D | 650,224 | 771,813 |
| Mode SS | |||
|---|---|---|---|
| Quadrant | BADHDUFLAG | Total packets | Discarded packets |
| A | 0 | 1085 | 0 |
| B | 0 | 1088 | 0 |
| C | 0 | 1063 | 0 |
| D | 0 | 1080 | 0 |
| Mode M9 | |||
|---|---|---|---|
| Quadrant | BADHDUFLAG | Total packets | Discarded packets |
| A | 1 | 140386216806440 | 140385301037102 |
| B | 1 | 140386216806440 | 140385301037102 |
| C | 1 | 140386216806440 | 140385301037102 |
| D | 1 | 140386216806440 | 140385301037102 |
| Mode M0 | |||
|---|---|---|---|
| Quadrant | BADHDUFLAG | Total packets | Discarded packets |
| A | 0 | 117108 | 0 |
| B | 0 | 118418 | 0 |
| C | 0 | 107853 | 0 |
| D | 0 | 31414 | 0 |
| Quadrant | Total seconds | Saturated seconds | Saturation percentage |
|---|---|---|---|
| A | 52407 | 911 | 1.738317% |
| B | 52332 | 1072 | 2.048460% |
| C | 52653 | 365 | 0.693218% |
| D | 13580 | 268 | 1.973490% |
Noise dominated data is calculated using 1-second bins in cleaned event files. If a bin has >2000 counts, and if more than 50% of those come from <1% of pixels, then it is considered to be noise-dominated and hence unusable.
| Quadrant | # 1 sec bins | Bins with >0 counts | Bins with >2000 counts | High rate bins dominated by noise | Noise dominated (total time) | Noise dominated (detector-on time) | Marked lightcurve |
|---|---|---|---|---|---|---|---|
| A | 75472 | 56003 | 0 | 0 | 0.00% | 0.00% | 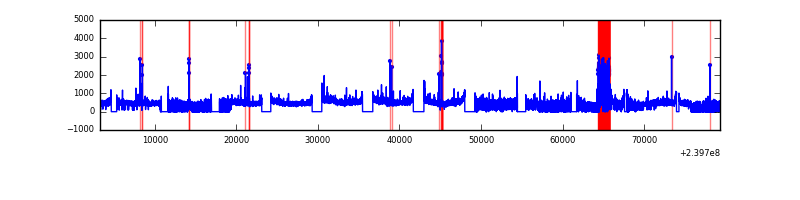 |
| B | 393211 | 55935 | 0 | 0 | 0.00% | 0.00% | 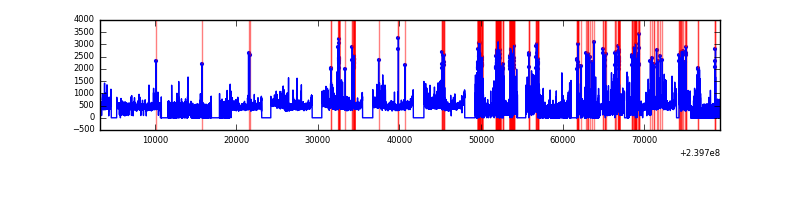 |
| C | 393184 | 56229 | 0 | 0 | 0.00% | 0.00% |  |
| D | 393183 | 14443 | 0 | 0 | 0.00% | 0.00% | 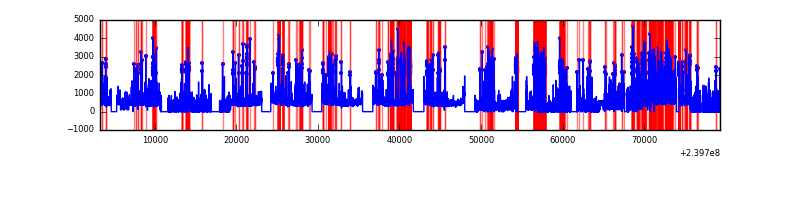 |
Top three noisy pixels from each quadrant. If the there are fewer than three noisy pixels in the level2.evt file, extra rows are filled as -1
| Pixel properties | Quadrant properties | ||||||
|---|---|---|---|---|---|---|---|
| Quadrant | DetID | PixID | Counts | Sigma | Mean | Median | Sigma |
| A | 0 | 29 | 2837 | 10.96 | 772 | 722 | 193.1 |
| A | 7 | 110 | 2444 | 8.92 | 772 | 722 | 193.1 |
| A | 0 | 30 | 2152 | 7.41 | 772 | 722 | 193.1 |
| B | 2 | 9 | 2923 | 7.07 | 1287 | 1251 | 236.6 |
| B | 12 | 226 | 2716 | 6.19 | 1287 | 1251 | 236.6 |
| B | 5 | 252 | 2456 | 5.09 | 1287 | 1251 | 236.6 |
| C | 1 | 80 | 2314 | 7.5 | 787 | 731 | 211.0 |
| C | 1 | 81 | 2223 | 7.07 | 787 | 731 | 211.0 |
| C | 2 | 191 | 2056 | 6.28 | 787 | 731 | 211.0 |
| D | 1 | 19 | 491 | 6.2 | 185 | 168 | 52.1 |
| D | 7 | 3 | 485 | 6.09 | 185 | 168 | 52.1 |
| D | 6 | 67 | 476 | 5.92 | 185 | 168 | 52.1 |
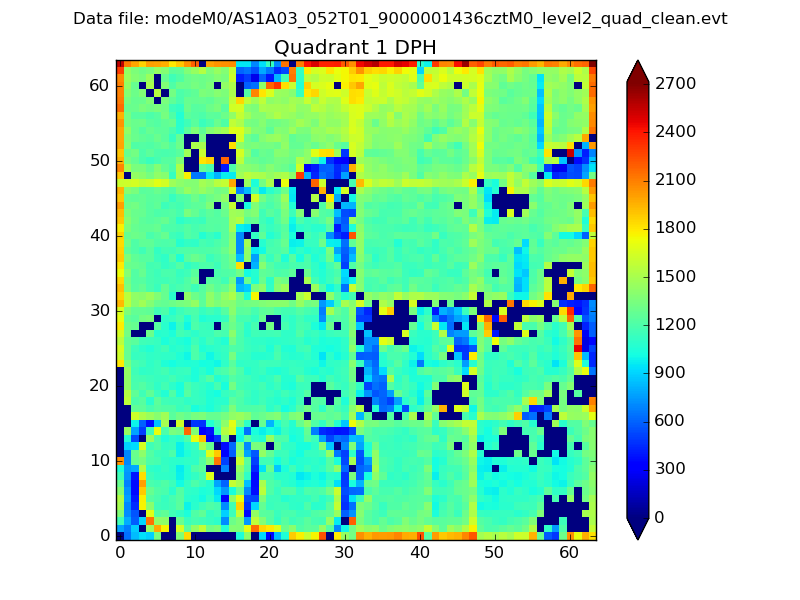
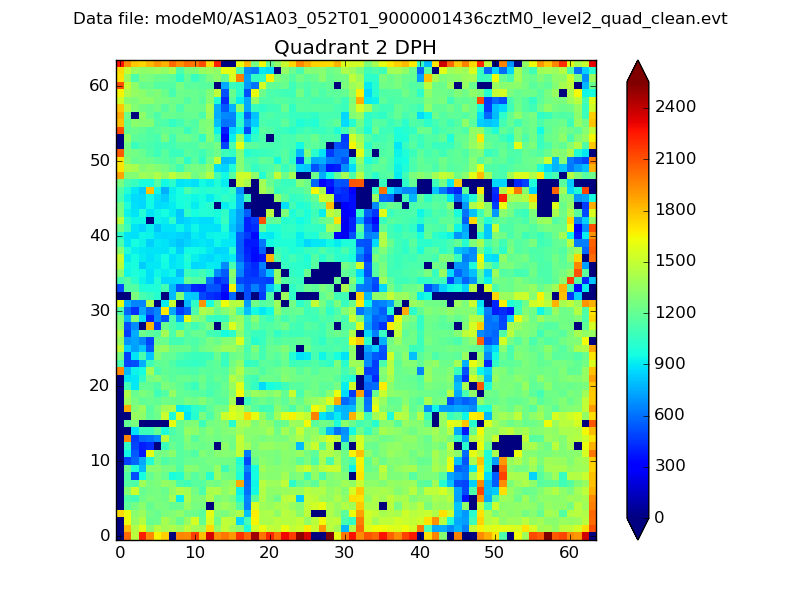
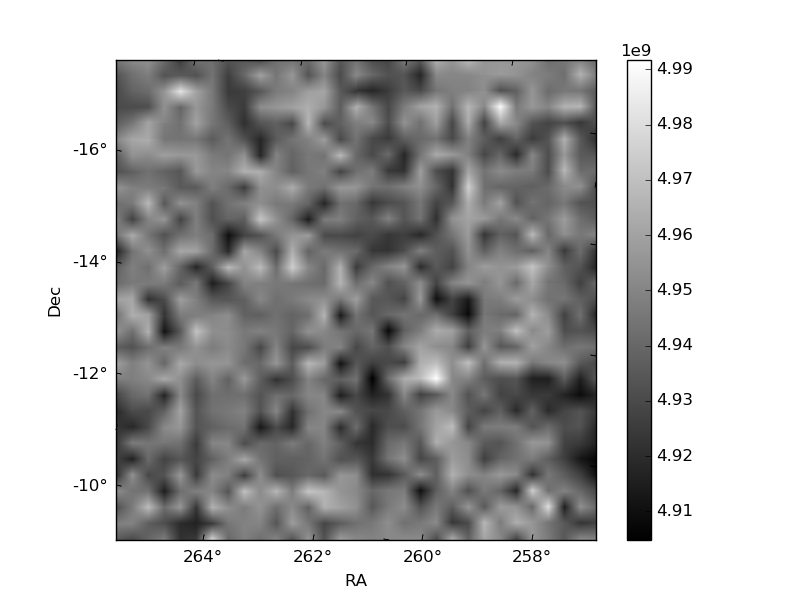
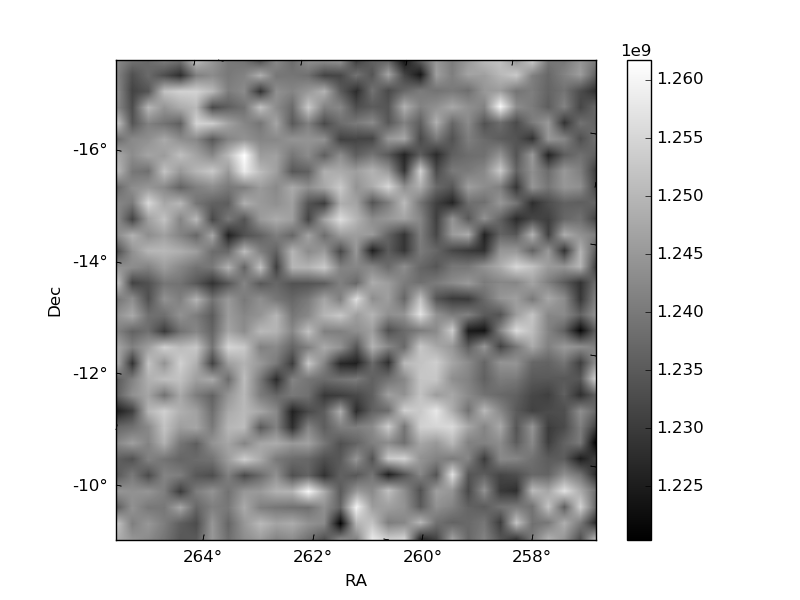
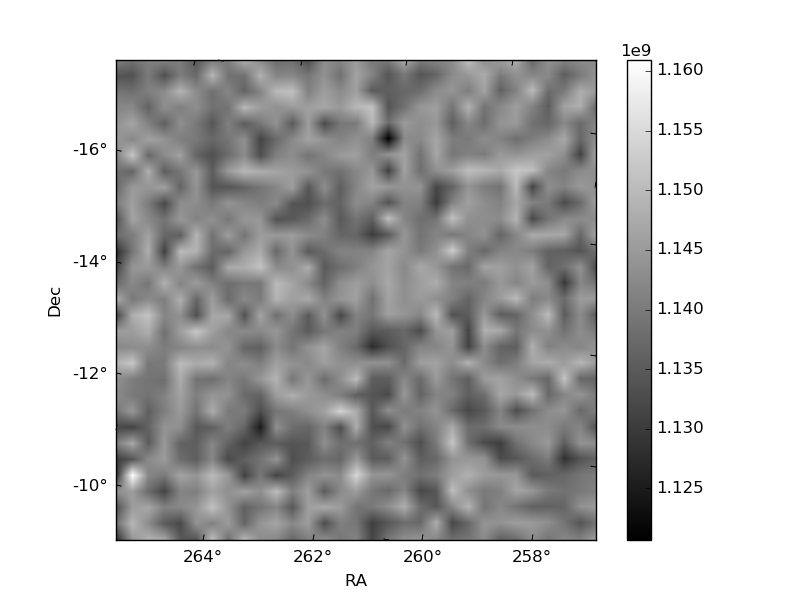
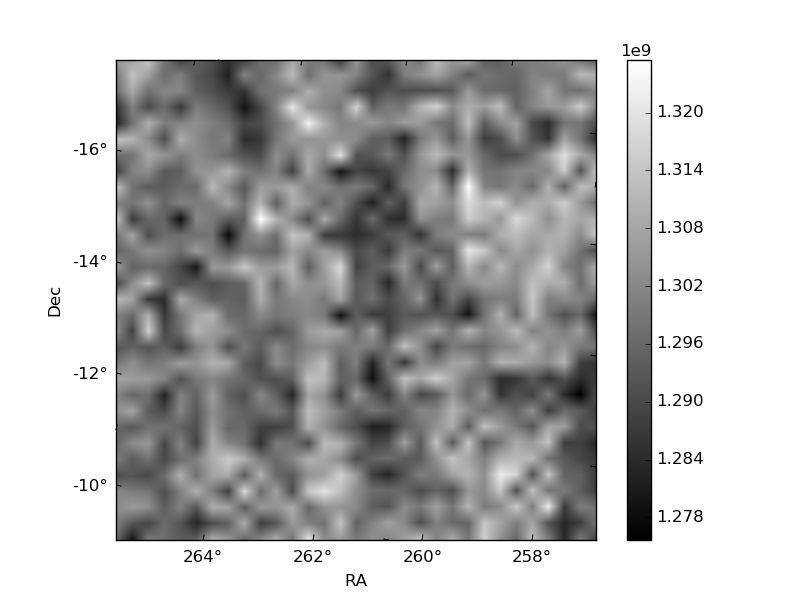
Histogram calculated using DETX and DETY for each event in the final _common_clean file
| Quadrant A | 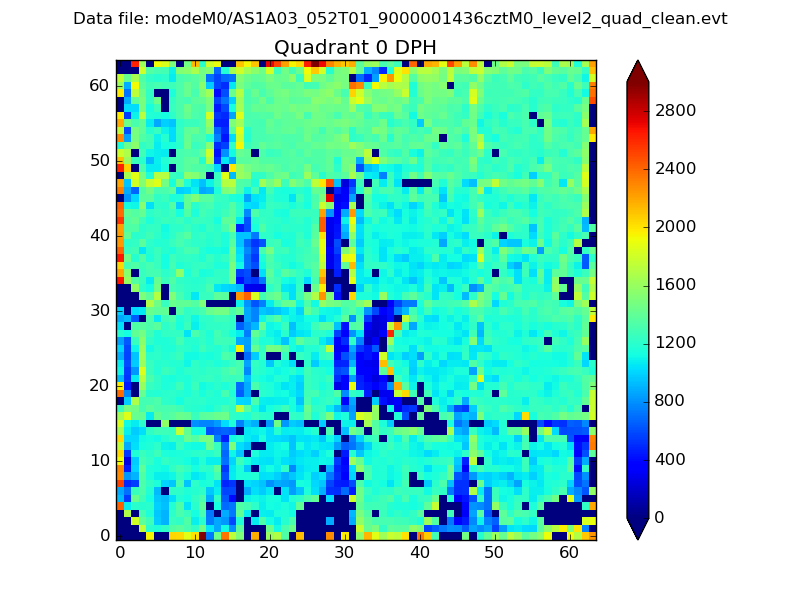 |
 |
Quadrant B |
|---|---|---|---|
| Quadrant D | 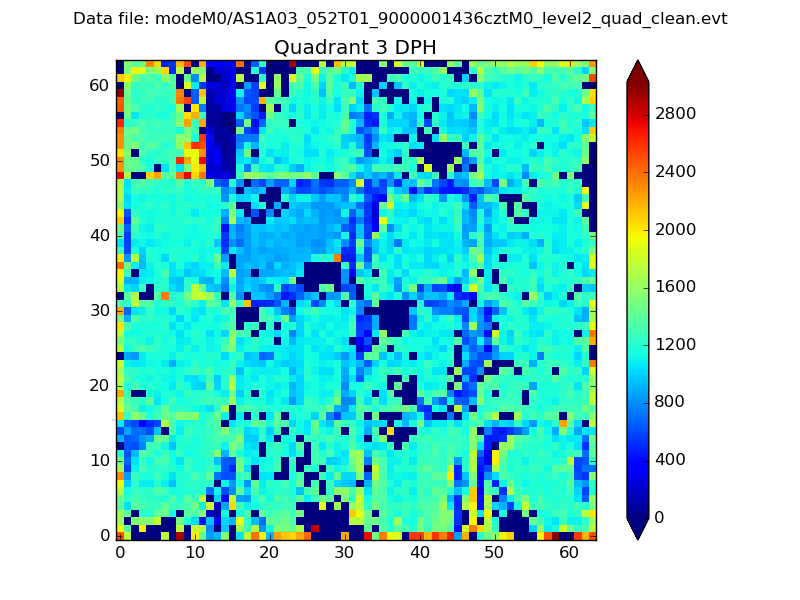 |
 |
Quadrant C |
| Plot type | Count rate plots | Images |
|---|---|---|
| Comparison with Poisson distribution Blue bars denote a histogram of data divided into 1 sec bins. Red curve is a Poisson curve with rate = median count rate of data. |
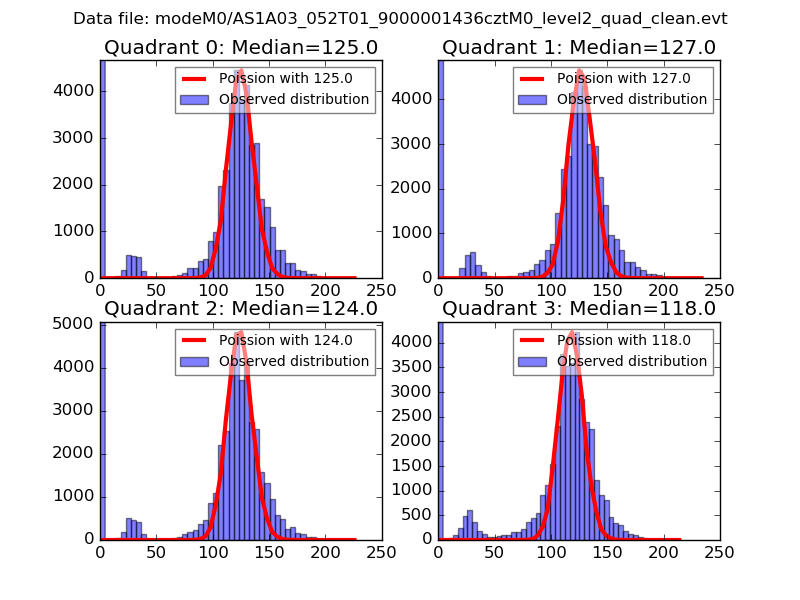 |
 |
| Quadrant-wise count rates Data is divided into 100 sec bins |
 |
|
| Module-wise count rates for Quadrant A Data is divided into 100 sec bins |
 |
 |
| Module-wise count rates for Quadrant B Data is divided into 100 sec bins |
 |
 |
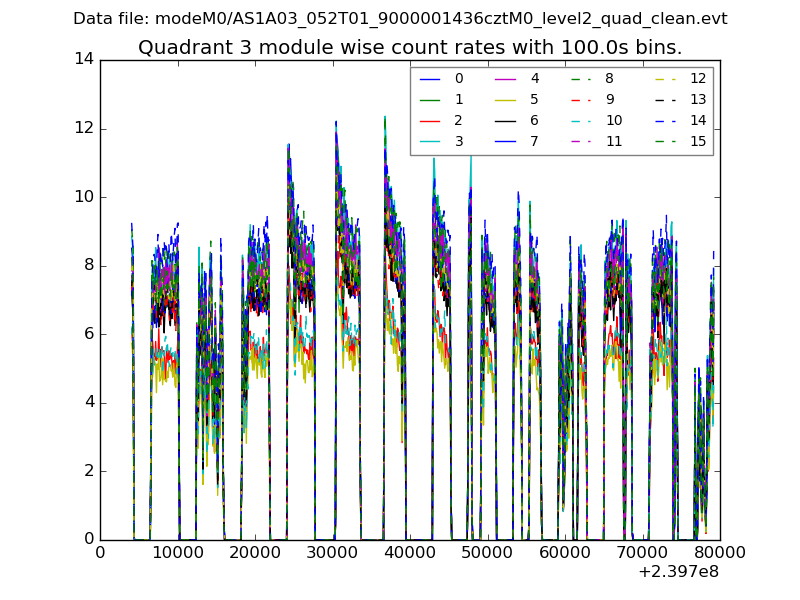
| Module-wise count rates for Quadrant C Data is divided into 100 sec bins |
 |
 |
| Module-wise count rates for Quadrant D Data is divided into 100 sec bins |
 |
 |
| Parameter | Plot |
|---|---|
| CZT HV Monitor | 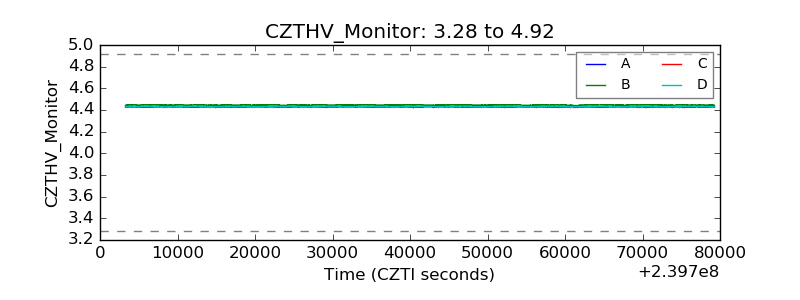 |
| D_VDD | 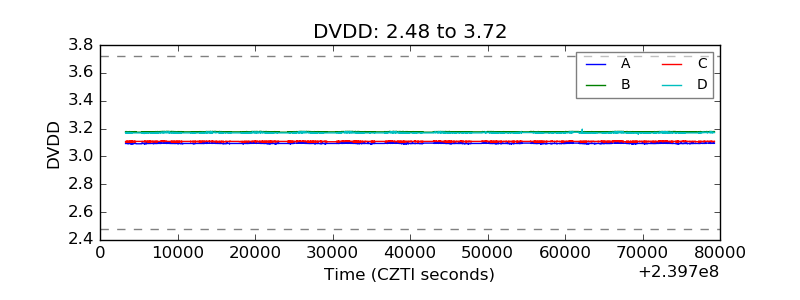 |
| Temperature 1 | 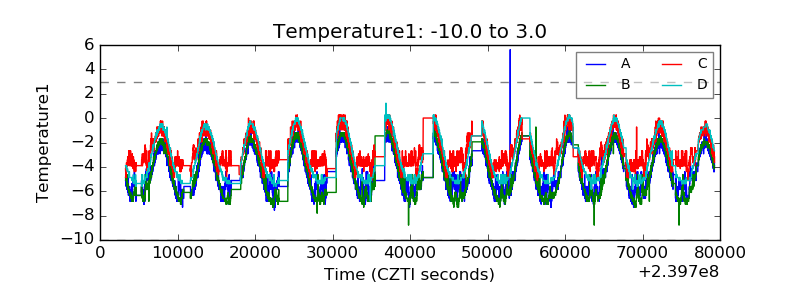 |
| Veto HV Monitor |  |
| Veto LLD | 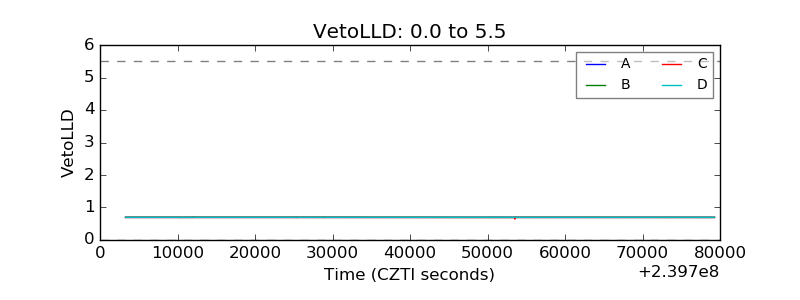 |
| Alpha Counter | 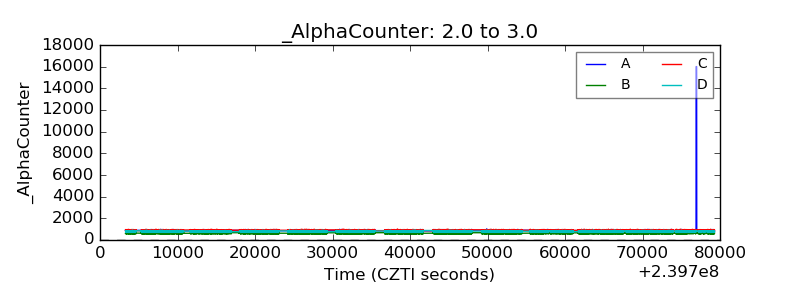 |
| _CPM_Rate | 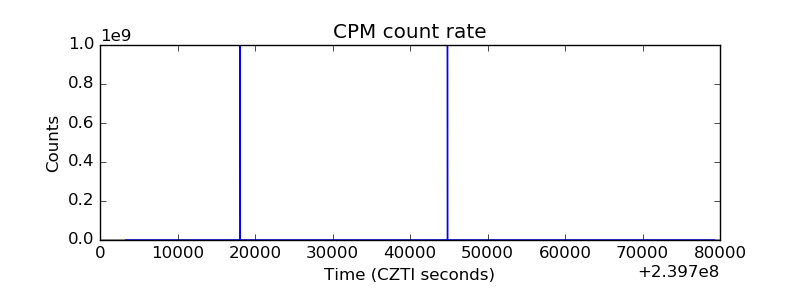 |
| CZT Counter | 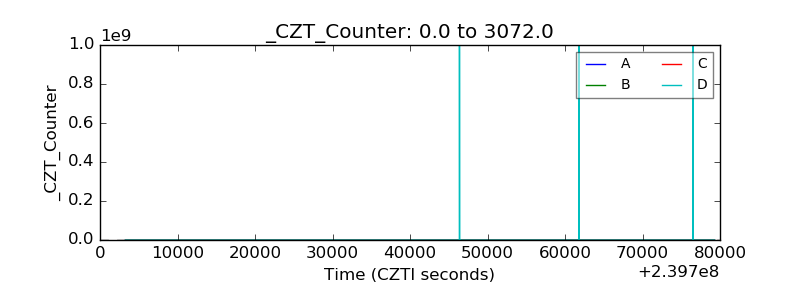 |
| +2.5 Volts monitor | 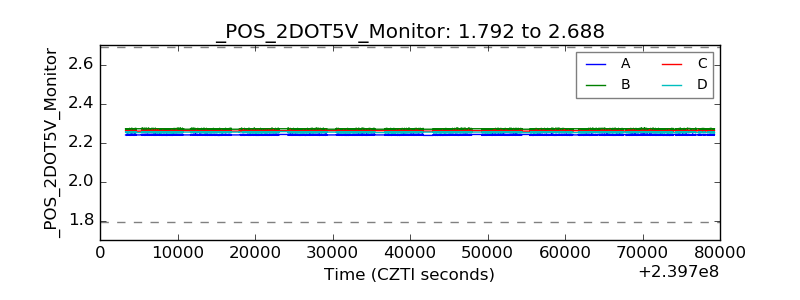 |
| +5 Volts monitor | 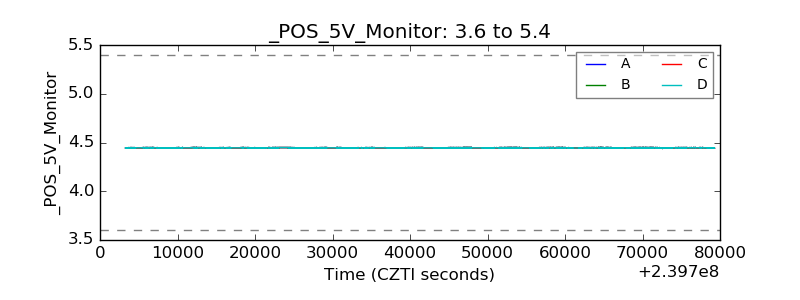 |
| _ROLL_ROT | 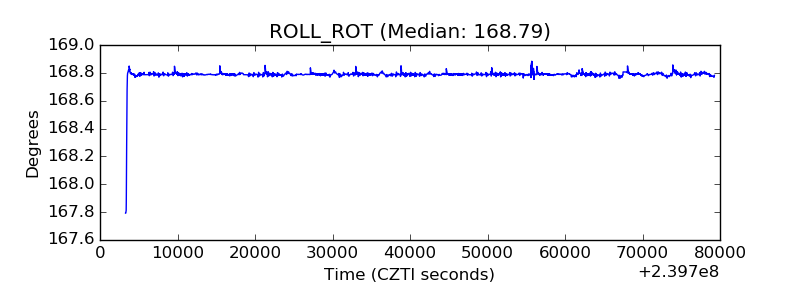 |
| _Roll_DEC | 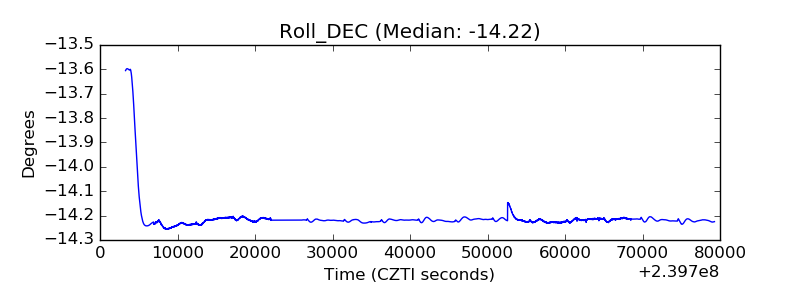 |
| _Roll_RA | 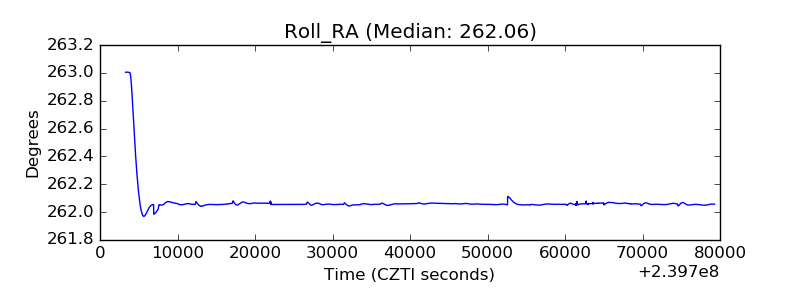 |
| Veto Counter |  |