| Param | Original file | Final file |
|---|---|---|
| Filename | modeM0/AS1A03_052T01_9000001436_10038cztM0_level2.evt | modeM0/AS1A03_052T01_9000001436_10038cztM0_level2_quad_clean.evt |
| Size (bytes) | 9,740,160 | 2,508,480 |
| Size | 9.3 MB | 2.4 MB |
| Events in quadrant A | 74,094 | 13,885 |
| Events in quadrant B | 67,439 | 14,980 |
| Events in quadrant C | 67,955 | 14,577 |
| Events in quadrant D | 71,534 | 12,865 |
| Mode SS | |||
|---|---|---|---|
| Quadrant | BADHDUFLAG | Total packets | Discarded packets |
| A | 0 | 50 | 44 |
| B | 0 | 52 | 50 |
| C | 0 | 49 | 47 |
| D | 0 | 49 | 47 |
| Mode M9 | |||
|---|---|---|---|
| Quadrant | BADHDUFLAG | Total packets | Discarded packets |
| A | 0 | 5 | 5 |
| B | 0 | 6 | 6 |
| C | 0 | 4 | 4 |
| D | 0 | 3 | 3 |
| Mode M0 | |||
|---|---|---|---|
| Quadrant | BADHDUFLAG | Total packets | Discarded packets |
| A | 0 | 5277 | 4964 |
| B | 0 | 5265 | 4973 |
| C | 0 | 5222 | 4922 |
| D | 0 | 5560 | 5261 |
| Quadrant | Total seconds | Saturated seconds | Saturation percentage |
|---|---|---|---|
| A | 156 | 0 | 0.000000% |
| B | 146 | 0 | 0.000000% |
| C | 150 | 0 | 0.000000% |
| D | 148 | 0 | 0.000000% |
Noise dominated data is calculated using 1-second bins in cleaned event files. If a bin has >2000 counts, and if more than 50% of those come from <1% of pixels, then it is considered to be noise-dominated and hence unusable.
| Quadrant | # 1 sec bins | Bins with >0 counts | Bins with >2000 counts | High rate bins dominated by noise | Noise dominated (total time) | Noise dominated (detector-on time) | Marked lightcurve |
|---|---|---|---|---|---|---|---|
| A | 3166 | 219 | 0 | 0 | 0.00% | 0.00% | 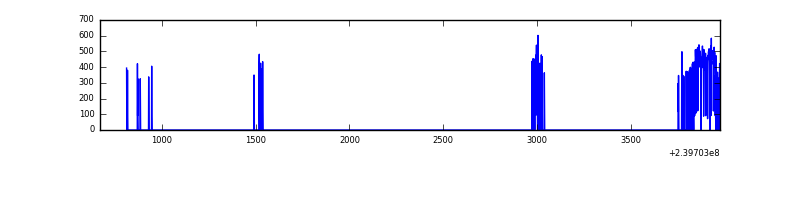 |
| B | 3265 | 201 | 0 | 0 | 0.00% | 0.00% | 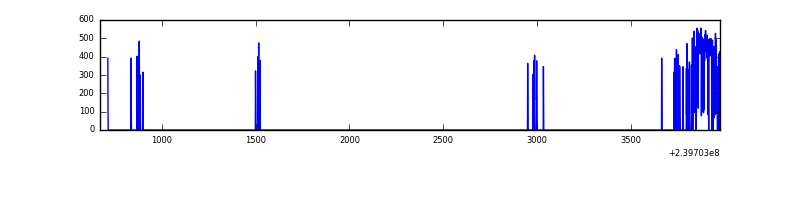 |
| C | 3305 | 203 | 0 | 0 | 0.00% | 0.00% | 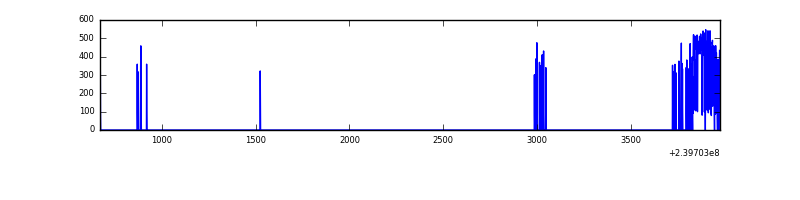 |
| D | 3306 | 204 | 0 | 0 | 0.00% | 0.00% | 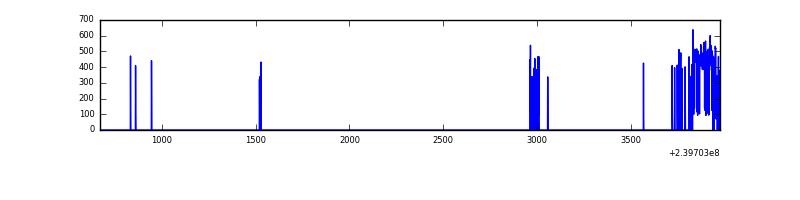 |
Top three noisy pixels from each quadrant. If the there are fewer than three noisy pixels in the level2.evt file, extra rows are filled as -1
| Pixel properties | Quadrant properties | ||||||
|---|---|---|---|---|---|---|---|
| Quadrant | DetID | PixID | Counts | Sigma | Mean | Median | Sigma |
| A | 8 | 15 | 2266 | 388.19 | 18 | 18 | 5.8 |
| A | 0 | 8 | 284 | 45.93 | 18 | 18 | 5.8 |
| A | 0 | 226 | 166 | 25.56 | 18 | 18 | 5.8 |
| B | 12 | 111 | 424 | 77.15 | 17 | 16 | 5.3 |
| B | 4 | 239 | 371 | 67.13 | 17 | 16 | 5.3 |
| B | 11 | 111 | 298 | 53.33 | 17 | 16 | 5.3 |
| C | 14 | 67 | 1545 | 263.07 | 16 | 16 | 5.8 |
| C | 13 | 61 | 122 | 18.24 | 16 | 16 | 5.8 |
| C | -1 | -1 | -1 | -1.0 | 16 | 16 | 5.8 |
| D | 8 | 195 | 5263 | 899.16 | 16 | 16 | 5.8 |
| D | 1 | 52 | 1352 | 228.94 | 16 | 16 | 5.8 |
| D | 2 | 152 | 839 | 141.03 | 16 | 16 | 5.8 |
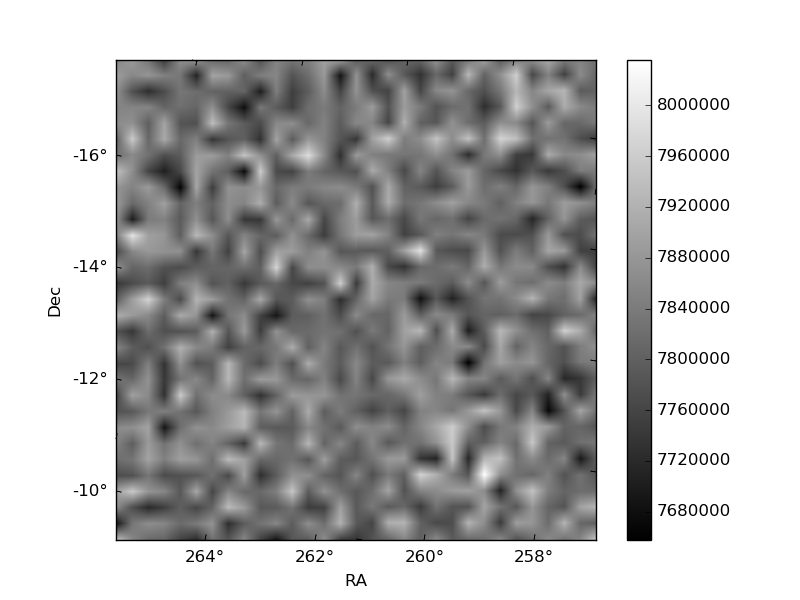
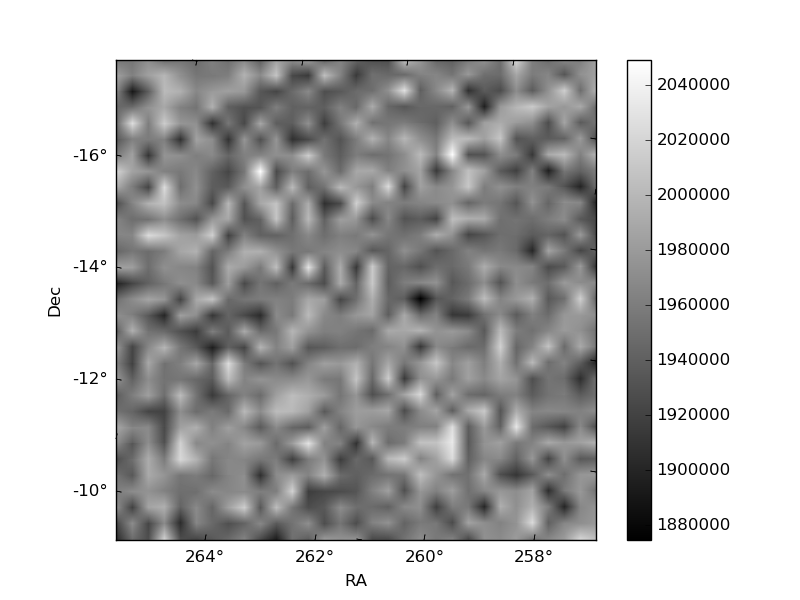
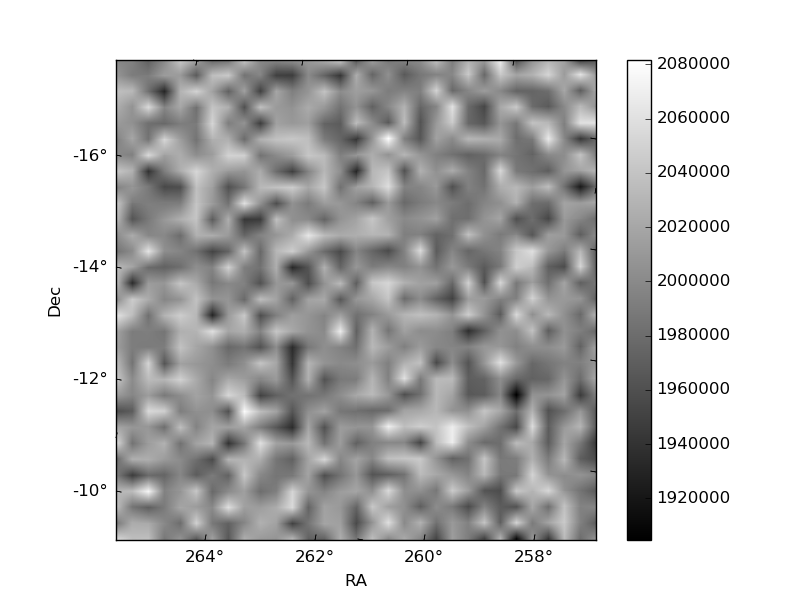
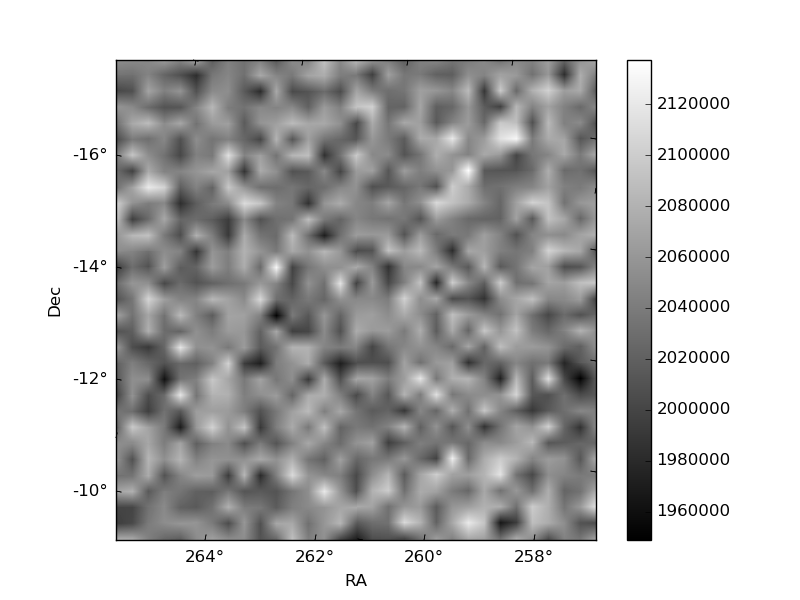
Histogram calculated using DETX and DETY for each event in the final _common_clean file
| Quadrant A | 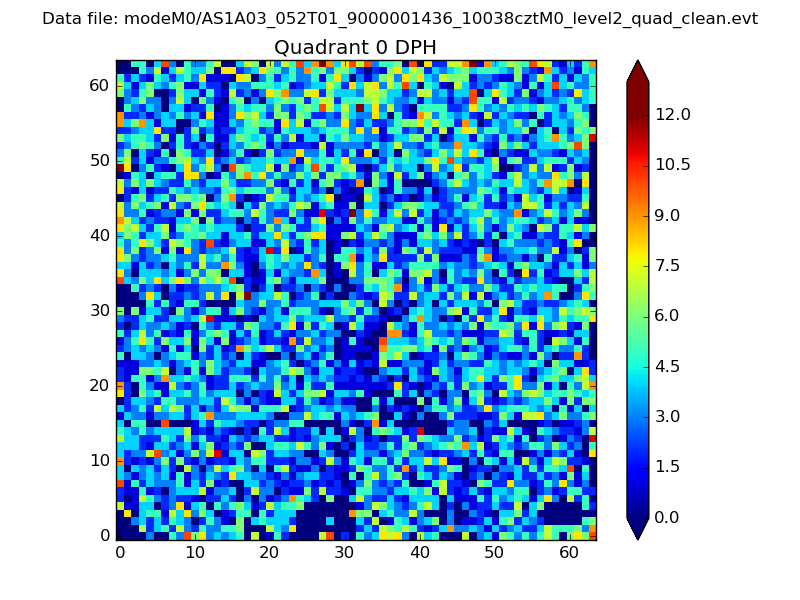 |
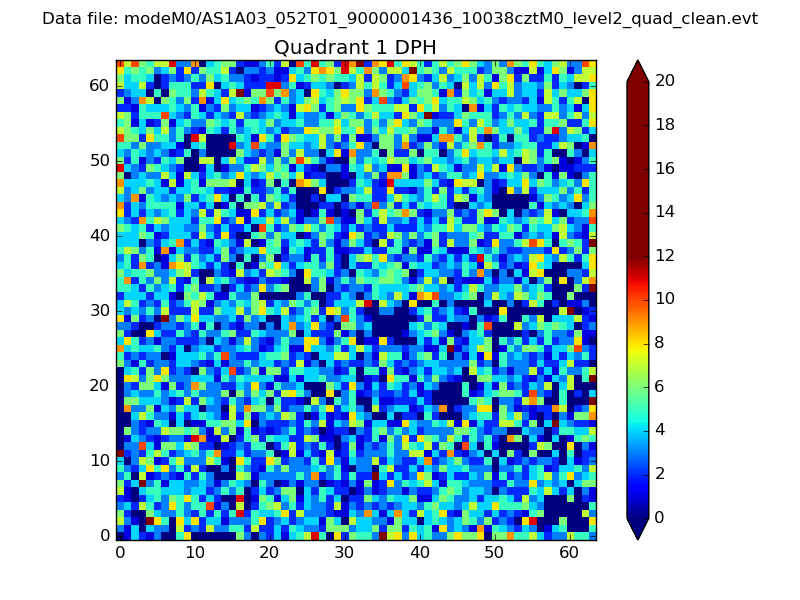 |
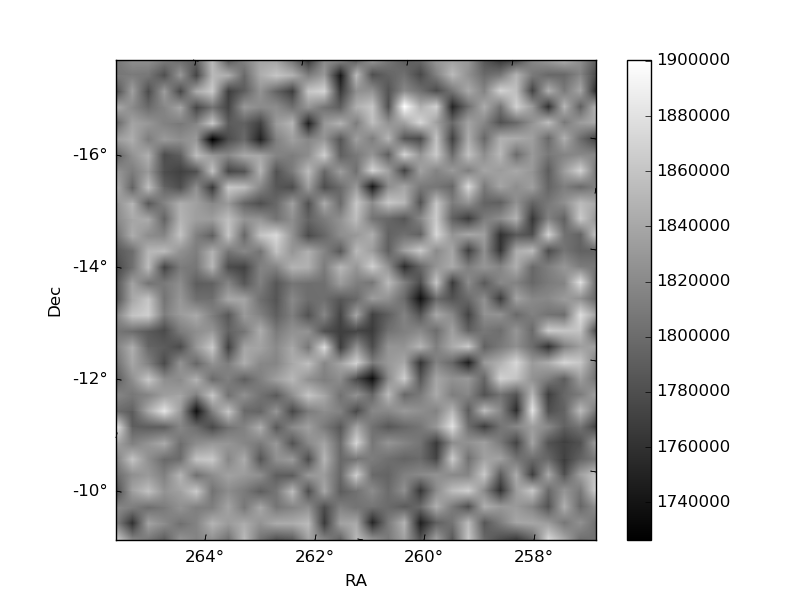
Quadrant B |
|---|---|---|---|
| Quadrant D | 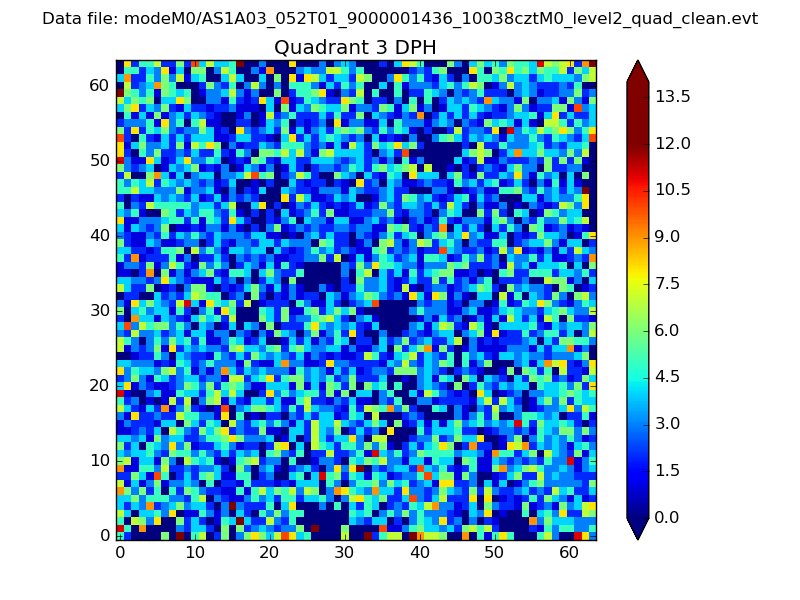 |
 |
Quadrant C |
| Plot type | Count rate plots | Images |
|---|---|---|
| Comparison with Poisson distribution Blue bars denote a histogram of data divided into 1 sec bins. Red curve is a Poisson curve with rate = median count rate of data. |
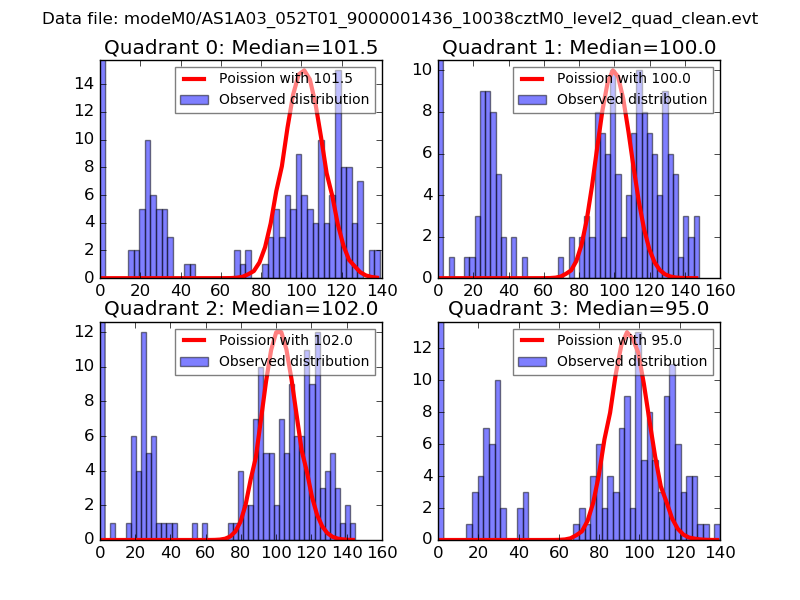 |
 |
| Quadrant-wise count rates Data is divided into 100 sec bins |
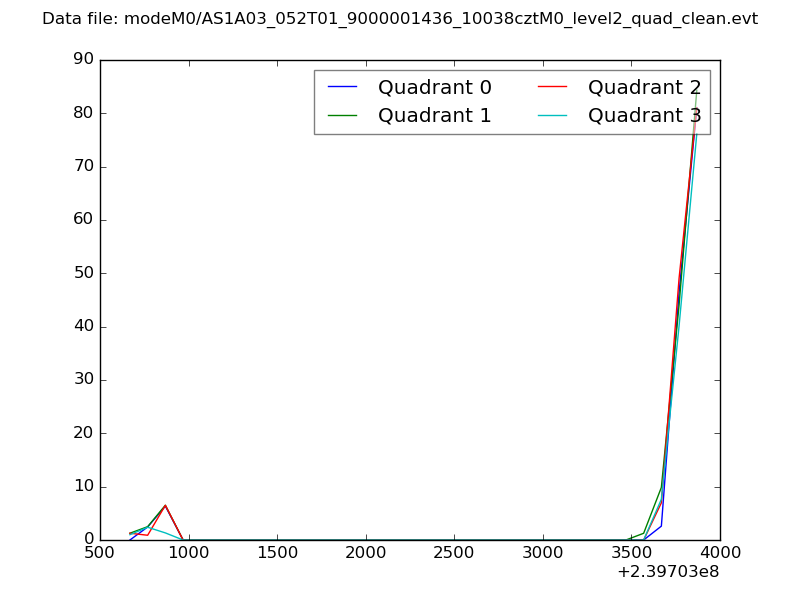 |
|
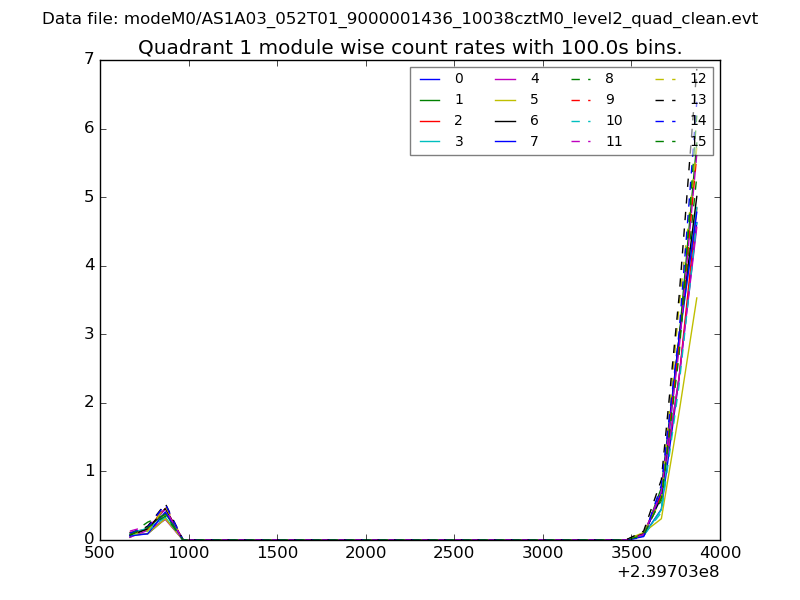
| Module-wise count rates for Quadrant A Data is divided into 100 sec bins |
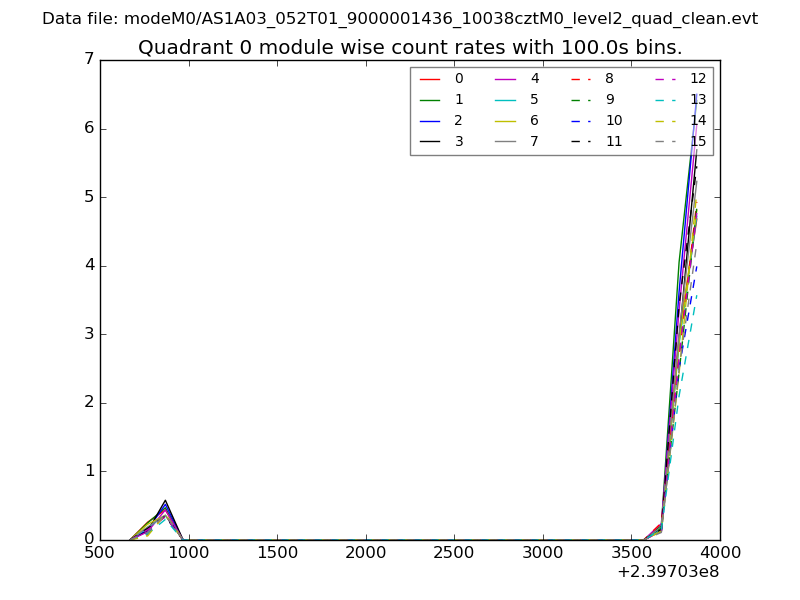 |
 |
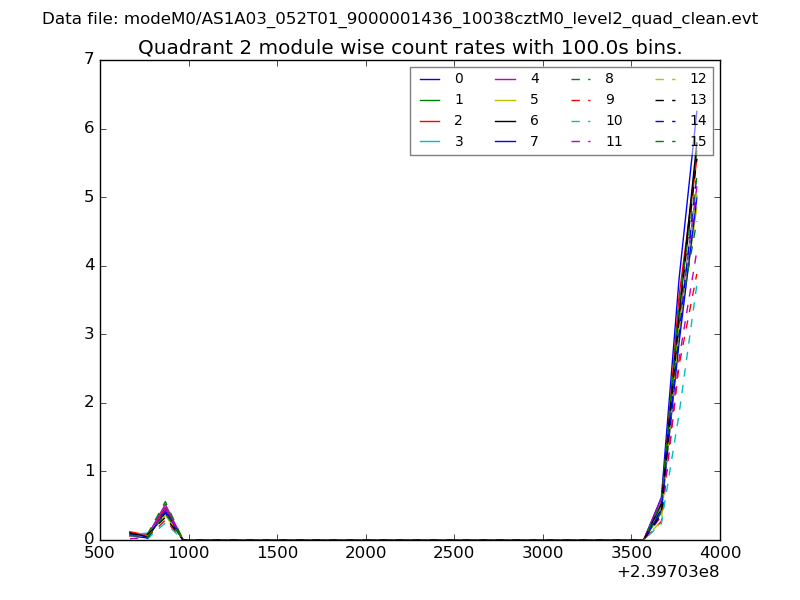
| Module-wise count rates for Quadrant B Data is divided into 100 sec bins |
 |
 |
| Module-wise count rates for Quadrant C Data is divided into 100 sec bins |
 |
 |
| Module-wise count rates for Quadrant D Data is divided into 100 sec bins |
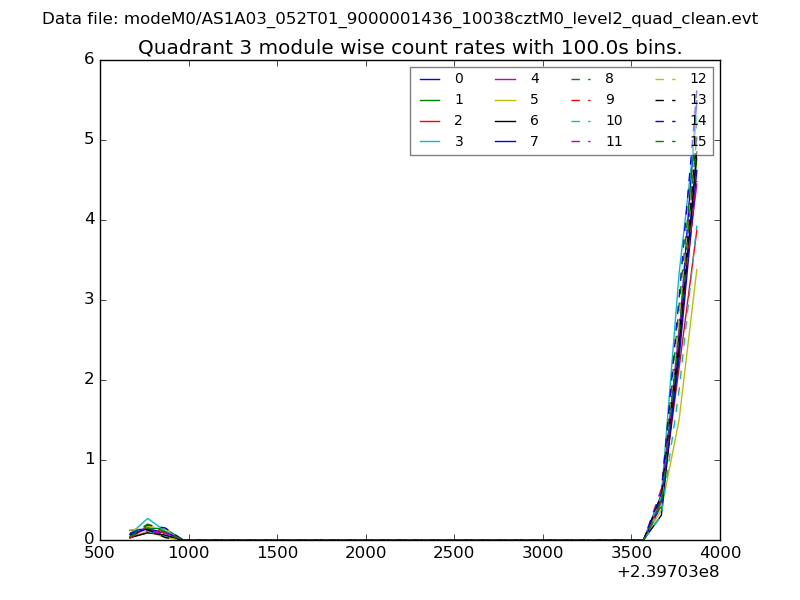 |
 |
| Parameter | Plot |
|---|---|
| CZT HV Monitor | 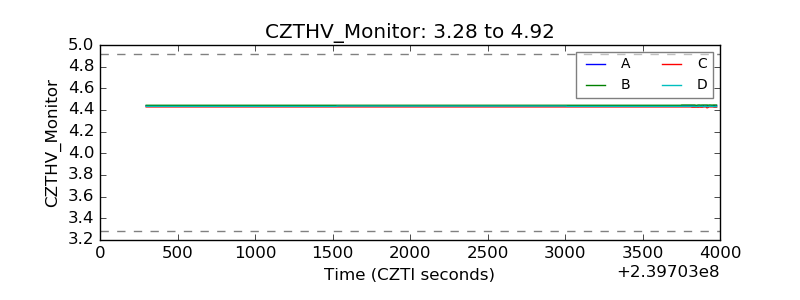 |
| D_VDD | 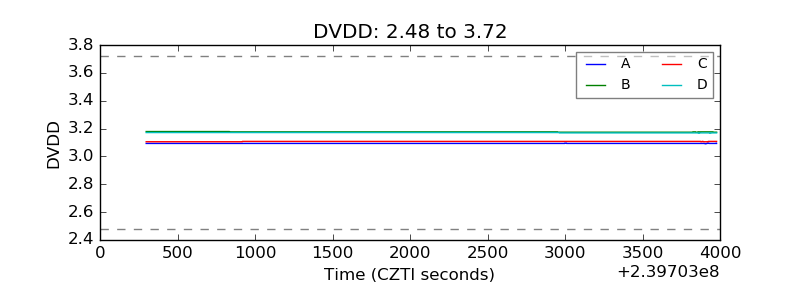 |
| Temperature 1 | 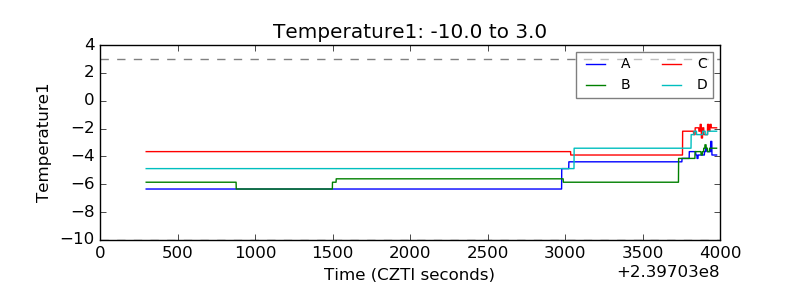 |
| Veto HV Monitor | 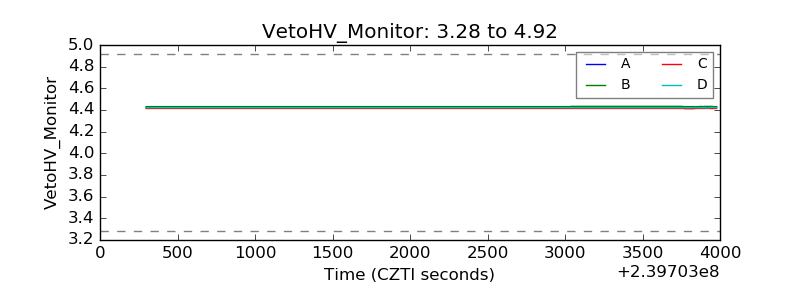 |
| Veto LLD | 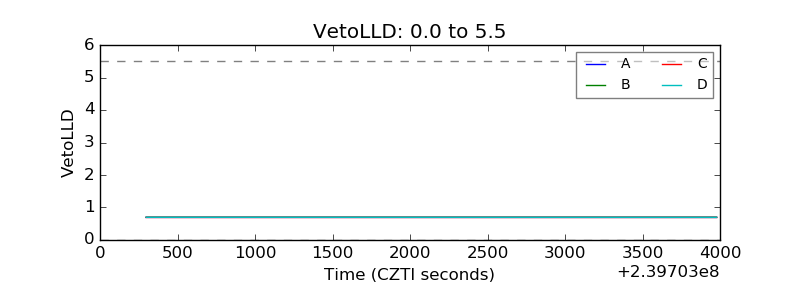 |
| Alpha Counter | 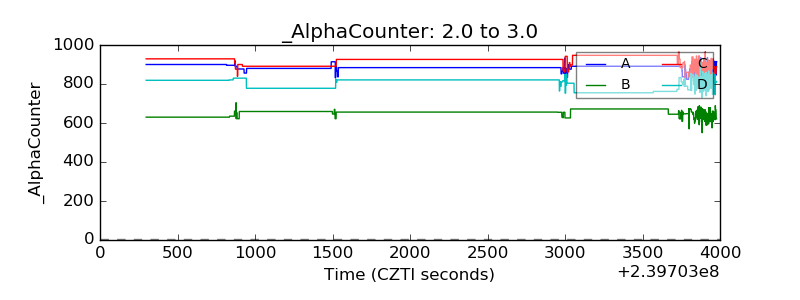 |
| _CPM_Rate | 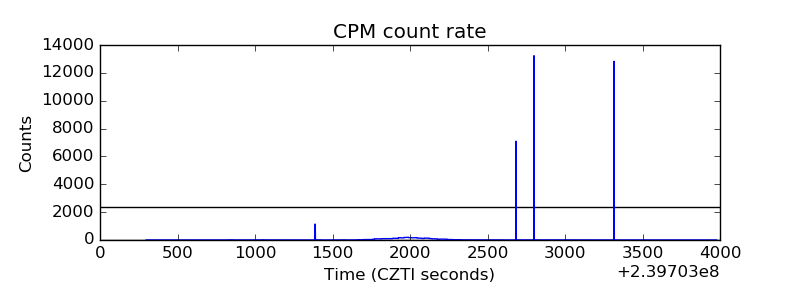 |
| CZT Counter | 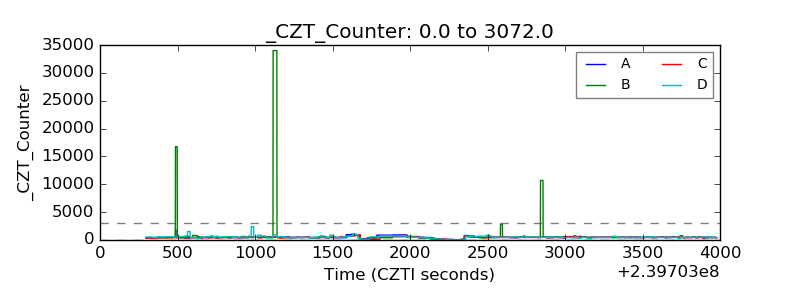 |
| +2.5 Volts monitor | 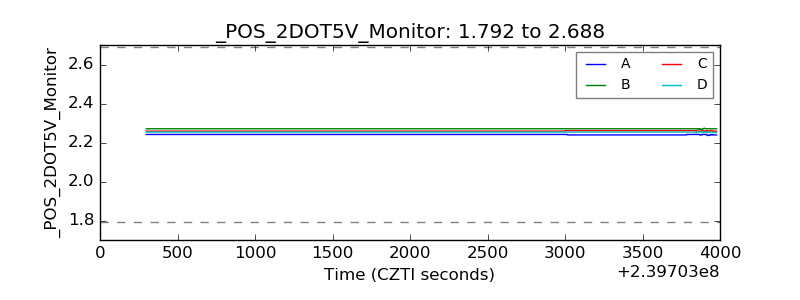 |
| +5 Volts monitor |  |
| _ROLL_ROT | 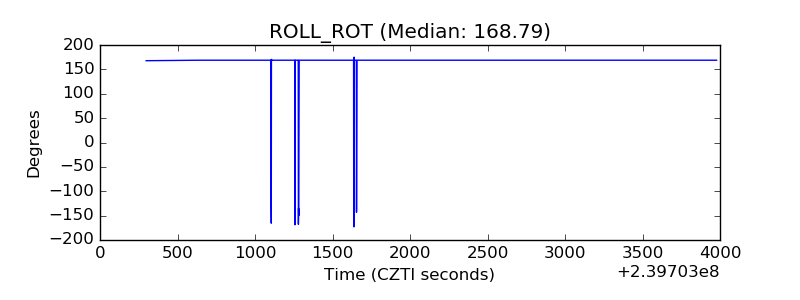 |
| _Roll_DEC | 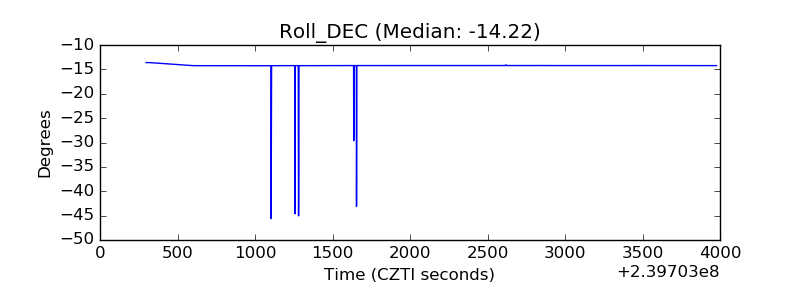 |
| _Roll_RA | 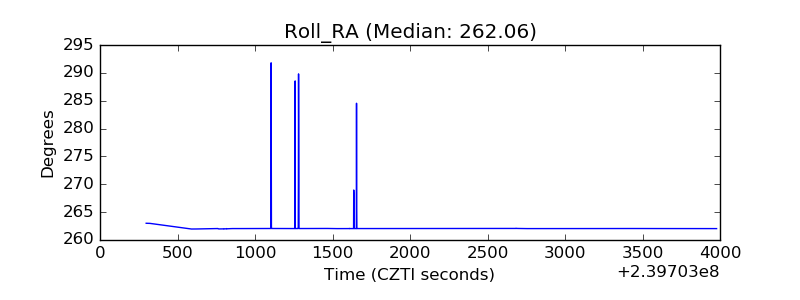 |
| Veto Counter | 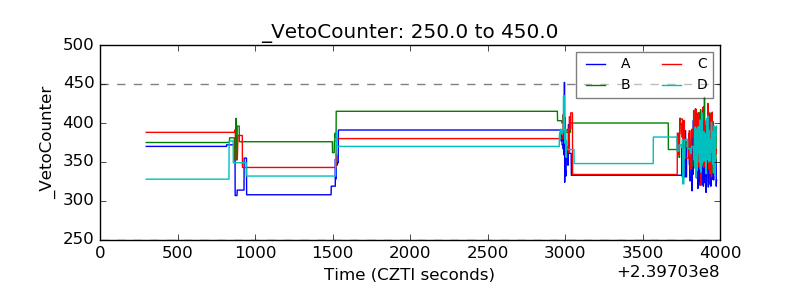 |