| Param | Original file | Final file |
|---|---|---|
| Filename | modeM0/AS1A03_052T01_9000001436_10039cztM0_level2.evt | modeM0/AS1A03_052T01_9000001436_10039cztM0_level2_quad_clean.evt |
| Size (bytes) | 62,913,600 | 12,945,600 |
| Size | 60.0 MB | 12.3 MB |
| Events in quadrant A | 645,801 | 105,458 |
| Events in quadrant B | 597,547 | 106,162 |
| Events in quadrant C | 565,569 | 99,969 |
| Events in quadrant D | 25,059 | 2,988 |
| Mode SS | |||
|---|---|---|---|
| Quadrant | BADHDUFLAG | Total packets | Discarded packets |
| A | 0 | 133 | 107 |
| B | 0 | 127 | 95 |
| C | 0 | 131 | 107 |
| D | 0 | 126 | 102 |
| Mode M9 | |||
|---|---|---|---|
| Quadrant | BADHDUFLAG | Total packets | Discarded packets |
| A | 0 | 8 | 4 |
| B | 0 | 8 | 2 |
| C | 0 | 8 | 2 |
| D | 0 | 8 | 2 |
| Mode M0 | |||
|---|---|---|---|
| Quadrant | BADHDUFLAG | Total packets | Discarded packets |
| A | 0 | 12937 | 10229 |
| B | 0 | 12819 | 10262 |
| C | 0 | 12690 | 10143 |
| D | 0 | 14037 | 13932 |
| Quadrant | Total seconds | Saturated seconds | Saturation percentage |
|---|---|---|---|
| A | 1311 | 14 | 1.067887% |
| B | 1258 | 11 | 0.874404% |
| C | 1260 | 2 | 0.158730% |
| D | 52 | 0 | 0.000000% |
Noise dominated data is calculated using 1-second bins in cleaned event files. If a bin has >2000 counts, and if more than 50% of those come from <1% of pixels, then it is considered to be noise-dominated and hence unusable.
| Quadrant | # 1 sec bins | Bins with >0 counts | Bins with >2000 counts | High rate bins dominated by noise | Noise dominated (total time) | Noise dominated (detector-on time) | Marked lightcurve |
|---|---|---|---|---|---|---|---|
| A | 7408 | 1800 | 1 | 1 | 0.01% | 0.06% | 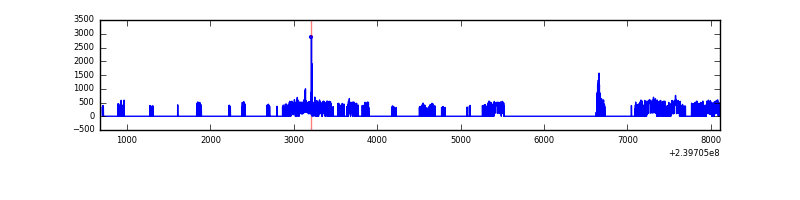 |
| B | 7409 | 1741 | 0 | 0 | 0.00% | 0.00% | 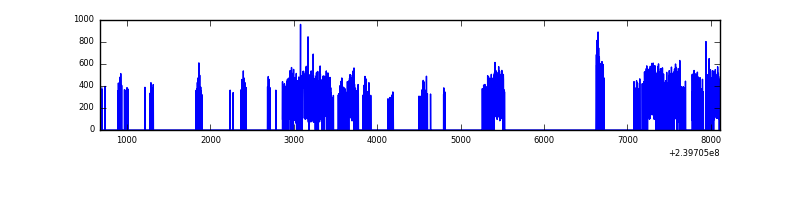 |
| C | 7435 | 1759 | 0 | 0 | 0.00% | 0.00% | 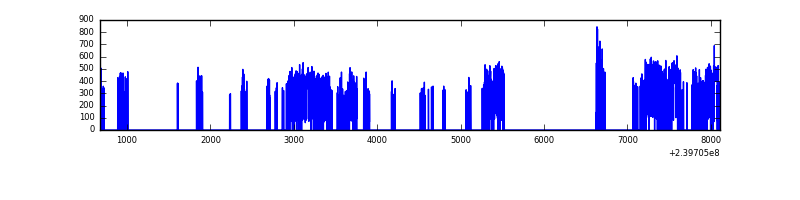 |
| D | 1516 | 91 | 0 | 0 | 0.00% | 0.00% | 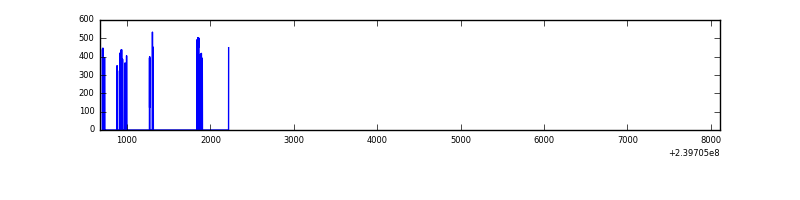 |
Top three noisy pixels from each quadrant. If the there are fewer than three noisy pixels in the level2.evt file, extra rows are filled as -1
| Pixel properties | Quadrant properties | ||||||
|---|---|---|---|---|---|---|---|
| Quadrant | DetID | PixID | Counts | Sigma | Mean | Median | Sigma |
| A | 8 | 15 | 20982 | 612.94 | 156 | 153 | 34.0 |
| A | 15 | 174 | 10602 | 307.48 | 156 | 153 | 34.0 |
| A | 13 | 251 | 6808 | 195.84 | 156 | 153 | 34.0 |
| B | 0 | 214 | 6710 | 210.79 | 150 | 146 | 31.1 |
| B | 4 | 239 | 4784 | 148.94 | 150 | 146 | 31.1 |
| B | 12 | 111 | 3022 | 92.36 | 150 | 146 | 31.1 |
| C | 13 | 61 | 1061 | 25.93 | 144 | 145 | 35.3 |
| C | 14 | 67 | 814 | 18.94 | 144 | 145 | 35.3 |
| C | 8 | 222 | 738 | 16.79 | 144 | 145 | 35.3 |
| D | 8 | 195 | 1696 | 609.37 | 5 | 5 | 2.8 |
| D | 1 | 52 | 318 | 112.79 | 5 | 5 | 2.8 |
| D | 2 | 152 | 261 | 92.25 | 5 | 5 | 2.8 |
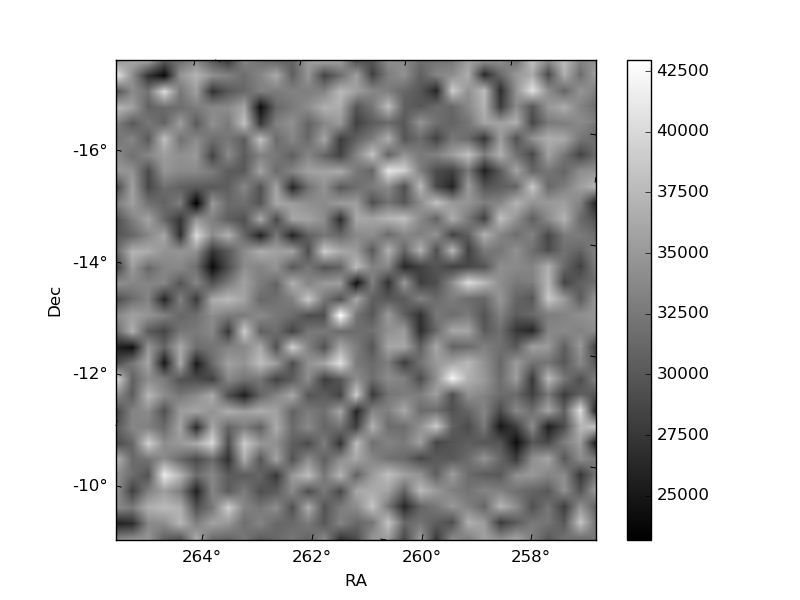
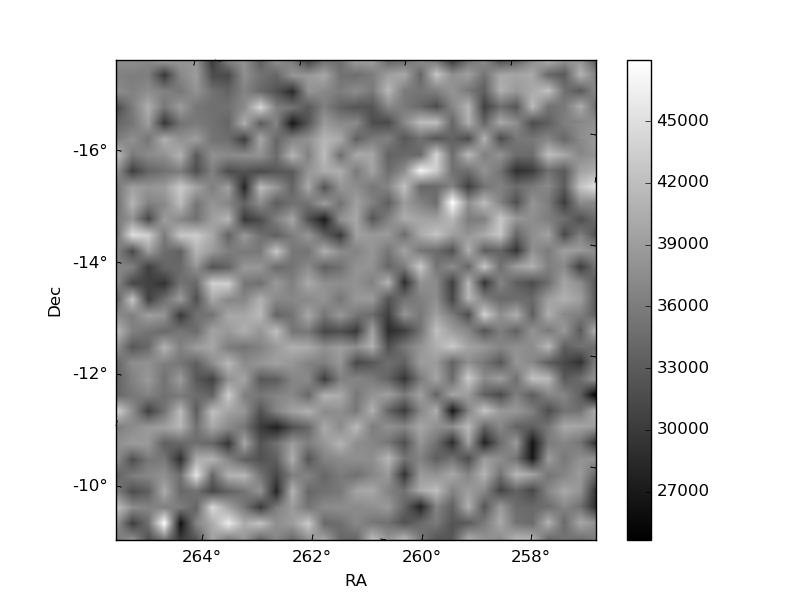
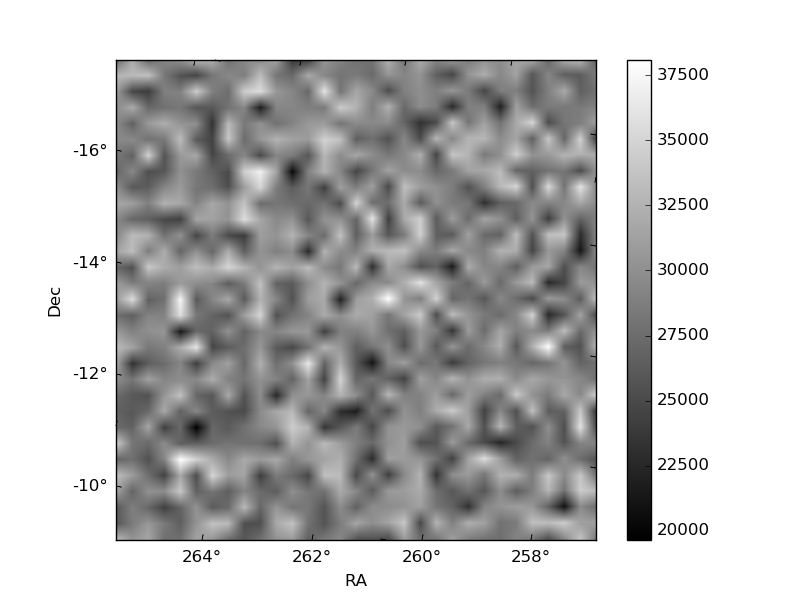
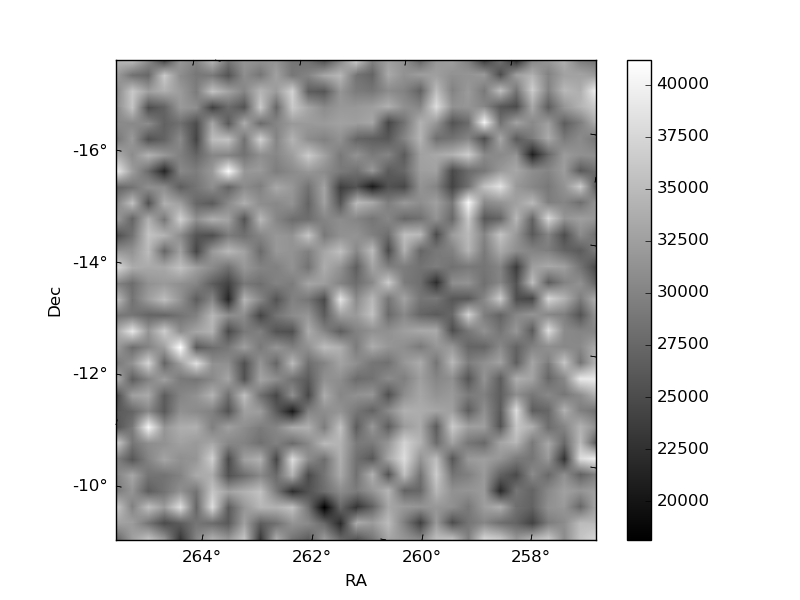
Histogram calculated using DETX and DETY for each event in the final _common_clean file
| Quadrant A | 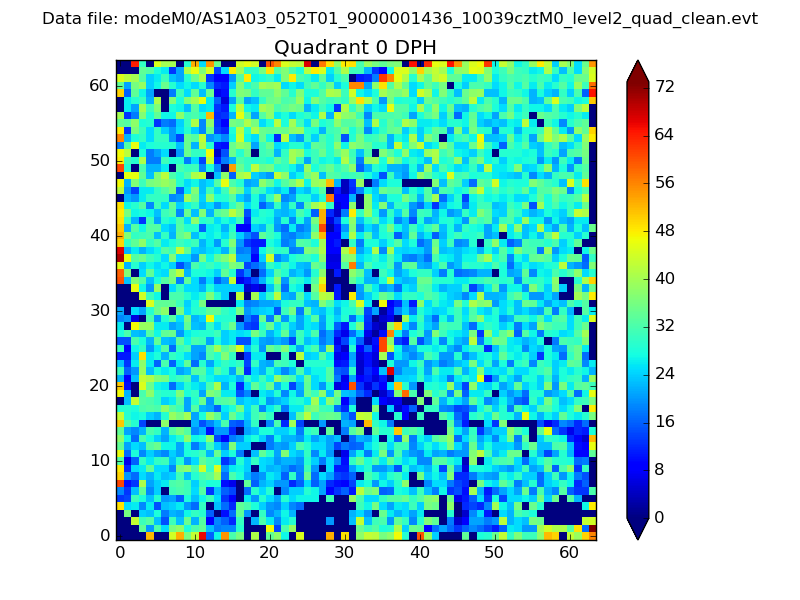 |
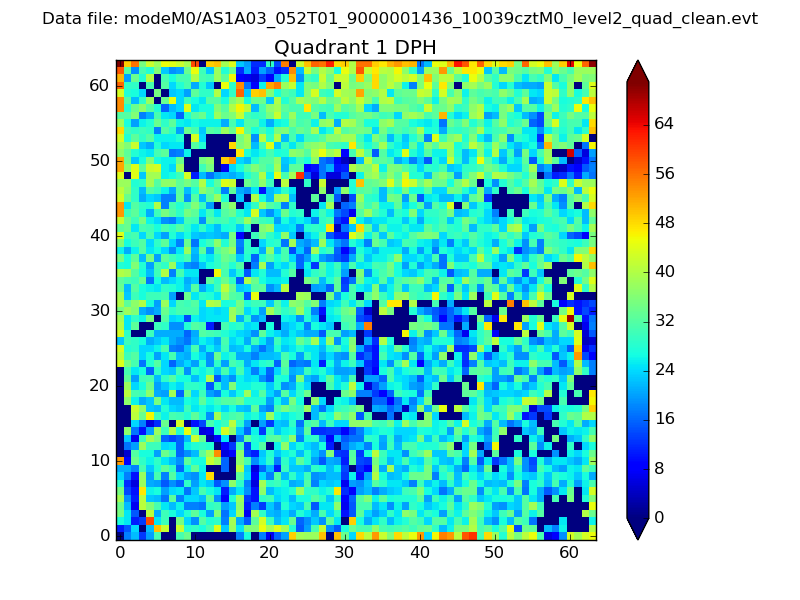 |
Quadrant B |
|---|---|---|---|
| Quadrant D | 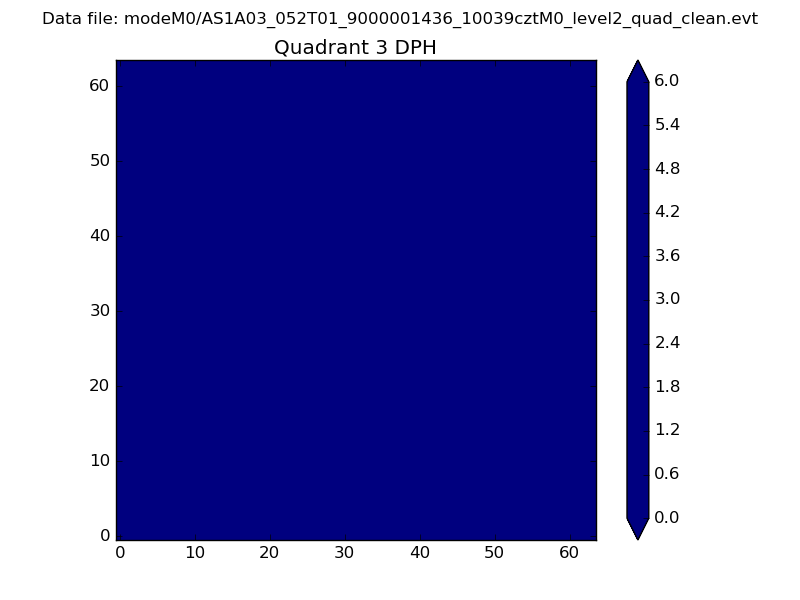 |
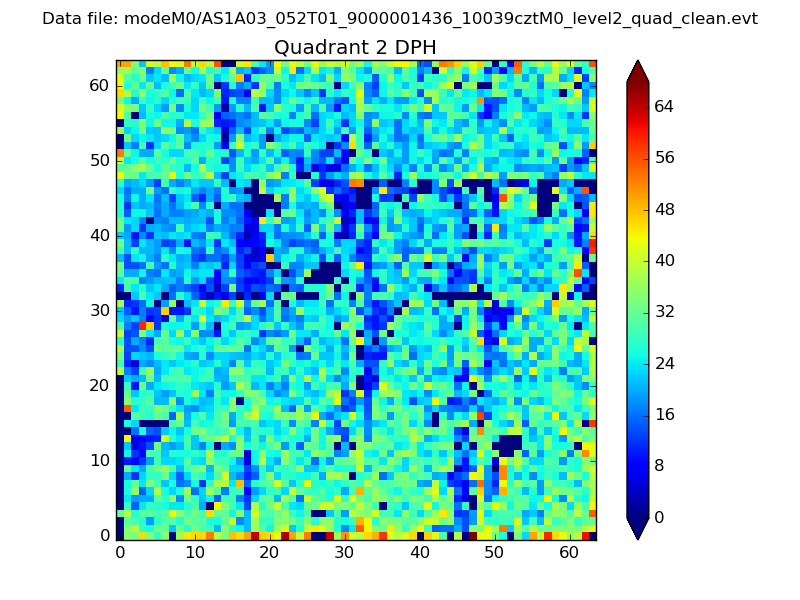 |
Quadrant C |
| Plot type | Count rate plots | Images |
|---|---|---|
| Comparison with Poisson distribution Blue bars denote a histogram of data divided into 1 sec bins. Red curve is a Poisson curve with rate = median count rate of data. |
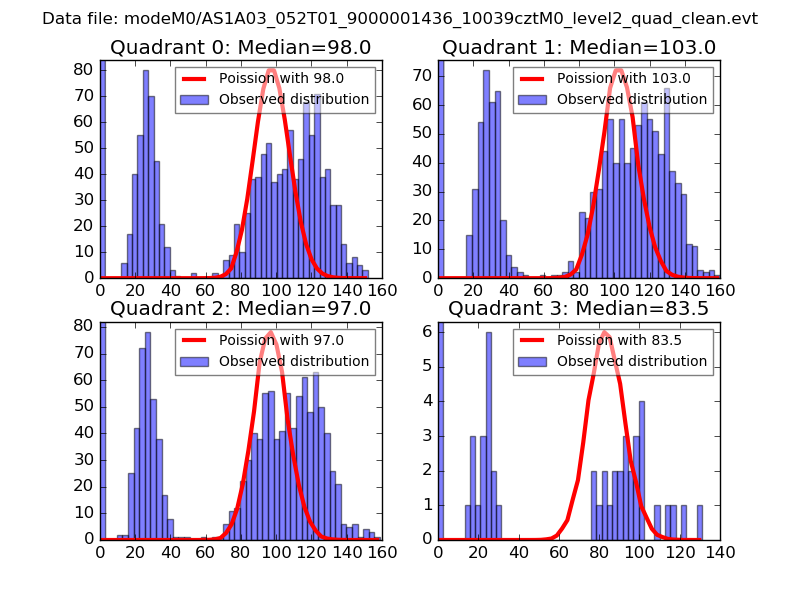 |
 |
| Quadrant-wise count rates Data is divided into 100 sec bins |
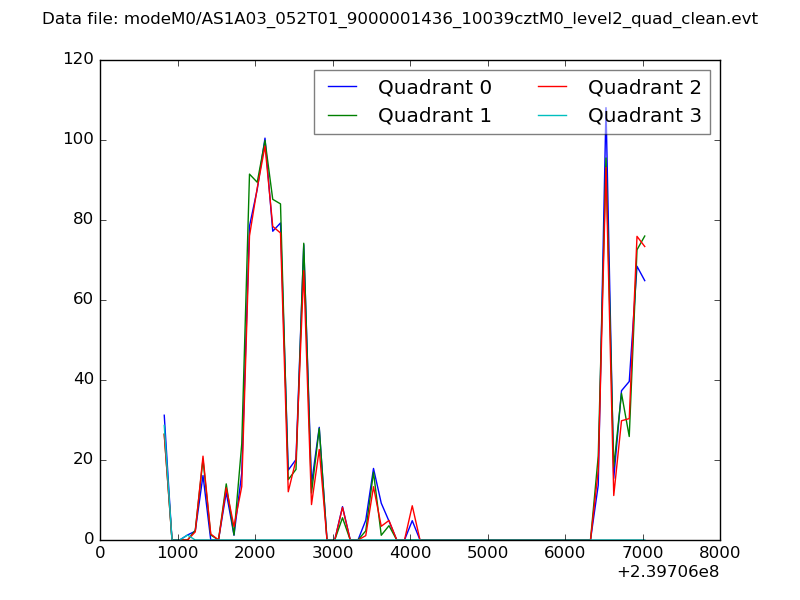 |
|
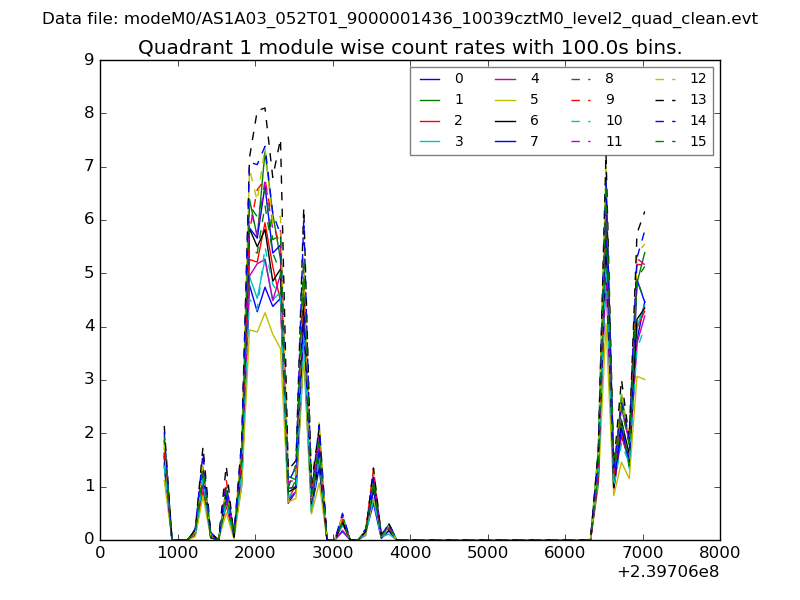
| Module-wise count rates for Quadrant A Data is divided into 100 sec bins |
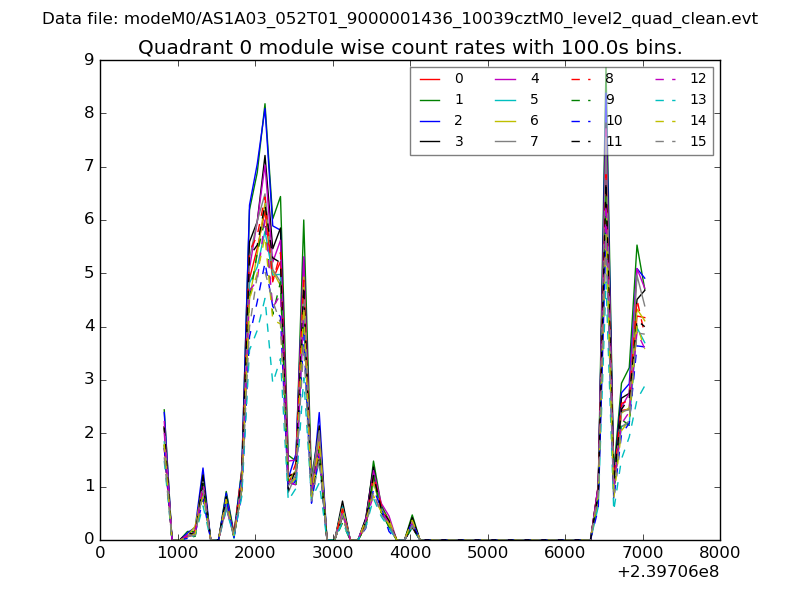 |
 |
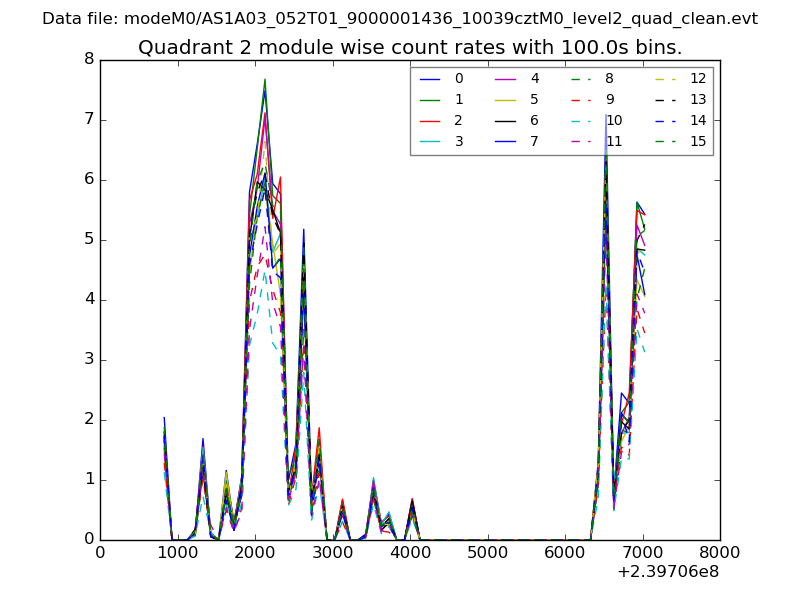
| Module-wise count rates for Quadrant B Data is divided into 100 sec bins |
 |
 |
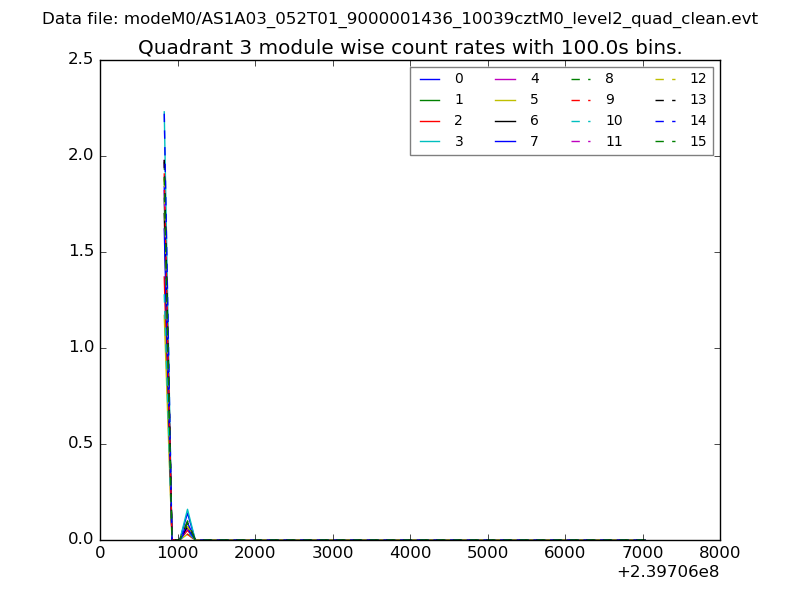
| Module-wise count rates for Quadrant C Data is divided into 100 sec bins |
 |
 |
| Module-wise count rates for Quadrant D Data is divided into 100 sec bins |
 |
 |
| Parameter | Plot |
|---|---|
| CZT HV Monitor | 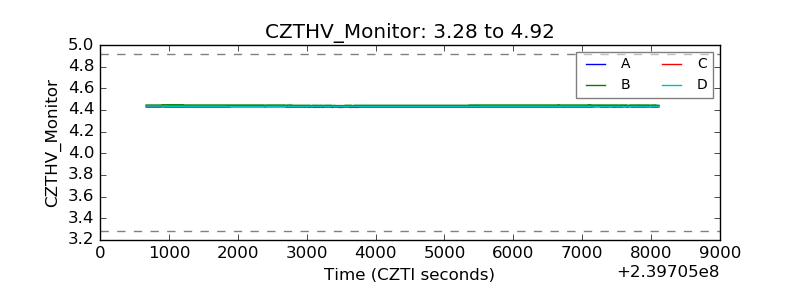 |
| D_VDD | 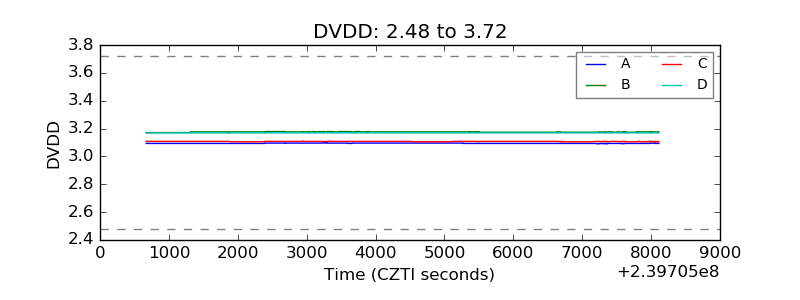 |
| Temperature 1 | 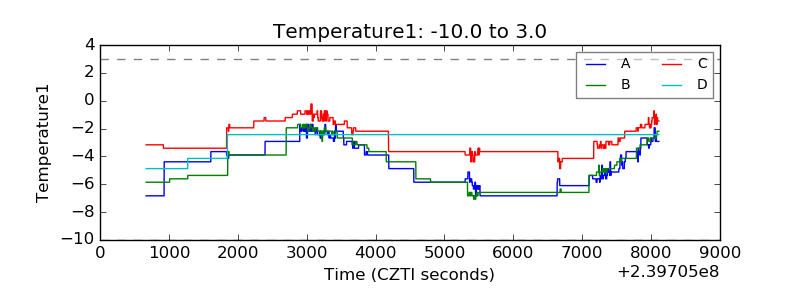 |
| Veto HV Monitor | 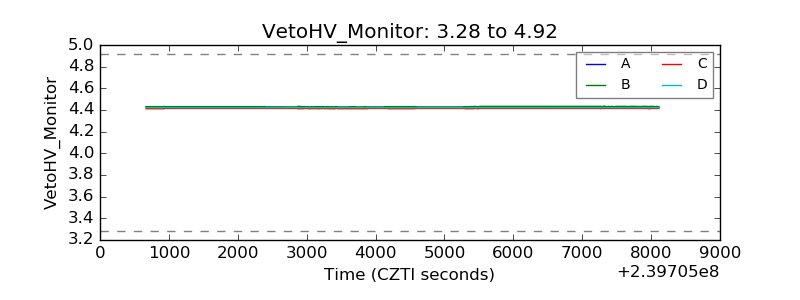 |
| Veto LLD | 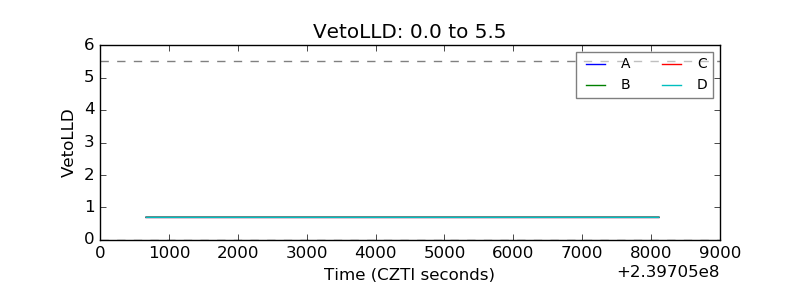 |
| Alpha Counter | 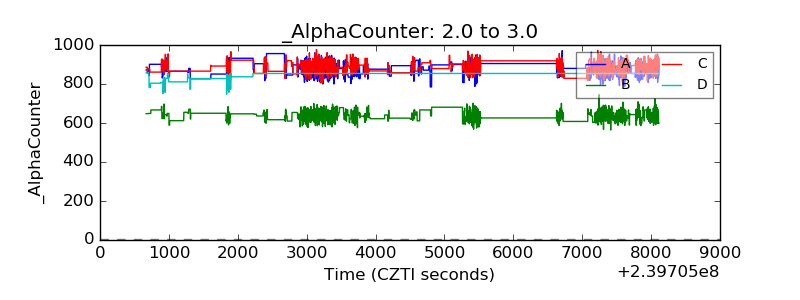 |
| _CPM_Rate |  |
| CZT Counter | 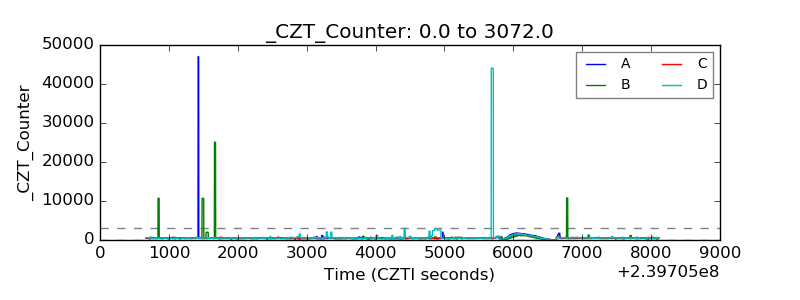 |
| +2.5 Volts monitor |  |
| +5 Volts monitor |  |
| _ROLL_ROT | 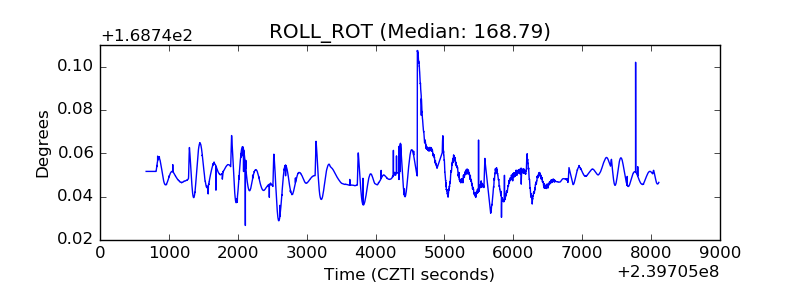 |
| _Roll_DEC | 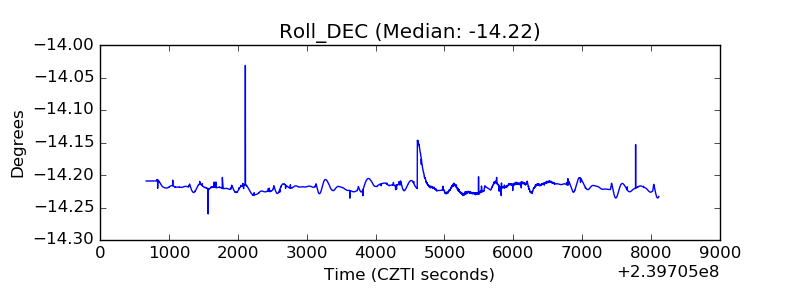 |
| _Roll_RA |  |
| Veto Counter | 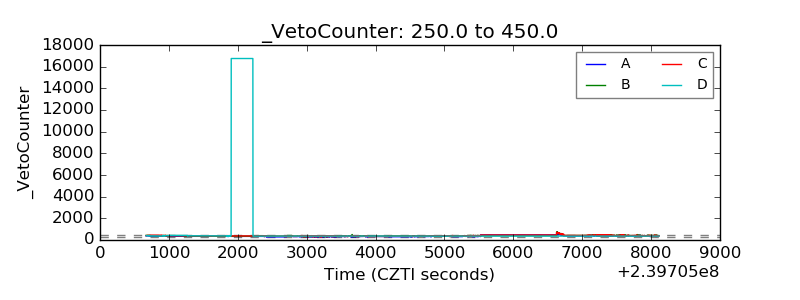 |