| Param | Original file | Final file |
|---|---|---|
| Filename | modeM0/AS1A03_052T01_9000001436_10040cztM0_level2.evt | modeM0/AS1A03_052T01_9000001436_10040cztM0_level2_quad_clean.evt |
| Size (bytes) | 756,262,080 | 151,269,120 |
| Size | 721.2 MB | 144.3 MB |
| Events in quadrant A | 5,472,538 | 962,170 |
| Events in quadrant B | 5,422,081 | 984,348 |
| Events in quadrant C | 5,069,179 | 953,959 |
| Events in quadrant D | 6,172,566 | 898,883 |
| Mode SS | |||
|---|---|---|---|
| Quadrant | BADHDUFLAG | Total packets | Discarded packets |
| A | 0 | 276 | 50 |
| B | 0 | 276 | 38 |
| C | 0 | 276 | 44 |
| D | 0 | 276 | 50 |
| Mode M9 | |||
|---|---|---|---|
| Quadrant | BADHDUFLAG | Total packets | Discarded packets |
| A | 0 | 25 | 4 |
| B | 0 | 25 | 4 |
| C | 0 | 25 | 6 |
| D | 0 | 25 | 5 |
| Mode M0 | |||
|---|---|---|---|
| Quadrant | BADHDUFLAG | Total packets | Discarded packets |
| A | 0 | 28597 | 5185 |
| B | 0 | 28115 | 4768 |
| C | 0 | 27662 | 4723 |
| D | 0 | 31392 | 6054 |
| Quadrant | Total seconds | Saturated seconds | Saturation percentage |
|---|---|---|---|
| A | 11282 | 112 | 0.992732% |
| B | 11356 | 108 | 0.951039% |
| C | 11329 | 72 | 0.635537% |
| D | 11169 | 179 | 1.602650% |
Noise dominated data is calculated using 1-second bins in cleaned event files. If a bin has >2000 counts, and if more than 50% of those come from <1% of pixels, then it is considered to be noise-dominated and hence unusable.
| Quadrant | # 1 sec bins | Bins with >0 counts | Bins with >2000 counts | High rate bins dominated by noise | Noise dominated (total time) | Noise dominated (detector-on time) | Marked lightcurve |
|---|---|---|---|---|---|---|---|
| A | 16047 | 12272 | 6 | 6 | 0.04% | 0.05% | 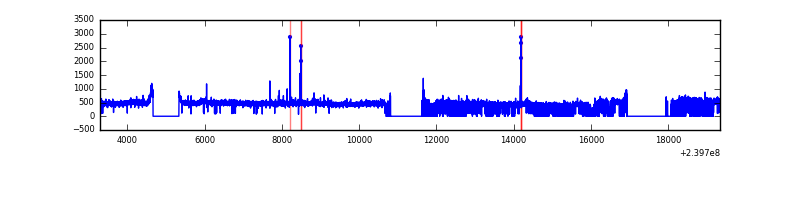 |
| B | 16047 | 12304 | 2 | 2 | 0.01% | 0.02% | 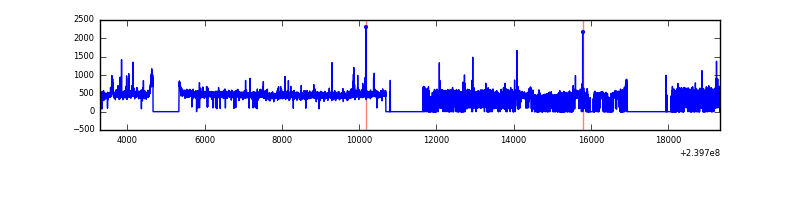 |
| C | 16047 | 12293 | 0 | 0 | 0.00% | 0.00% | 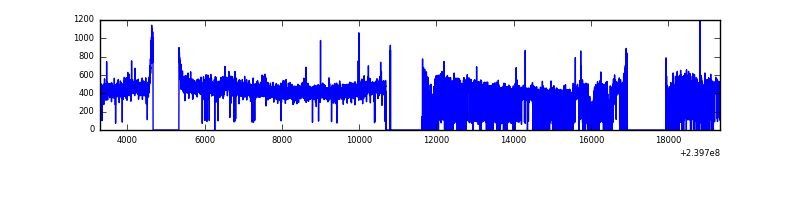 |
| D | 16047 | 12156 | 88 | 88 | 0.55% | 0.72% | 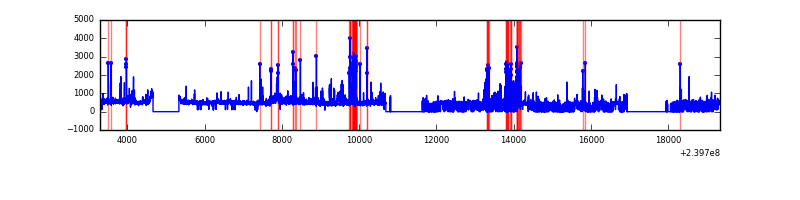 |
Top three noisy pixels from each quadrant. If the there are fewer than three noisy pixels in the level2.evt file, extra rows are filled as -1
| Pixel properties | Quadrant properties | ||||||
|---|---|---|---|---|---|---|---|
| Quadrant | DetID | PixID | Counts | Sigma | Mean | Median | Sigma |
| A | 8 | 15 | 236721 | 868.05 | 1333 | 1303 | 271.2 |
| A | 15 | 174 | 69936 | 253.07 | 1333 | 1303 | 271.2 |
| A | 0 | 8 | 29826 | 105.17 | 1333 | 1303 | 271.2 |
| B | 0 | 214 | 76557 | 291.33 | 1345 | 1311 | 258.3 |
| B | 4 | 239 | 41857 | 156.98 | 1345 | 1311 | 258.3 |
| B | 12 | 111 | 28352 | 104.7 | 1345 | 1311 | 258.3 |
| C | 14 | 67 | 22149 | 69.72 | 1292 | 1298 | 299.1 |
| C | 13 | 61 | 9804 | 28.44 | 1292 | 1298 | 299.1 |
| C | 8 | 222 | 8485 | 24.03 | 1292 | 1298 | 299.1 |
| D | 12 | 233 | 284732 | 888.07 | 1261 | 1226 | 319.2 |
| D | 8 | 195 | 275182 | 858.15 | 1261 | 1226 | 319.2 |
| D | 1 | 52 | 221814 | 690.98 | 1261 | 1226 | 319.2 |
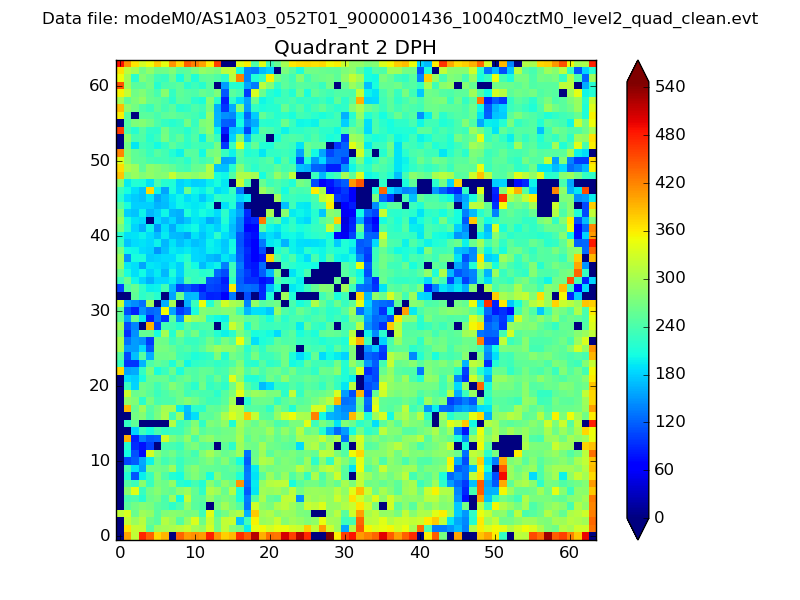
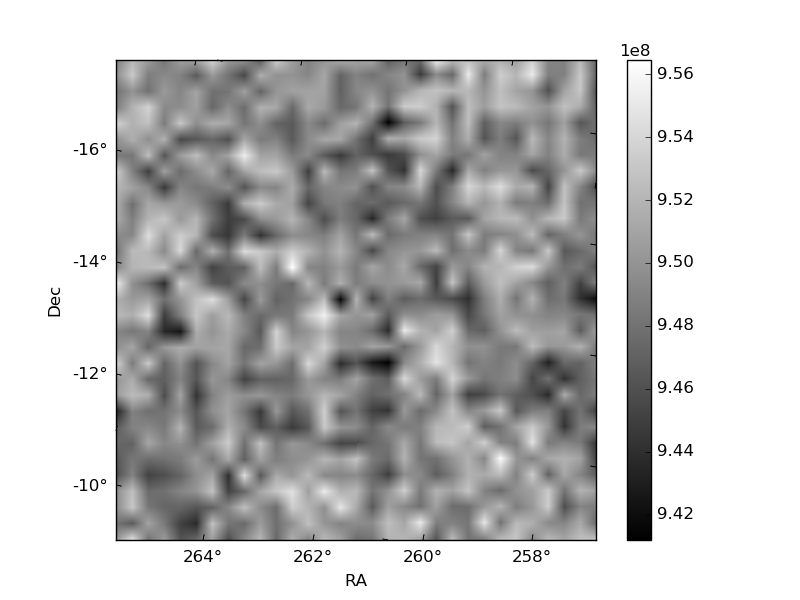
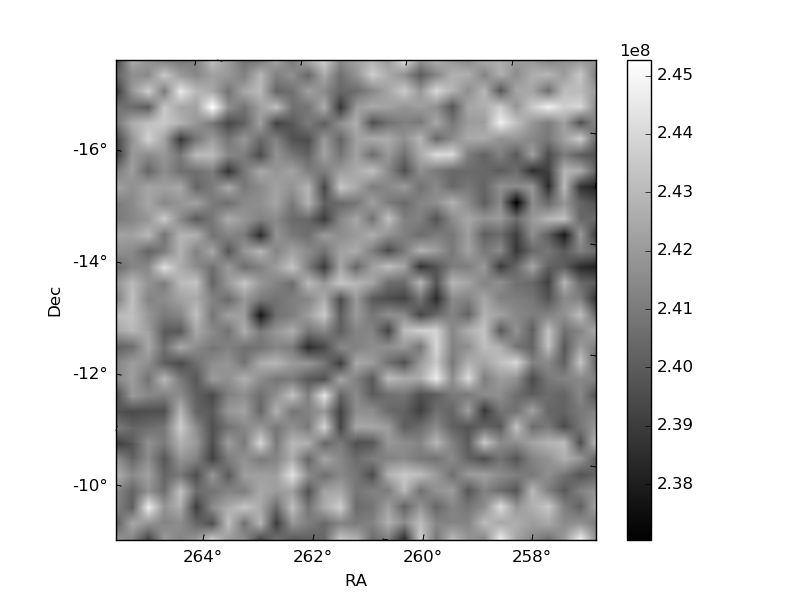
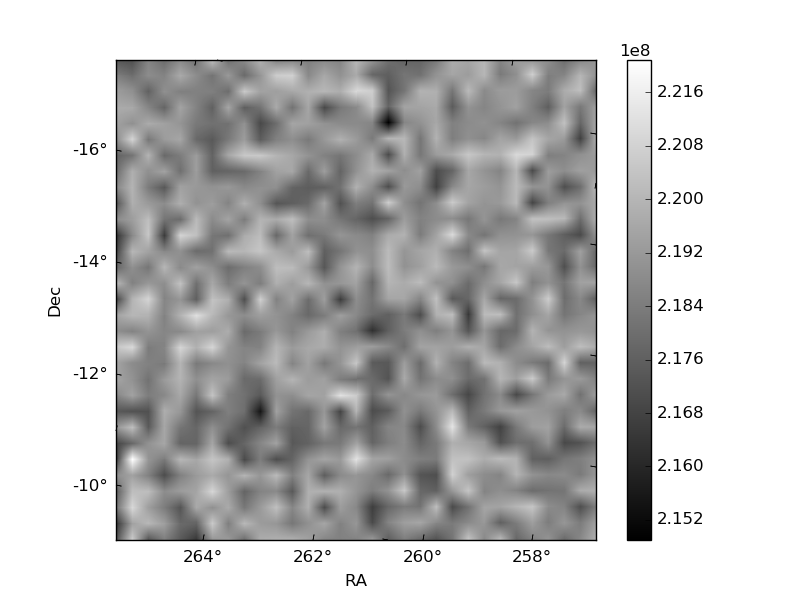
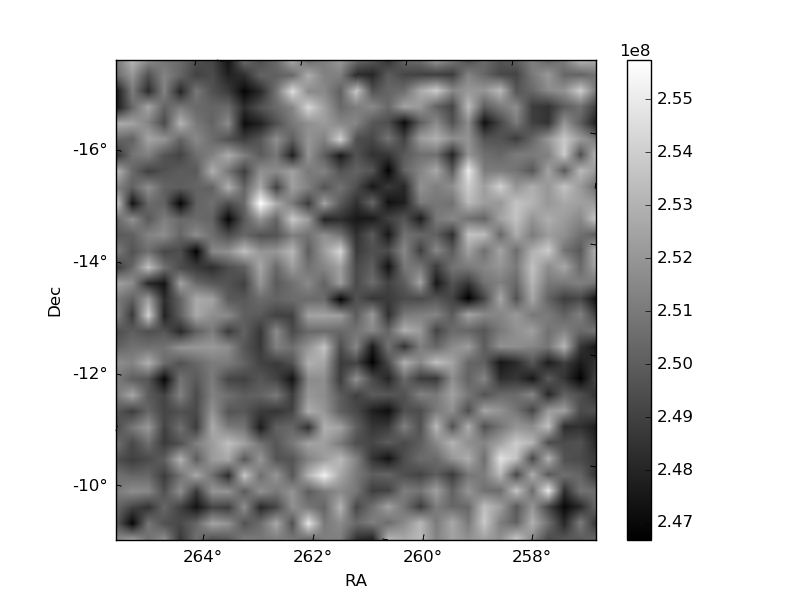
Histogram calculated using DETX and DETY for each event in the final _common_clean file
| Quadrant A | 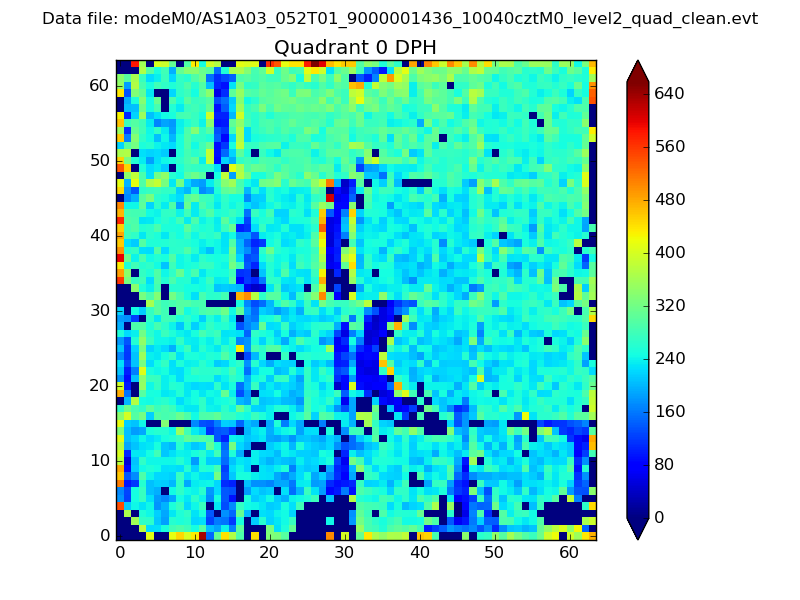 |
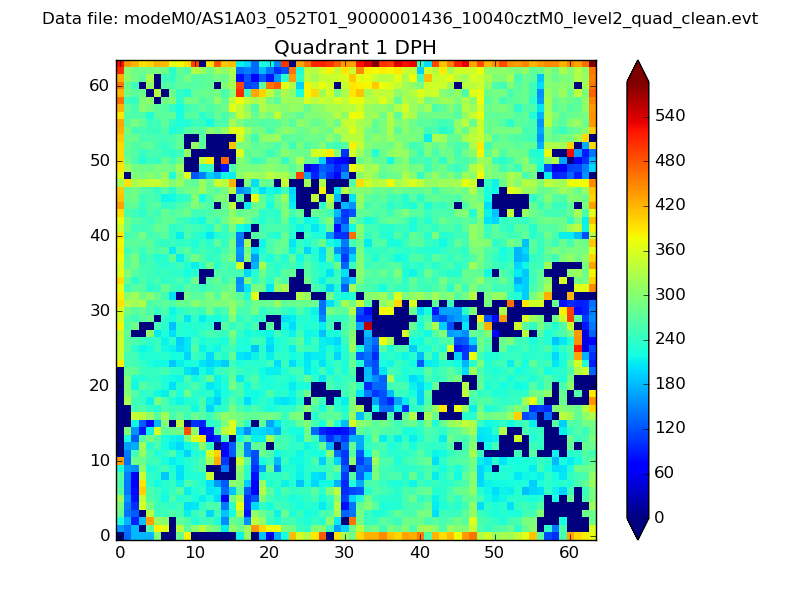 |
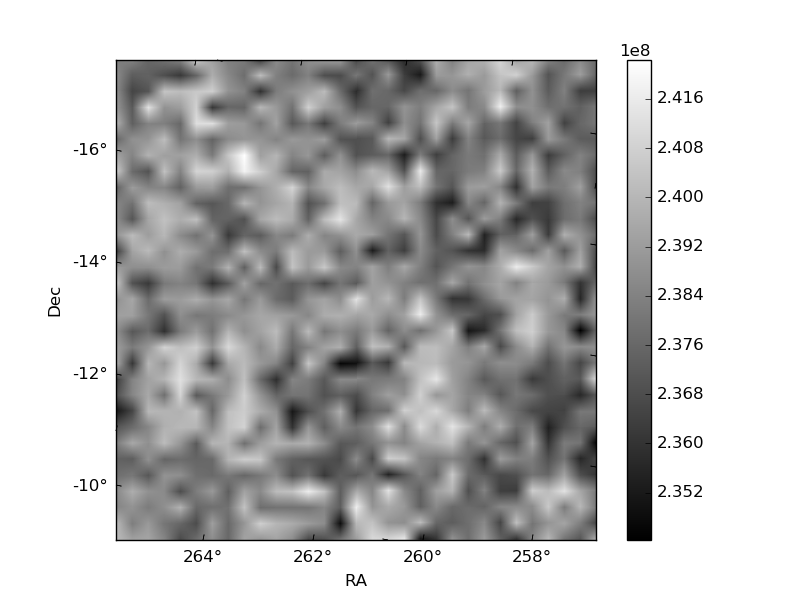
Quadrant B |
|---|---|---|---|
| Quadrant D | 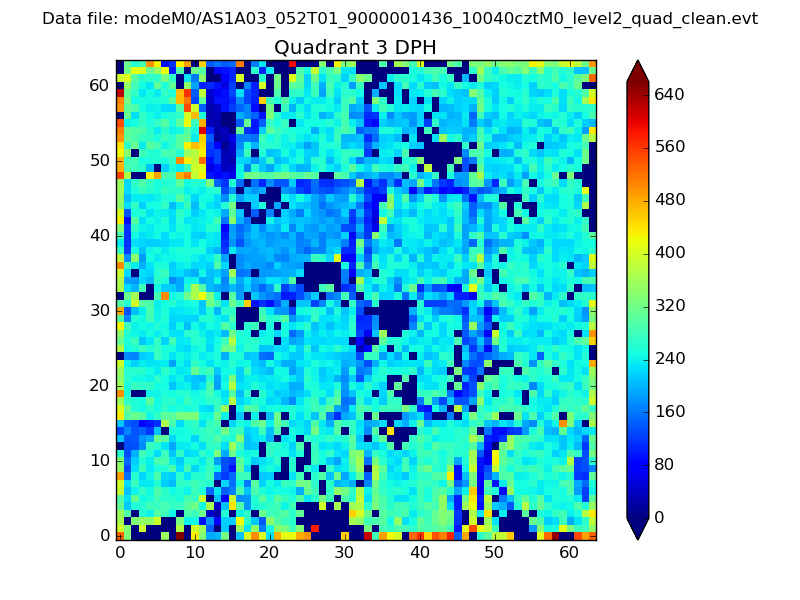 |
 |
Quadrant C |
| Plot type | Count rate plots | Images |
|---|---|---|
| Comparison with Poisson distribution Blue bars denote a histogram of data divided into 1 sec bins. Red curve is a Poisson curve with rate = median count rate of data. |
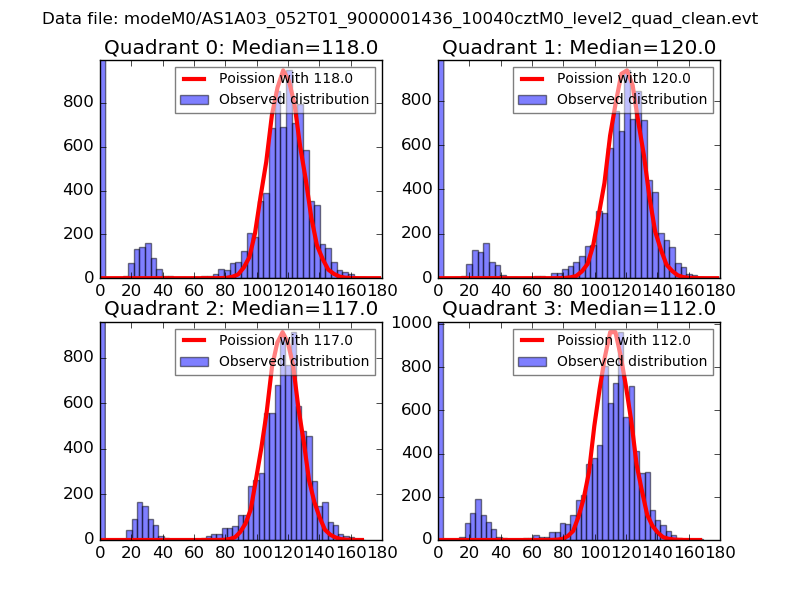 |
 |
| Quadrant-wise count rates Data is divided into 100 sec bins |
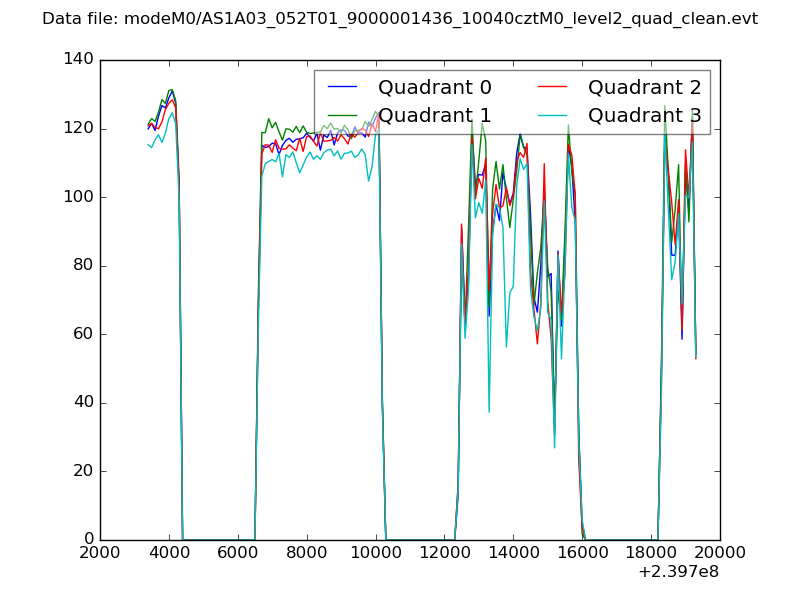 |
|
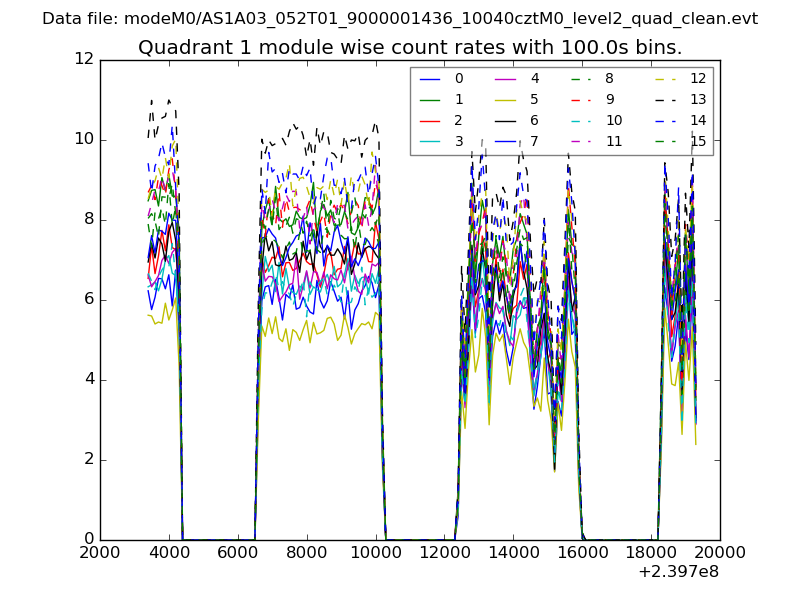
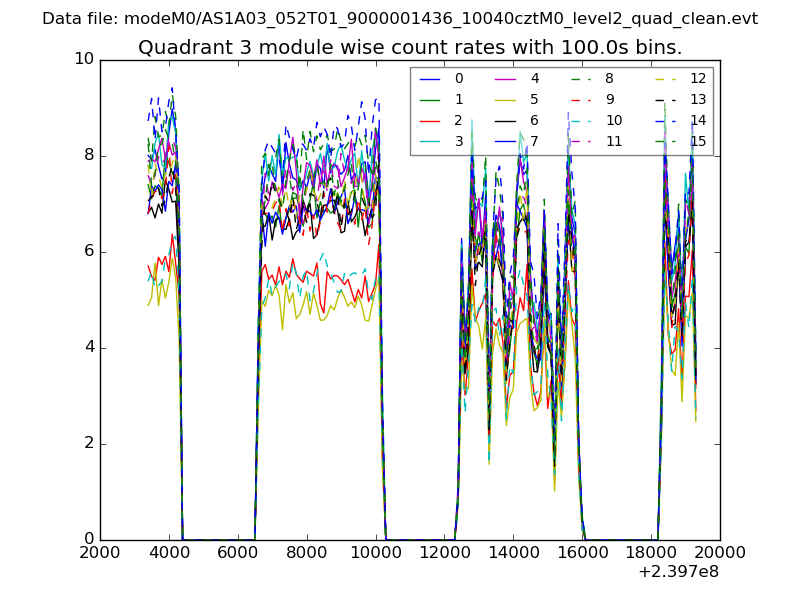
| Module-wise count rates for Quadrant A Data is divided into 100 sec bins |
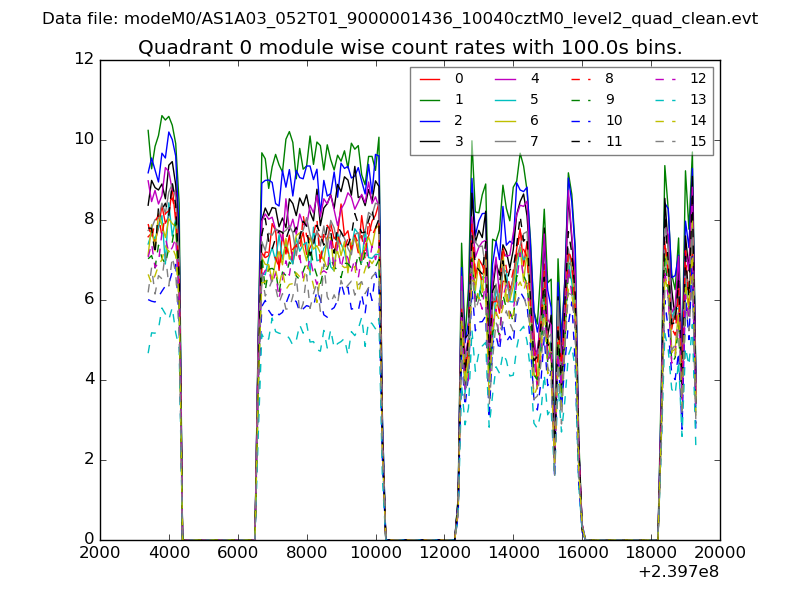 |
 |
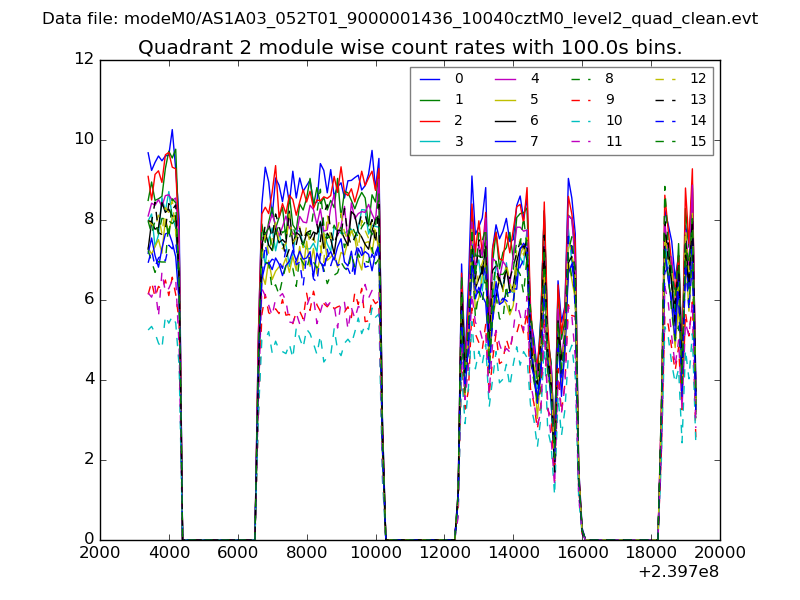
| Module-wise count rates for Quadrant B Data is divided into 100 sec bins |
 |
 |
| Module-wise count rates for Quadrant C Data is divided into 100 sec bins |
 |
 |
| Module-wise count rates for Quadrant D Data is divided into 100 sec bins |
 |
 |
| Parameter | Plot |
|---|---|
| CZT HV Monitor | 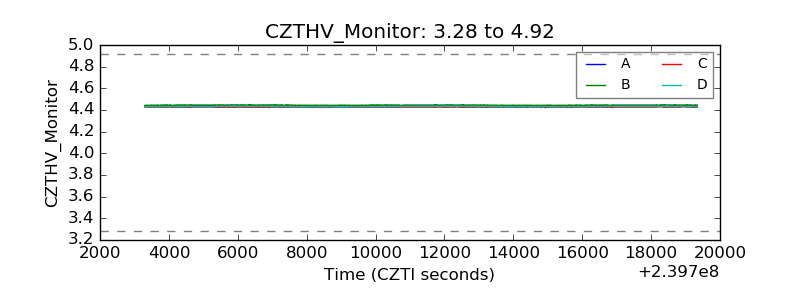 |
| D_VDD | 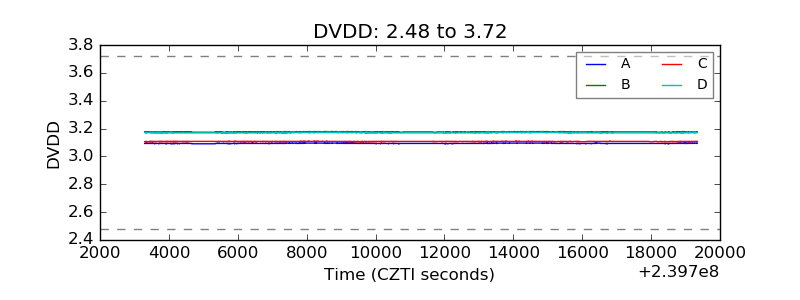 |
| Temperature 1 | 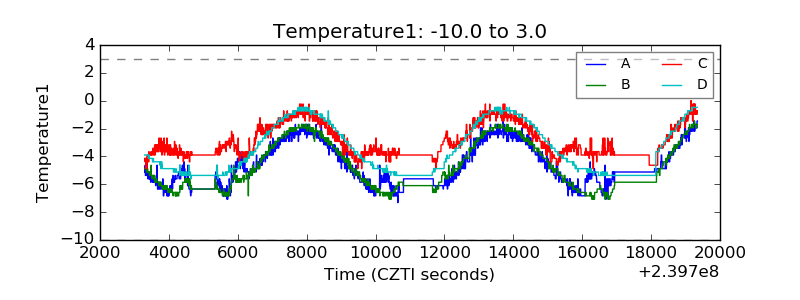 |
| Veto HV Monitor | 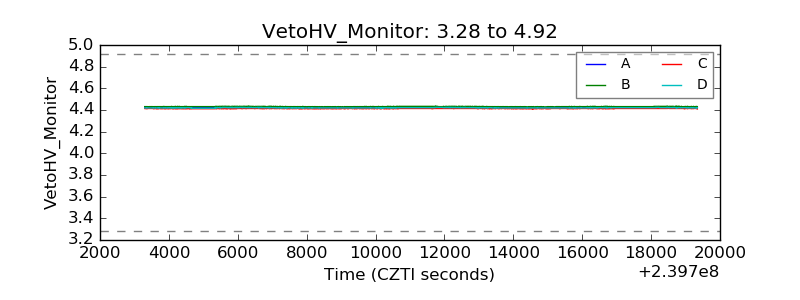 |
| Veto LLD | 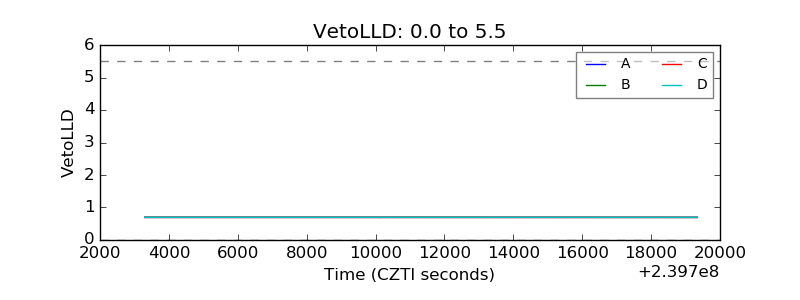 |
| Alpha Counter | 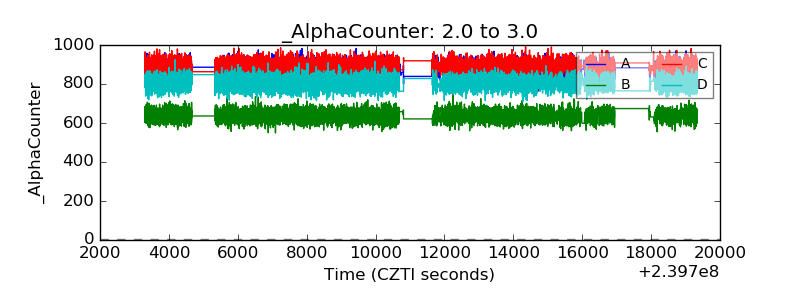 |
| _CPM_Rate | 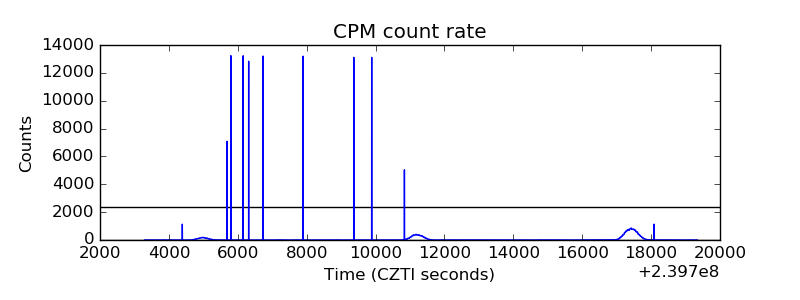 |
| CZT Counter | 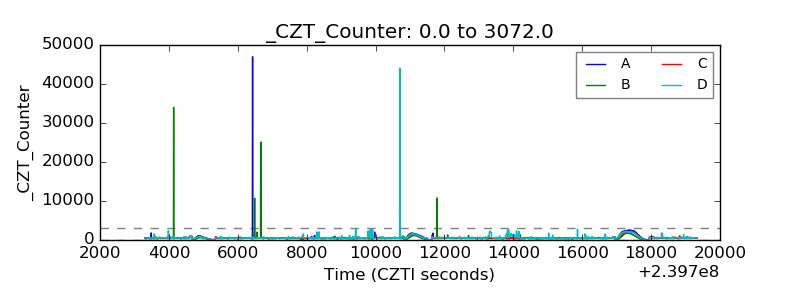 |
| +2.5 Volts monitor |  |
| +5 Volts monitor |  |
| _ROLL_ROT | 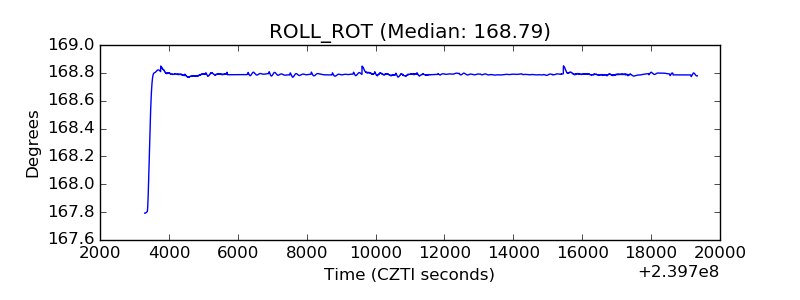 |
| _Roll_DEC | 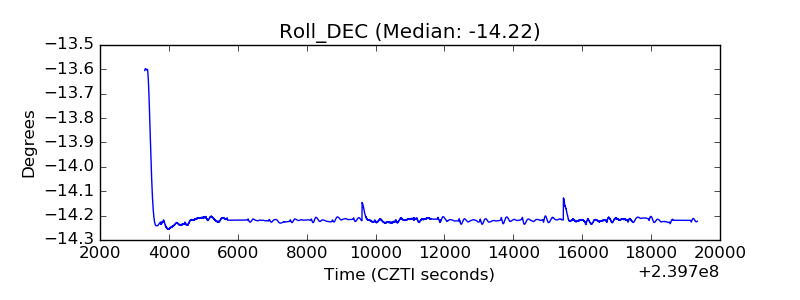 |
| _Roll_RA | 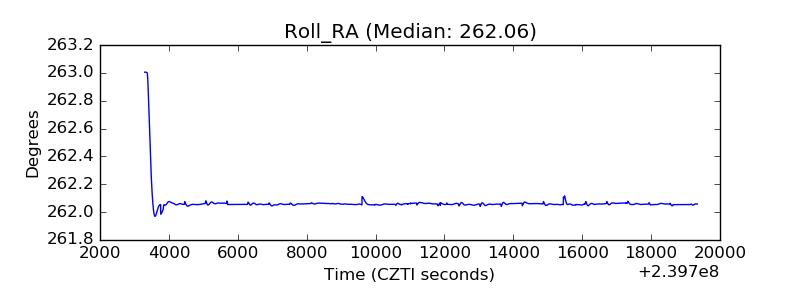 |
| Veto Counter | 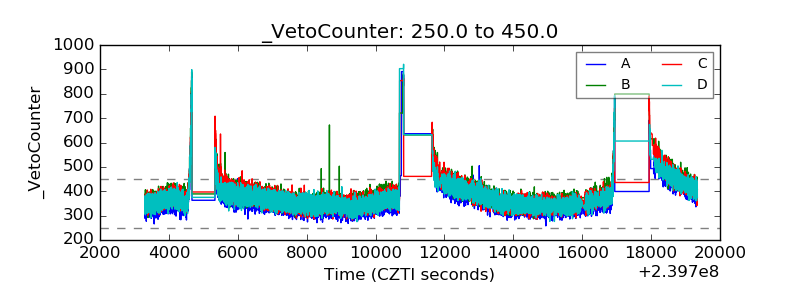 |