| Param | Original file | Final file |
|---|---|---|
| Filename | modeM0/AS1A03_052T01_9000001436_10042cztM0_level2.evt | modeM0/AS1A03_052T01_9000001436_10042cztM0_level2_quad_clean.evt |
| Size (bytes) | 1,284,940,800 | 257,673,600 |
| Size | 1.2 GB | 245.7 MB |
| Events in quadrant A | 9,343,981 | 1,651,796 |
| Events in quadrant B | 9,145,237 | 1,676,616 |
| Events in quadrant C | 8,535,993 | 1,626,142 |
| Events in quadrant D | 10,617,278 | 1,554,252 |
| Mode SS | |||
|---|---|---|---|
| Quadrant | BADHDUFLAG | Total packets | Discarded packets |
| A | 0 | 384 | 0 |
| B | 0 | 384 | 0 |
| C | 0 | 384 | 2 |
| D | 0 | 384 | 0 |
| Mode M9 | |||
|---|---|---|---|
| Quadrant | BADHDUFLAG | Total packets | Discarded packets |
| A | 0 | 36 | 0 |
| B | 0 | 36 | 0 |
| C | 0 | 36 | 0 |
| D | 0 | 36 | 0 |
| Mode M0 | |||
|---|---|---|---|
| Quadrant | BADHDUFLAG | Total packets | Discarded packets |
| A | 0 | 39853 | 24 |
| B | 0 | 39505 | 46 |
| C | 0 | 38485 | 31 |
| D | 0 | 43722 | 38 |
| Quadrant | Total seconds | Saturated seconds | Saturation percentage |
|---|---|---|---|
| A | 18815 | 258 | 1.371246% |
| B | 18804 | 240 | 1.276324% |
| C | 18811 | 171 | 0.909043% |
| D | 18812 | 461 | 2.450563% |
Noise dominated data is calculated using 1-second bins in cleaned event files. If a bin has >2000 counts, and if more than 50% of those come from <1% of pixels, then it is considered to be noise-dominated and hence unusable.
| Quadrant | # 1 sec bins | Bins with >0 counts | Bins with >2000 counts | High rate bins dominated by noise | Noise dominated (total time) | Noise dominated (detector-on time) | Marked lightcurve |
|---|---|---|---|---|---|---|---|
| A | 22424 | 18823 | 11 | 11 | 0.05% | 0.06% | 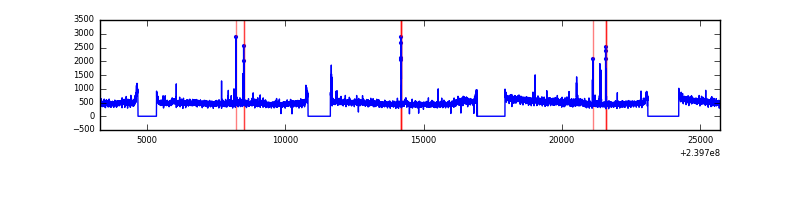 |
| B | 22424 | 18822 | 4 | 4 | 0.02% | 0.02% | 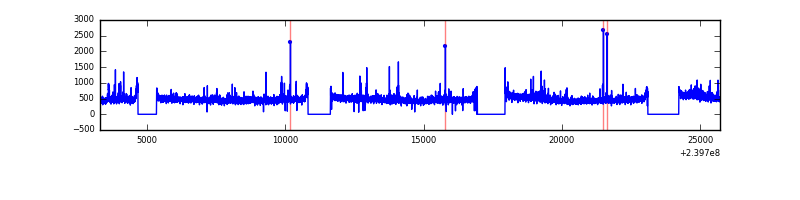 |
| C | 22424 | 18824 | 0 | 0 | 0.00% | 0.00% | 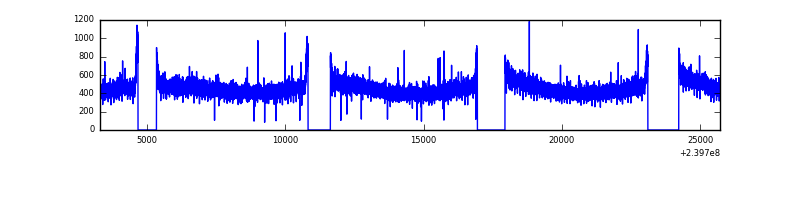 |
| D | 22424 | 18824 | 247 | 247 | 1.10% | 1.31% | 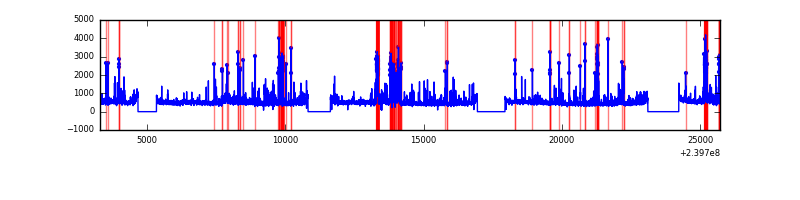 |
Top three noisy pixels from each quadrant. If the there are fewer than three noisy pixels in the level2.evt file, extra rows are filled as -1
| Pixel properties | Quadrant properties | ||||||
|---|---|---|---|---|---|---|---|
| Quadrant | DetID | PixID | Counts | Sigma | Mean | Median | Sigma |
| A | 8 | 15 | 442859 | 965.56 | 2264 | 2215 | 456.4 |
| A | 15 | 174 | 124714 | 268.43 | 2264 | 2215 | 456.4 |
| A | 13 | 251 | 32489 | 66.34 | 2264 | 2215 | 456.4 |
| B | 0 | 214 | 133529 | 303.37 | 2262 | 2210 | 432.9 |
| B | 4 | 239 | 73340 | 164.32 | 2262 | 2210 | 432.9 |
| B | 12 | 111 | 47300 | 104.17 | 2262 | 2210 | 432.9 |
| C | 14 | 67 | 25746 | 46.66 | 2180 | 2190 | 504.8 |
| C | 13 | 61 | 16376 | 28.1 | 2180 | 2190 | 504.8 |
| C | 8 | 222 | 14006 | 23.41 | 2180 | 2190 | 504.8 |
| D | 12 | 233 | 554559 | 1013.99 | 2159 | 2101 | 544.8 |
| D | 1 | 52 | 442208 | 807.78 | 2159 | 2101 | 544.8 |
| D | 2 | 152 | 410127 | 748.9 | 2159 | 2101 | 544.8 |
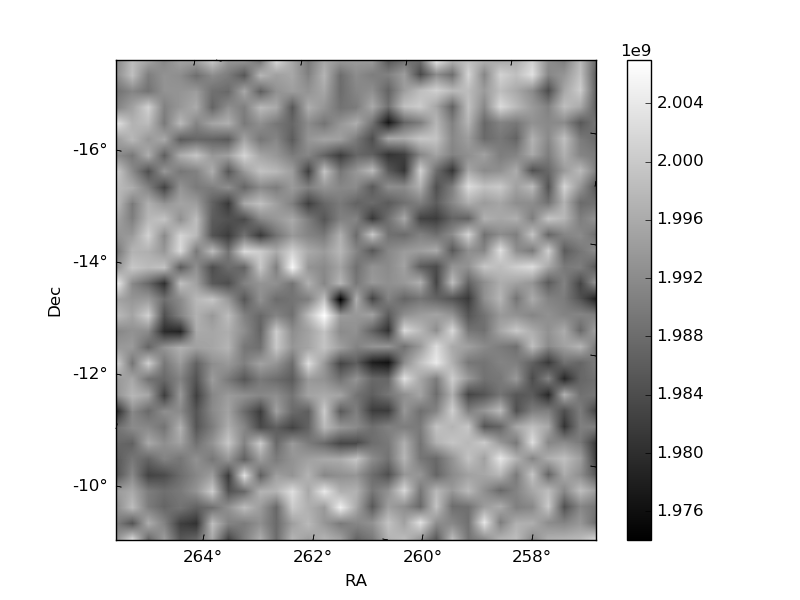
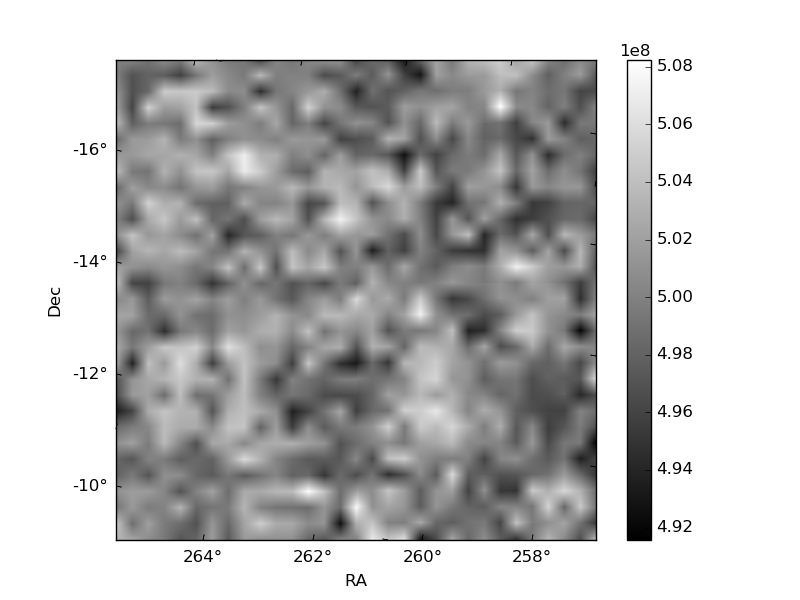
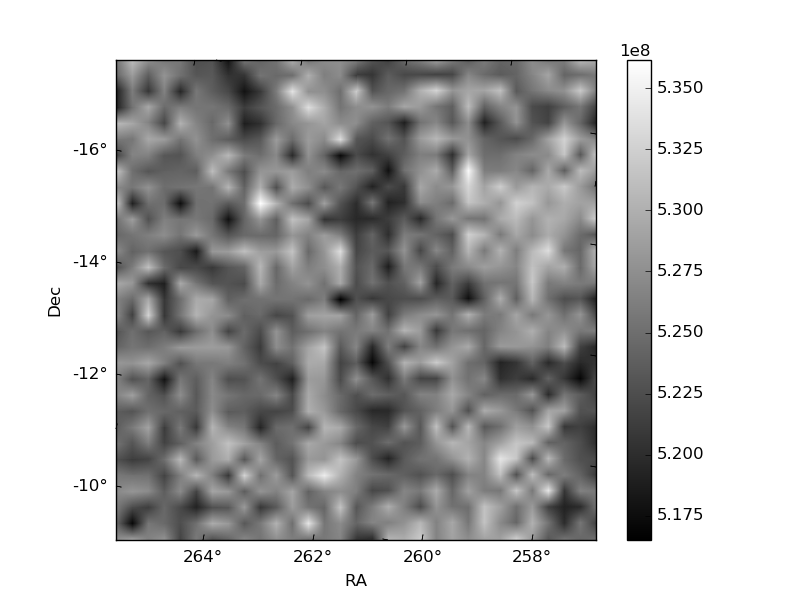
Histogram calculated using DETX and DETY for each event in the final _common_clean file
| Quadrant A | 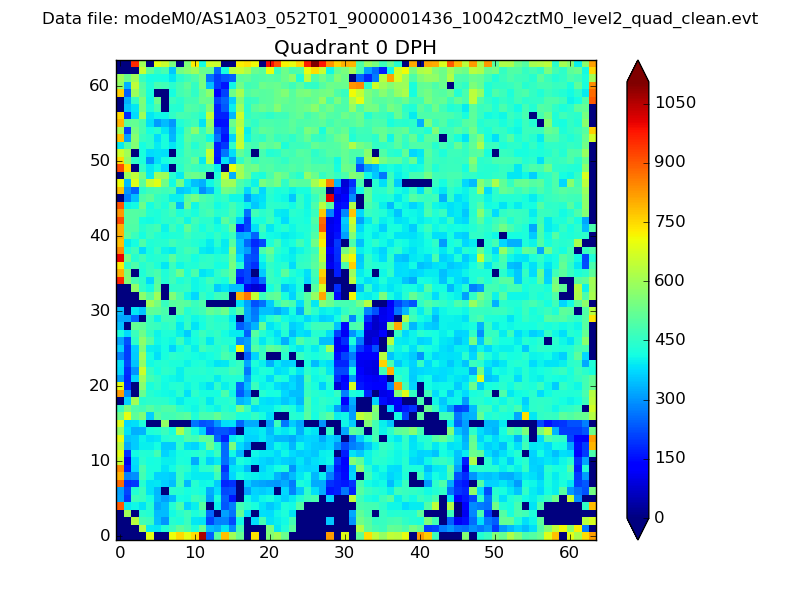 |
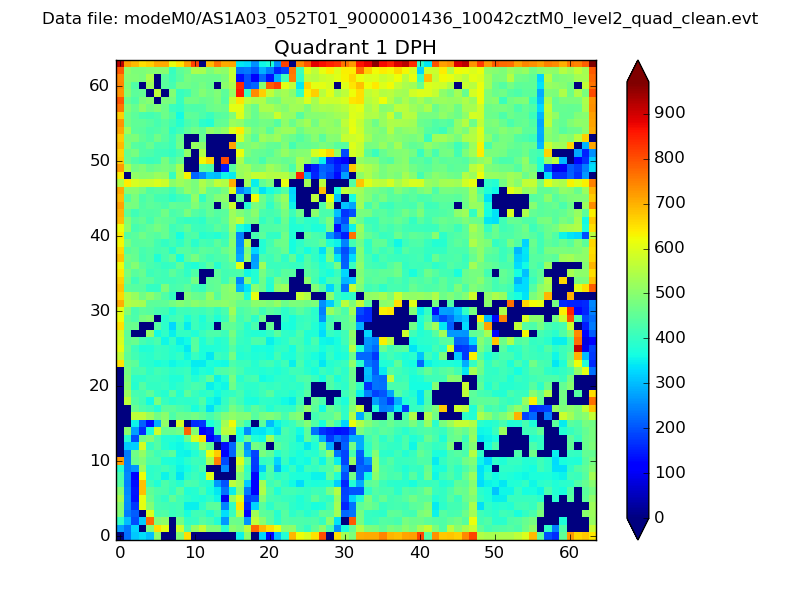 |
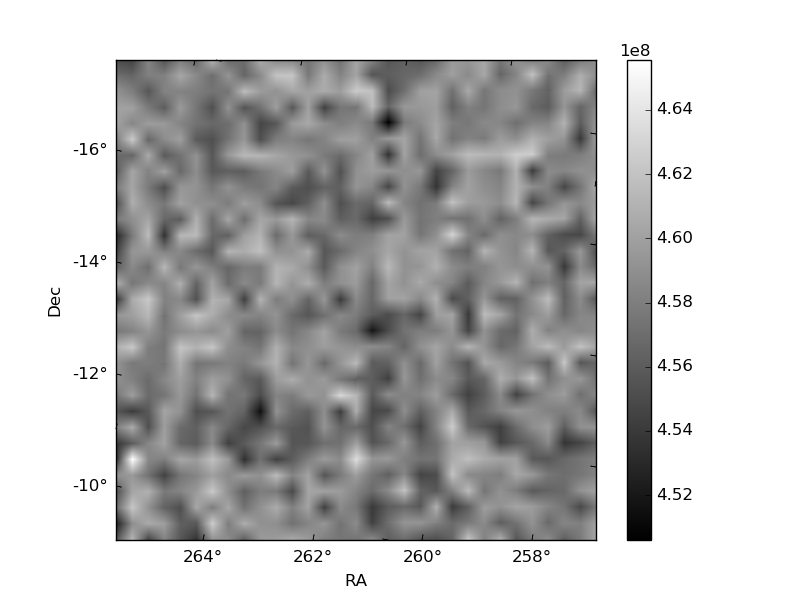
Quadrant B |
|---|---|---|---|
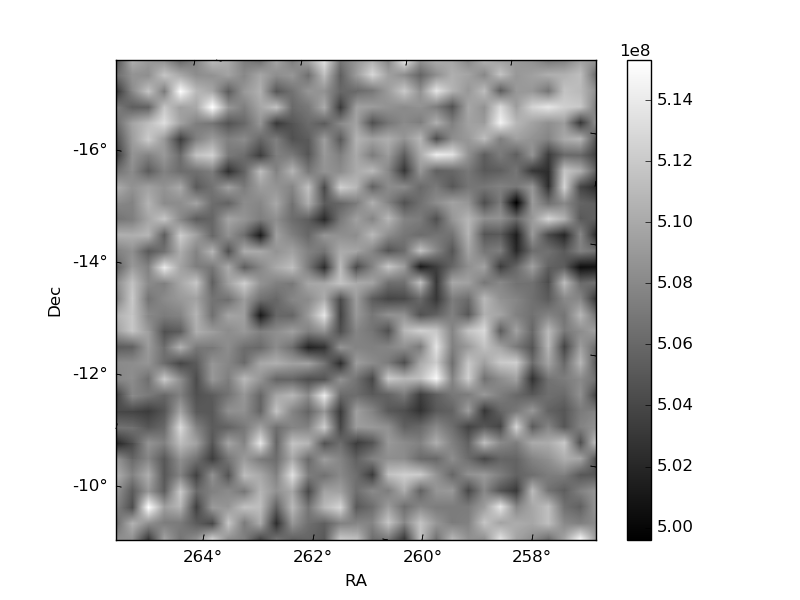
| Quadrant D | 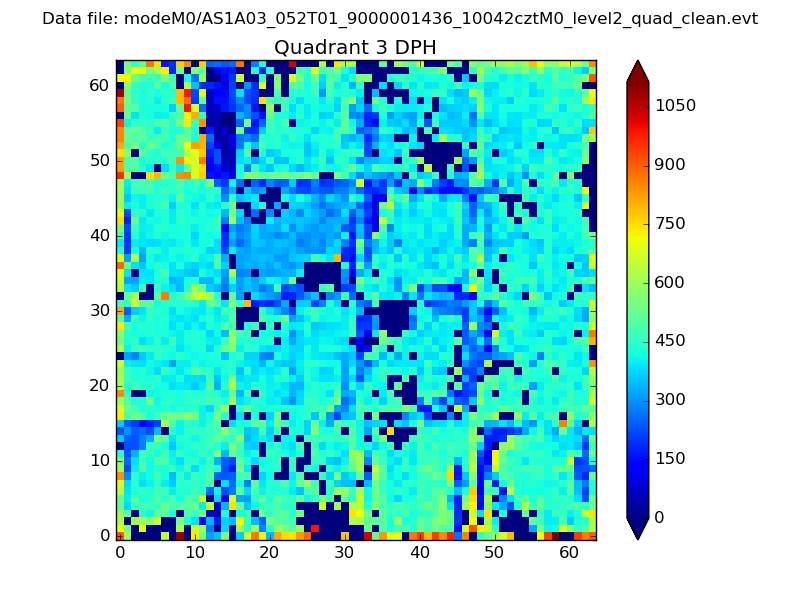 |
 |
Quadrant C |
| Plot type | Count rate plots | Images |
|---|---|---|
| Comparison with Poisson distribution Blue bars denote a histogram of data divided into 1 sec bins. Red curve is a Poisson curve with rate = median count rate of data. |
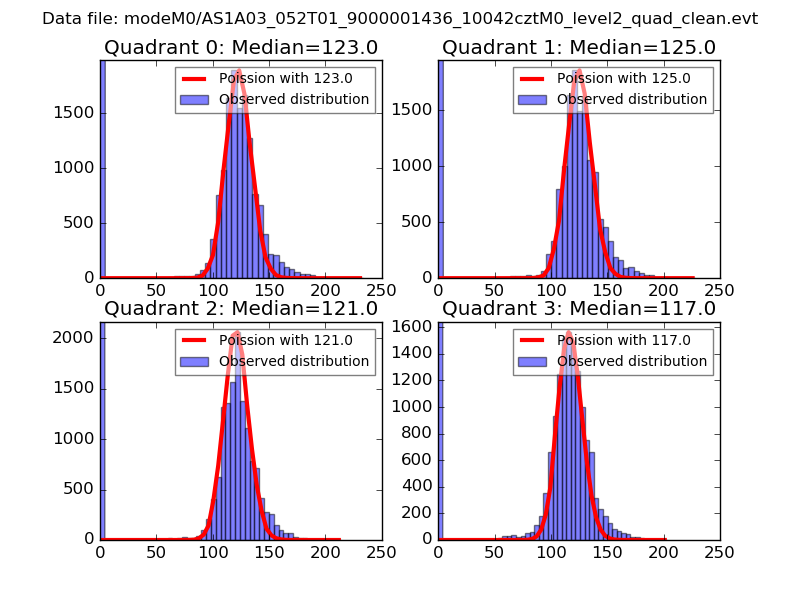 |
 |
| Quadrant-wise count rates Data is divided into 100 sec bins |
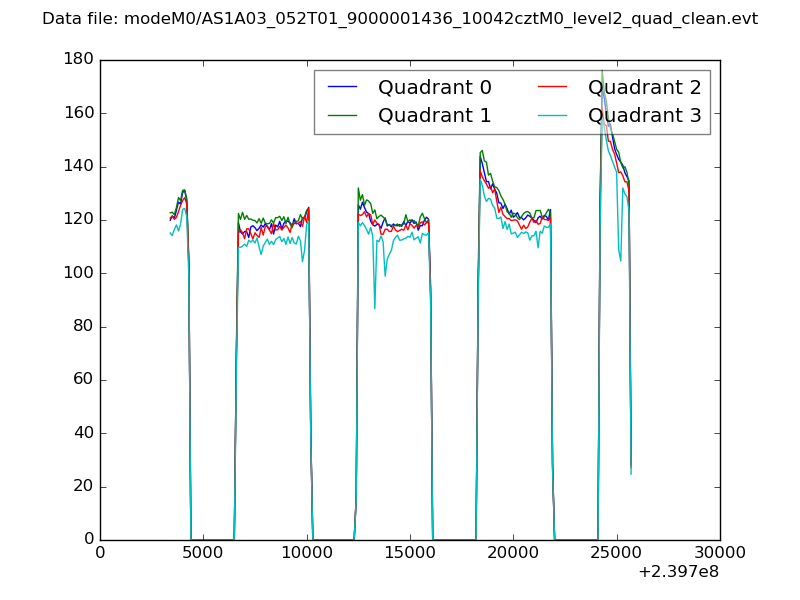 |
|
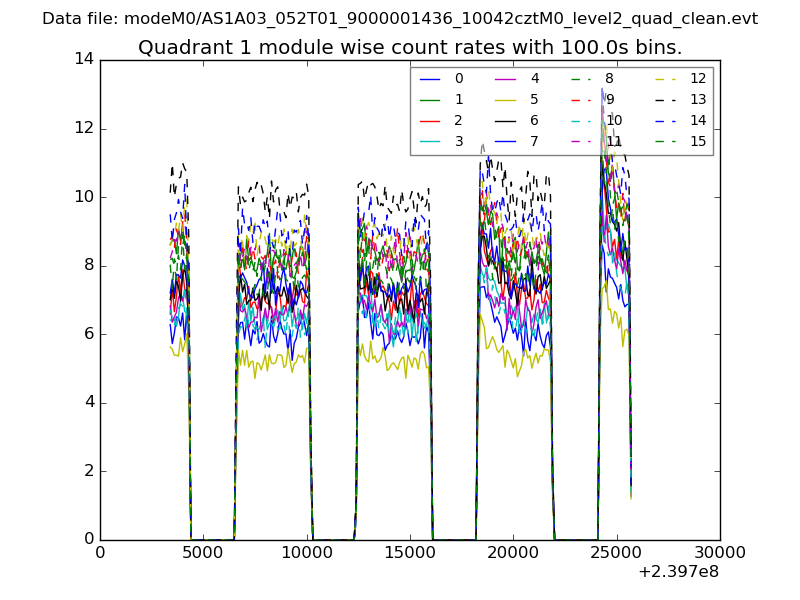
| Module-wise count rates for Quadrant A Data is divided into 100 sec bins |
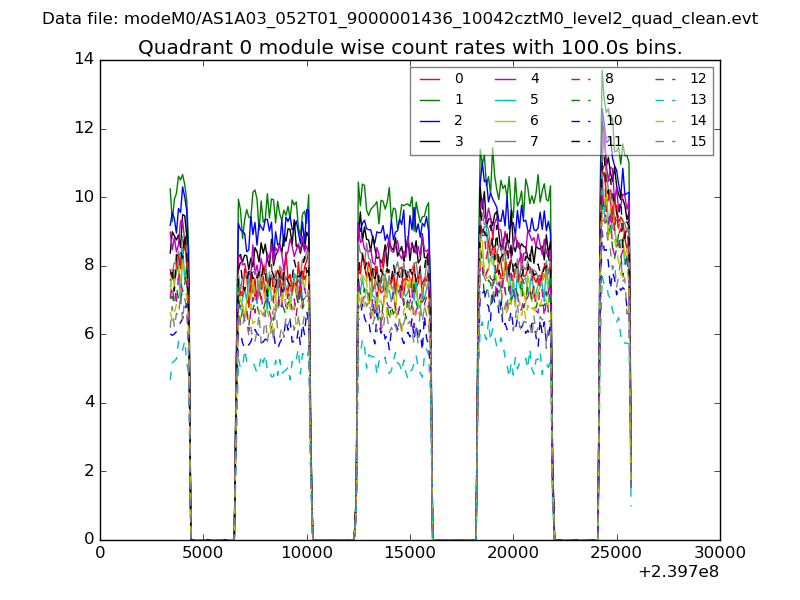 |
 |
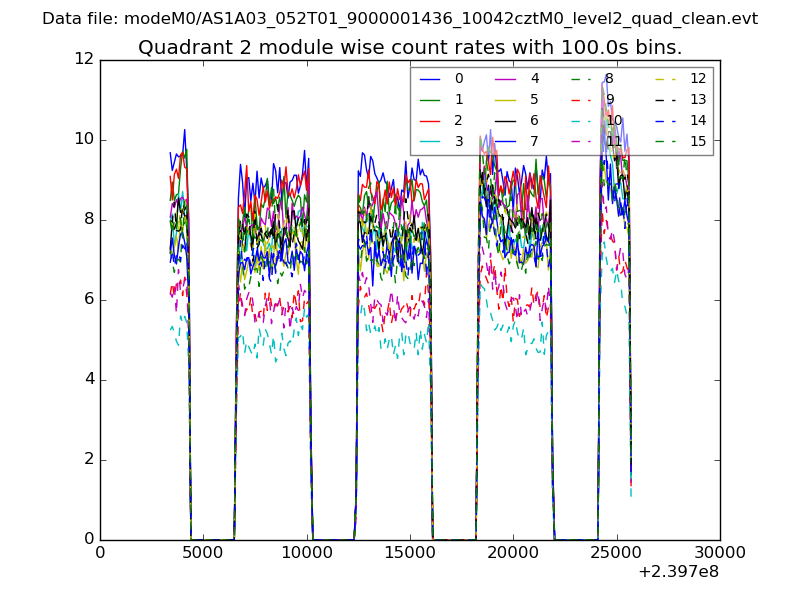
| Module-wise count rates for Quadrant B Data is divided into 100 sec bins |
 |
 |
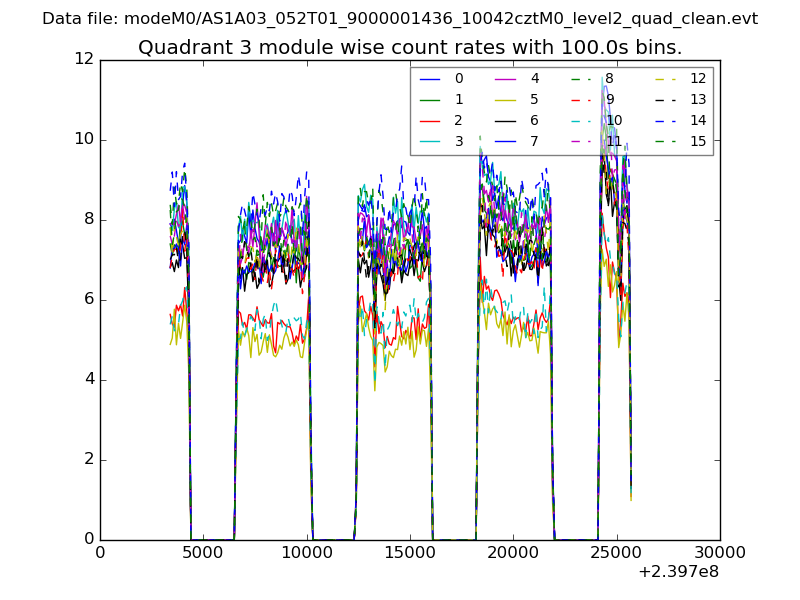
| Module-wise count rates for Quadrant C Data is divided into 100 sec bins |
 |
 |
| Module-wise count rates for Quadrant D Data is divided into 100 sec bins |
 |
 |
| Parameter | Plot |
|---|---|
| CZT HV Monitor | 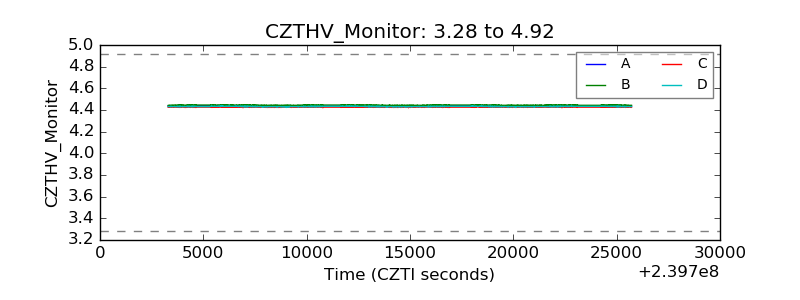 |
| D_VDD | 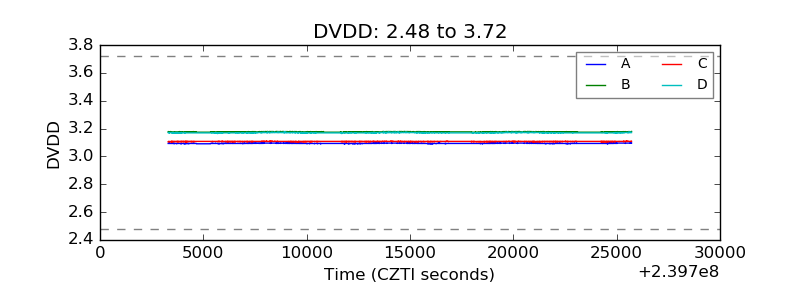 |
| Temperature 1 | 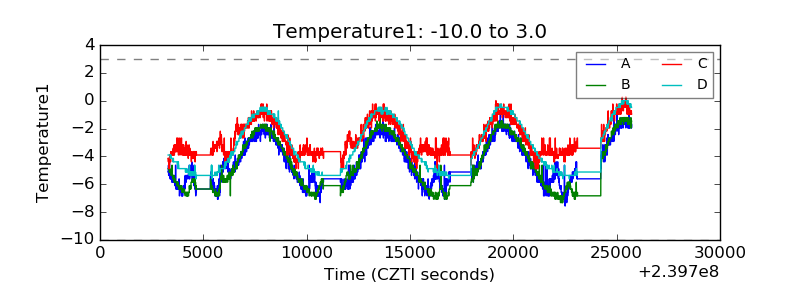 |
| Veto HV Monitor | 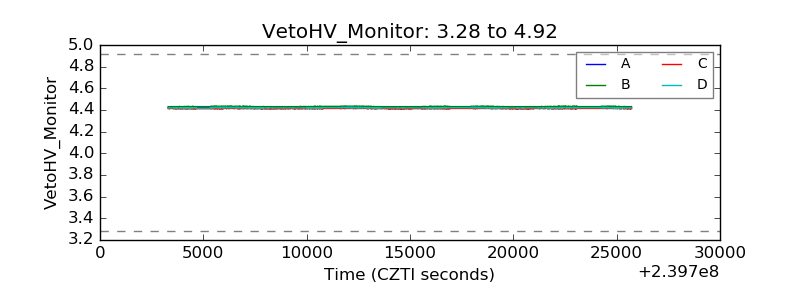 |
| Veto LLD | 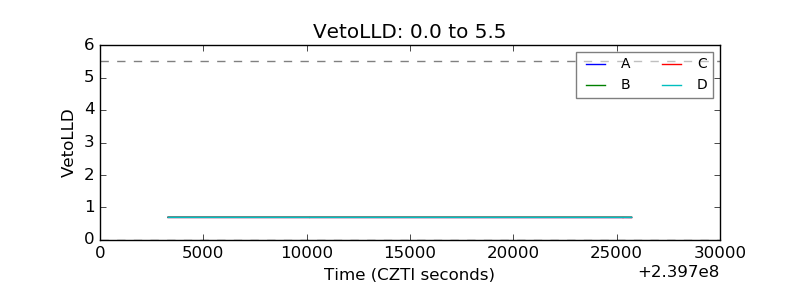 |
| Alpha Counter | 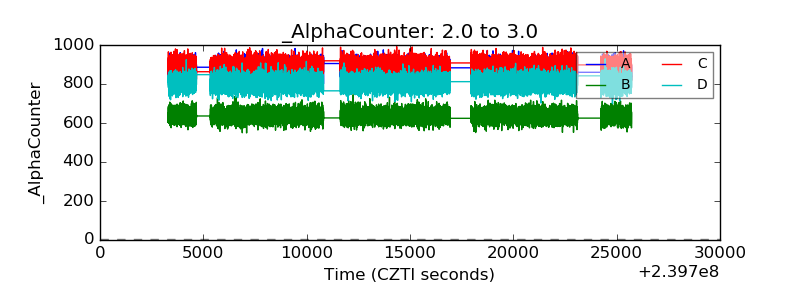 |
| _CPM_Rate | 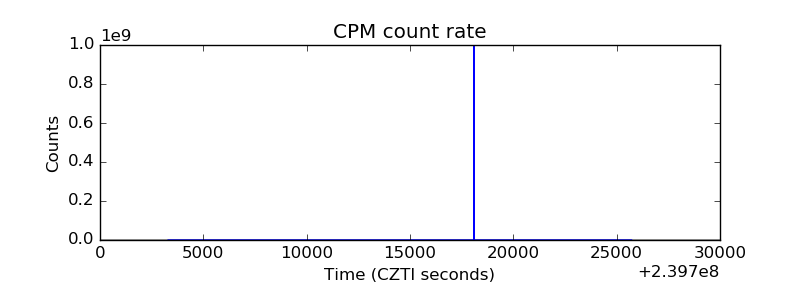 |
| CZT Counter | 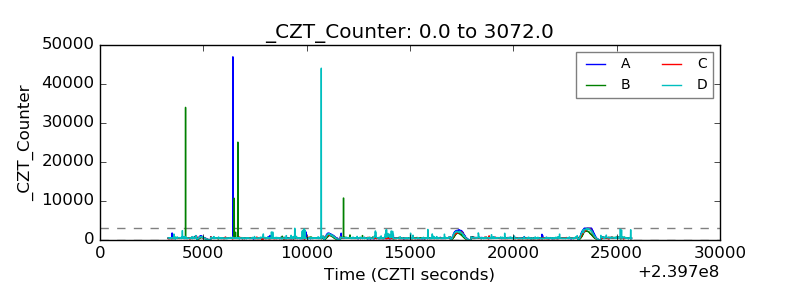 |
| +2.5 Volts monitor | 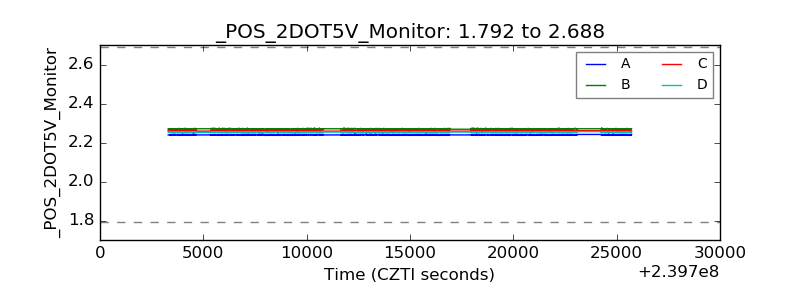 |
| +5 Volts monitor | 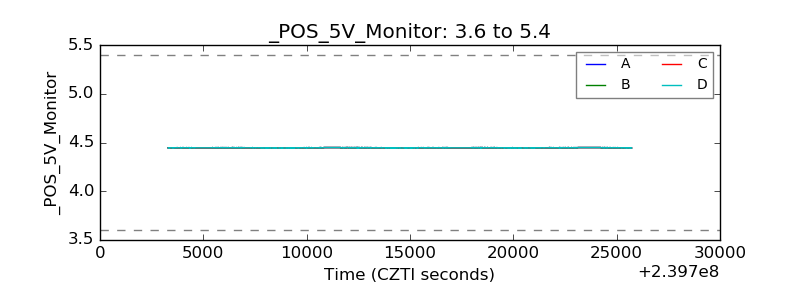 |
| _ROLL_ROT | 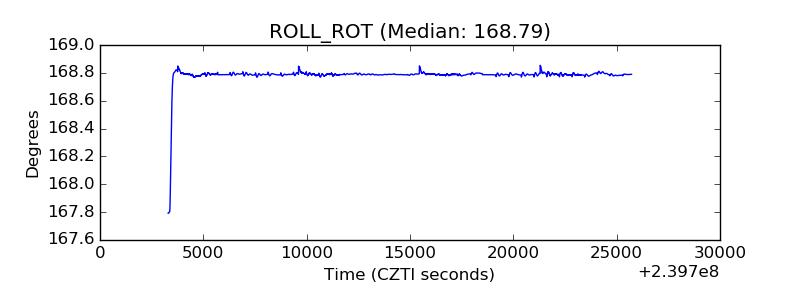 |
| _Roll_DEC |  |
| _Roll_RA | 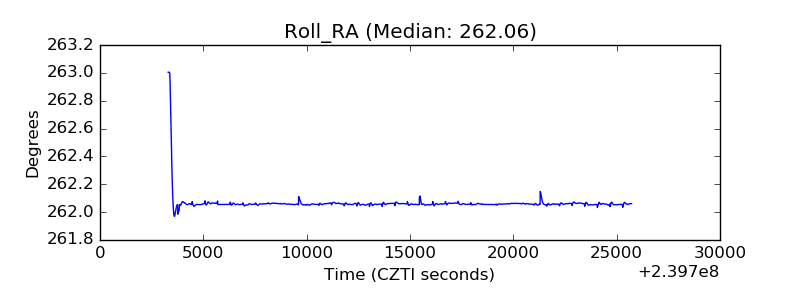 |
| Veto Counter | 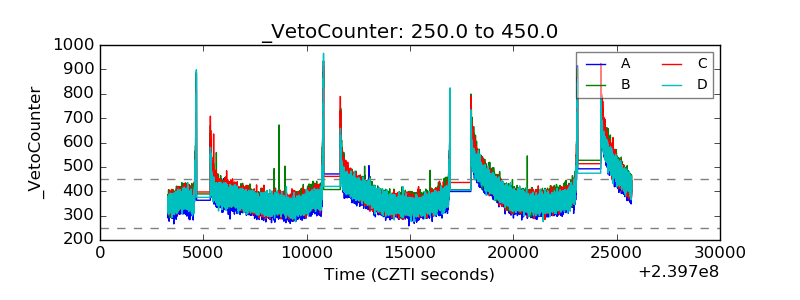 |