| Param | Original file | Final file |
|---|---|---|
| Filename | modeM0/AS1A03_052T01_9000001436_10043cztM0_level2.evt | modeM0/AS1A03_052T01_9000001436_10043cztM0_level2_quad_clean.evt |
| Size (bytes) | 445,216,320 | 97,119,360 |
| Size | 424.6 MB | 92.6 MB |
| Events in quadrant A | 3,203,282 | 642,990 |
| Events in quadrant B | 3,235,704 | 646,048 |
| Events in quadrant C | 2,890,078 | 627,070 |
| Events in quadrant D | 3,736,935 | 596,168 |
| Mode SS | |||
|---|---|---|---|
| Quadrant | BADHDUFLAG | Total packets | Discarded packets |
| A | 0 | 124 | 0 |
| B | 0 | 124 | 0 |
| C | 0 | 124 | 0 |
| D | 0 | 124 | 0 |
| Mode M9 | |||
|---|---|---|---|
| Quadrant | BADHDUFLAG | Total packets | Discarded packets |
| A | 0 | 12 | 0 |
| B | 0 | 12 | 0 |
| C | 0 | 12 | 0 |
| D | 0 | 12 | 0 |
| Mode M0 | |||
|---|---|---|---|
| Quadrant | BADHDUFLAG | Total packets | Discarded packets |
| A | 0 | 13877 | 2 |
| B | 0 | 13674 | 1 |
| C | 0 | 12721 | 1 |
| D | 0 | 15031 | 1 |
| Quadrant | Total seconds | Saturated seconds | Saturation percentage |
|---|---|---|---|
| A | 6146 | 87 | 1.415555% |
| B | 6146 | 77 | 1.252847% |
| C | 6146 | 57 | 0.927432% |
| D | 6146 | 218 | 3.547022% |
Noise dominated data is calculated using 1-second bins in cleaned event files. If a bin has >2000 counts, and if more than 50% of those come from <1% of pixels, then it is considered to be noise-dominated and hence unusable.
| Quadrant | # 1 sec bins | Bins with >0 counts | Bins with >2000 counts | High rate bins dominated by noise | Noise dominated (total time) | Noise dominated (detector-on time) | Marked lightcurve |
|---|---|---|---|---|---|---|---|
| A | 7336 | 6146 | 0 | 0 | 0.00% | 0.00% | 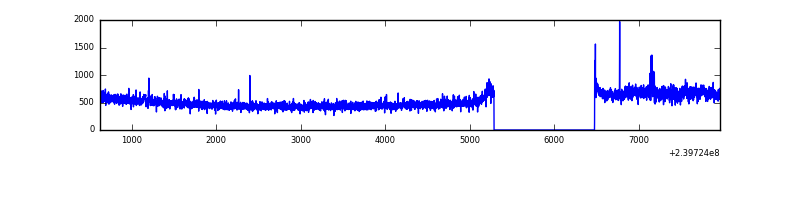 |
| B | 7336 | 6146 | 2 | 2 | 0.03% | 0.03% | 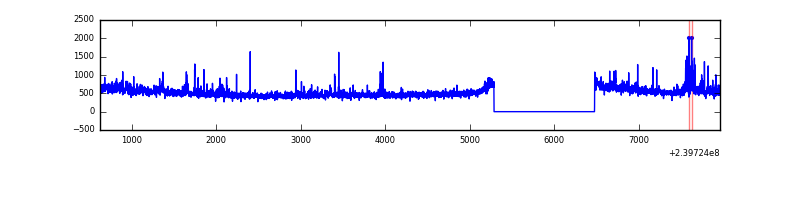 |
| C | 7336 | 6146 | 0 | 0 | 0.00% | 0.00% | 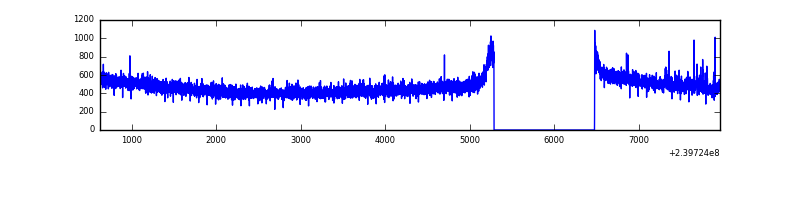 |
| D | 7336 | 6146 | 137 | 137 | 1.87% | 2.23% | 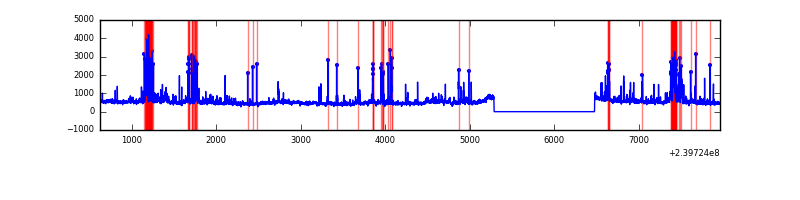 |
Top three noisy pixels from each quadrant. If the there are fewer than three noisy pixels in the level2.evt file, extra rows are filled as -1
| Pixel properties | Quadrant properties | ||||||
|---|---|---|---|---|---|---|---|
| Quadrant | DetID | PixID | Counts | Sigma | Mean | Median | Sigma |
| A | 8 | 15 | 221711 | 1417.16 | 770 | 756 | 155.9 |
| A | 15 | 239 | 11125 | 66.5 | 770 | 756 | 155.9 |
| A | 0 | 226 | 7235 | 41.55 | 770 | 756 | 155.9 |
| B | 4 | 81 | 108370 | 745.11 | 767 | 752 | 144.4 |
| B | 0 | 214 | 53528 | 365.4 | 767 | 752 | 144.4 |
| B | 0 | 187 | 33414 | 226.14 | 767 | 752 | 144.4 |
| C | 14 | 67 | 15558 | 86.78 | 735 | 739 | 170.8 |
| C | 8 | 222 | 5691 | 29.0 | 735 | 739 | 170.8 |
| C | 13 | 61 | 5550 | 28.17 | 735 | 739 | 170.8 |
| D | 9 | 85 | 190833 | 985.3 | 730 | 712 | 193.0 |
| D | 12 | 233 | 187228 | 966.62 | 730 | 712 | 193.0 |
| D | 7 | 71 | 140095 | 722.35 | 730 | 712 | 193.0 |
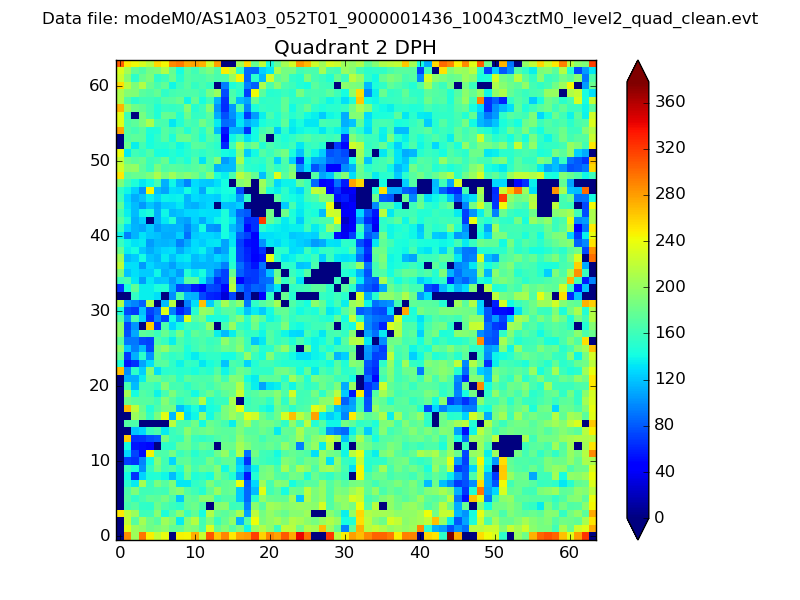
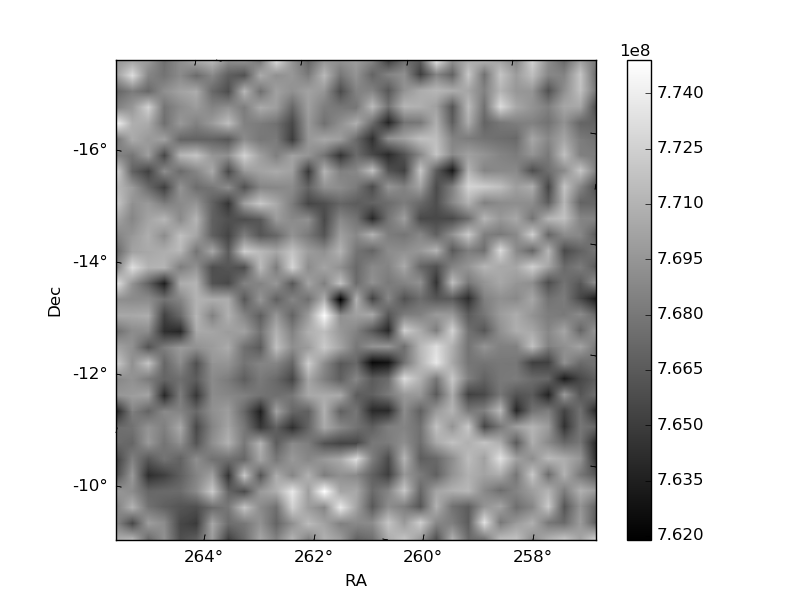
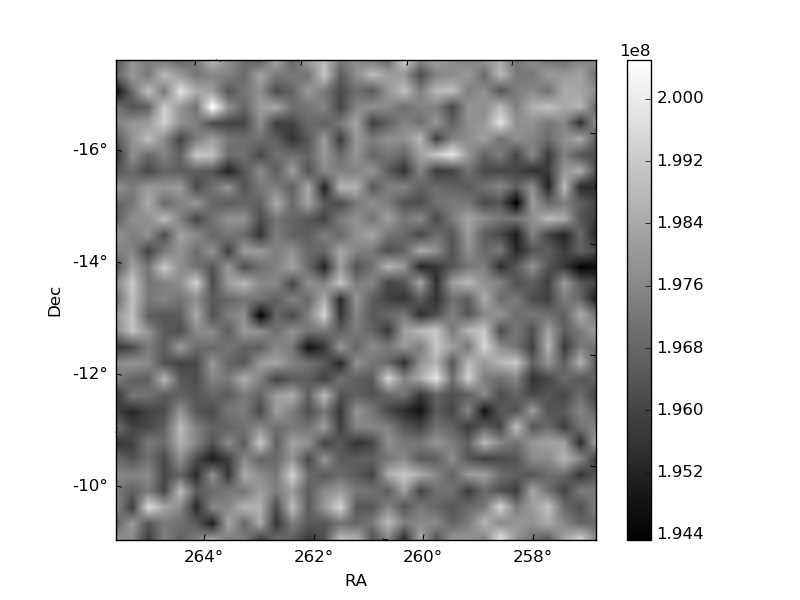
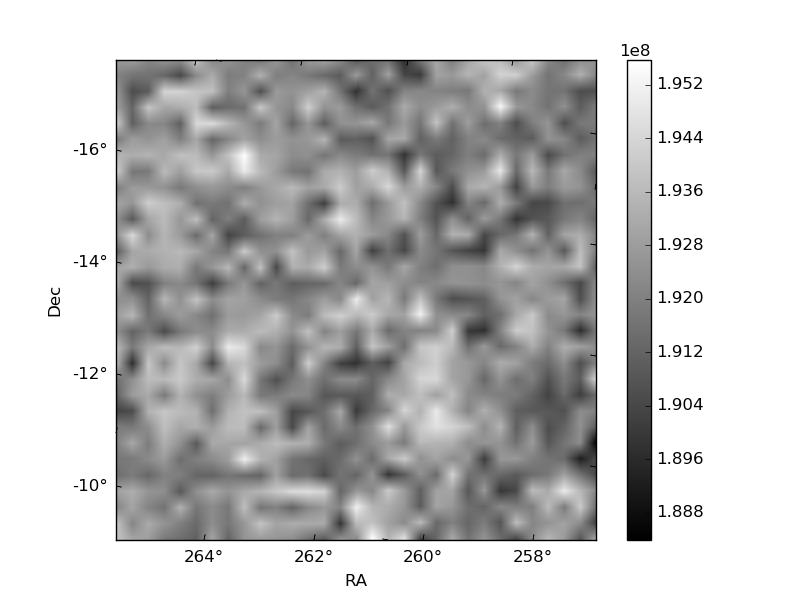
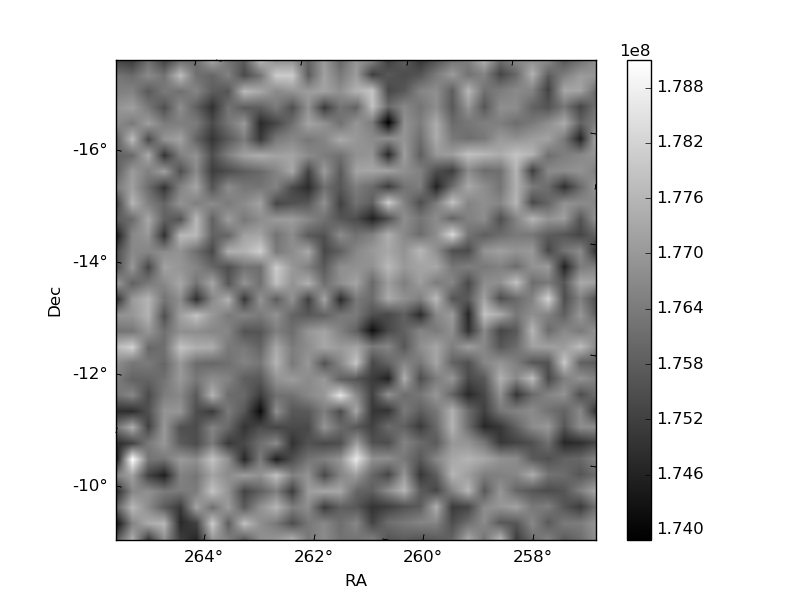
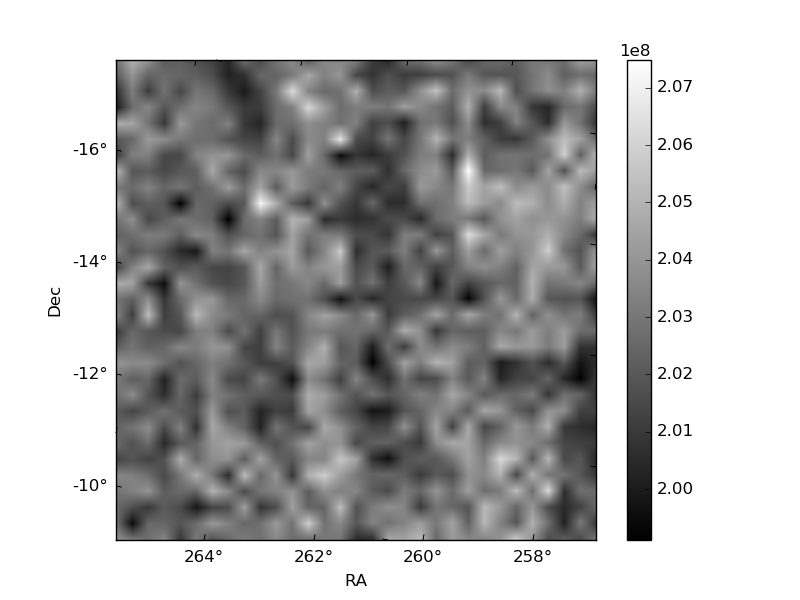
Histogram calculated using DETX and DETY for each event in the final _common_clean file
| Quadrant A | 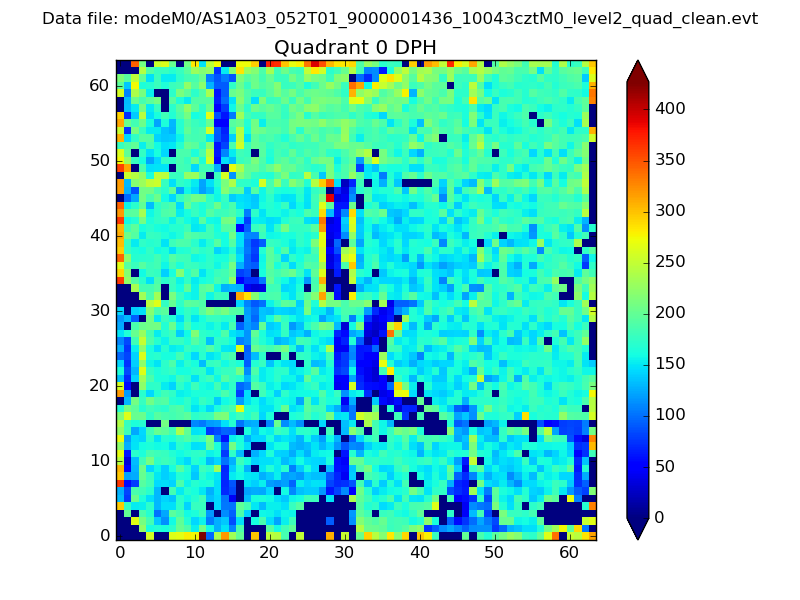 |
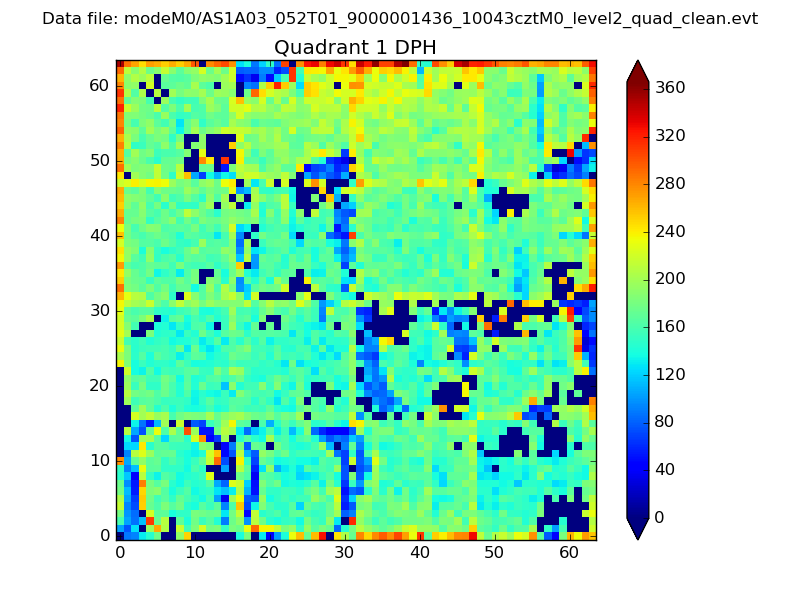 |
Quadrant B |
|---|---|---|---|
| Quadrant D | 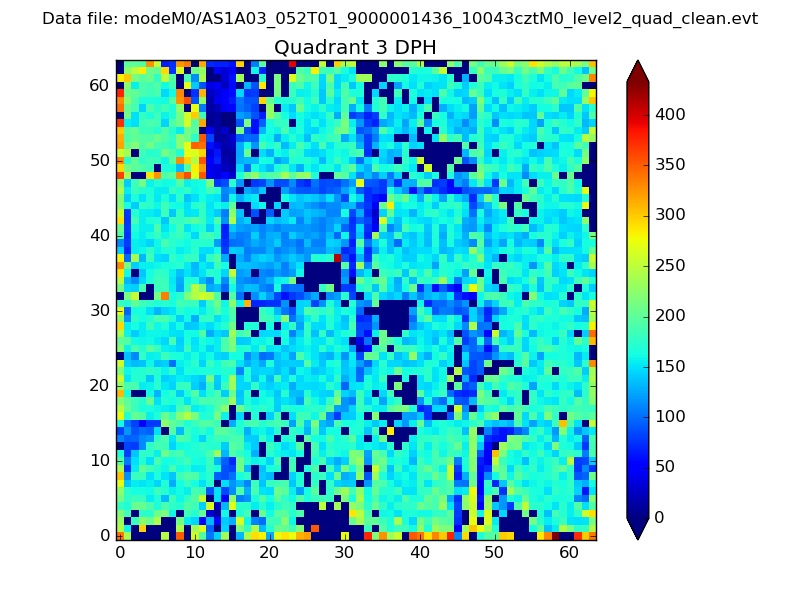 |
 |
Quadrant C |
| Plot type | Count rate plots | Images |
|---|---|---|
| Comparison with Poisson distribution Blue bars denote a histogram of data divided into 1 sec bins. Red curve is a Poisson curve with rate = median count rate of data. |
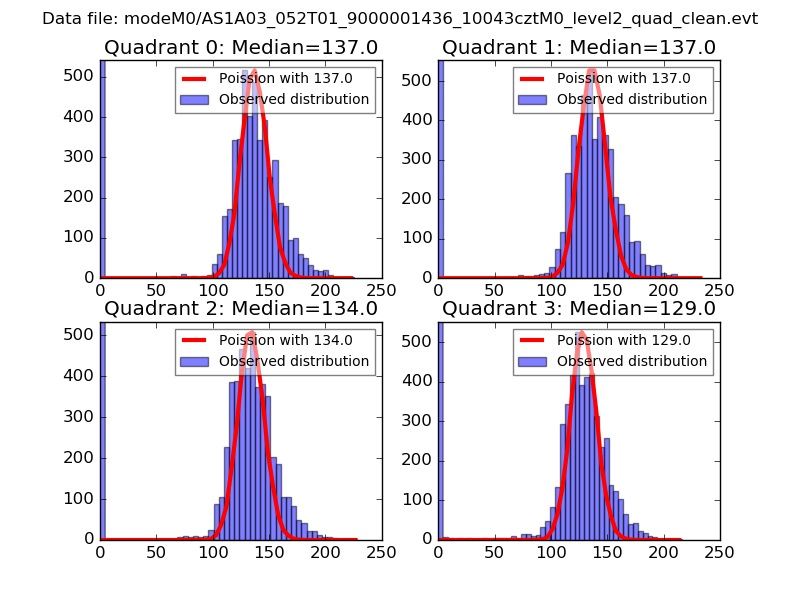 |
 |
| Quadrant-wise count rates Data is divided into 100 sec bins |
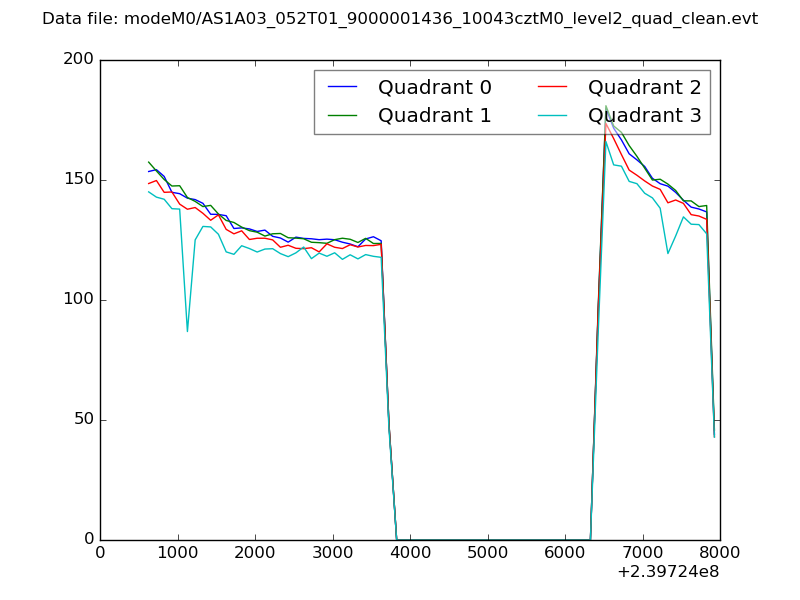 |
|
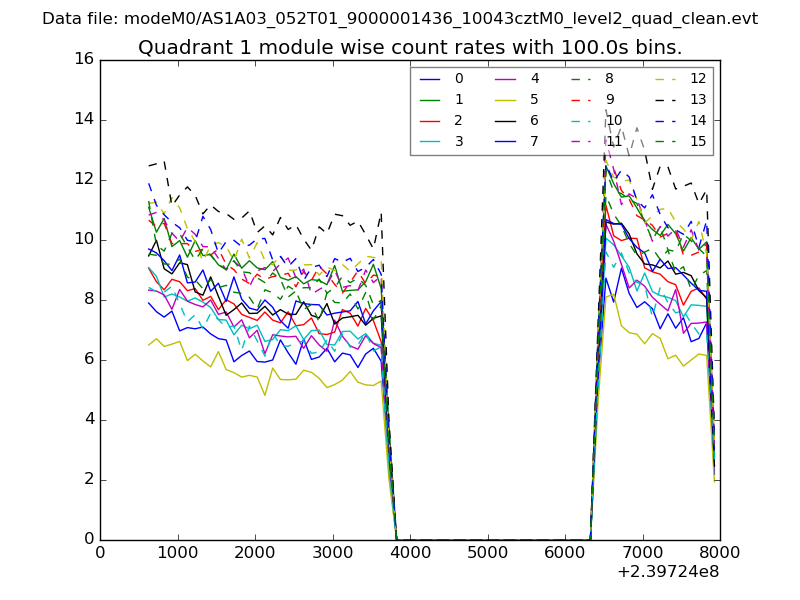
| Module-wise count rates for Quadrant A Data is divided into 100 sec bins |
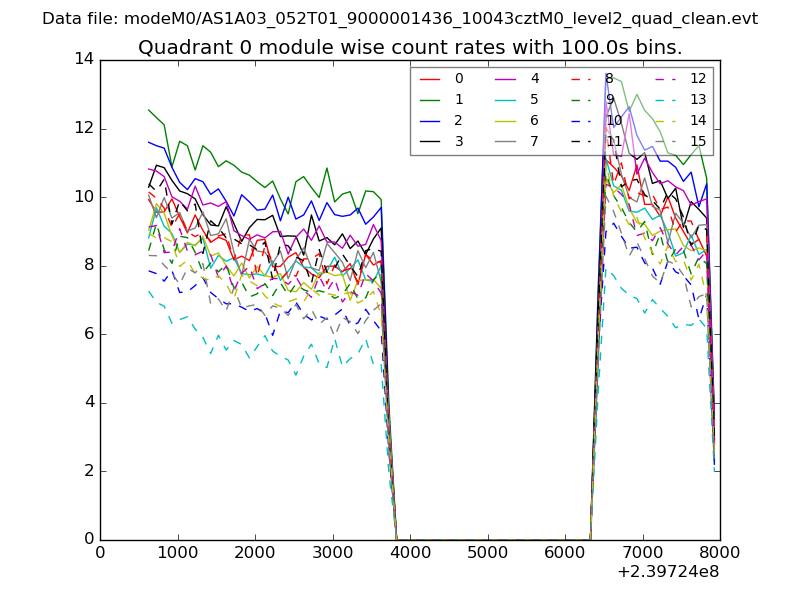 |
 |
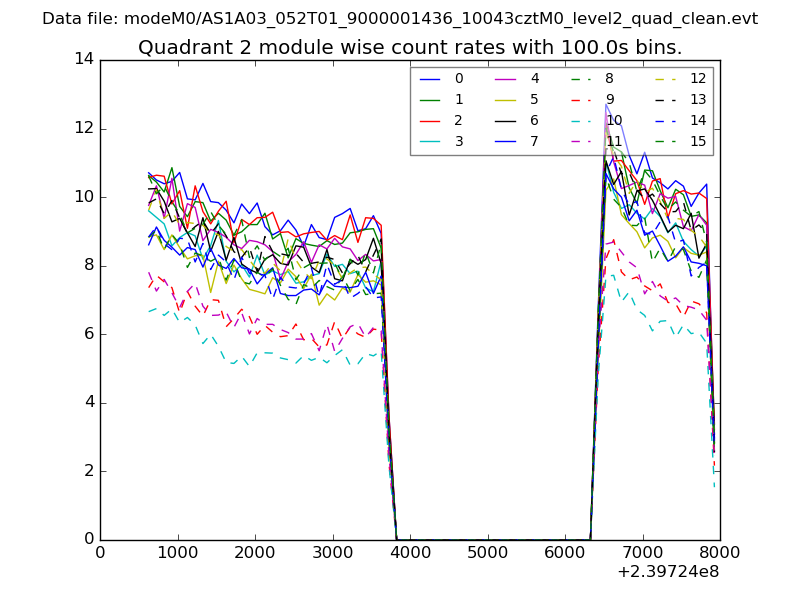
| Module-wise count rates for Quadrant B Data is divided into 100 sec bins |
 |
 |
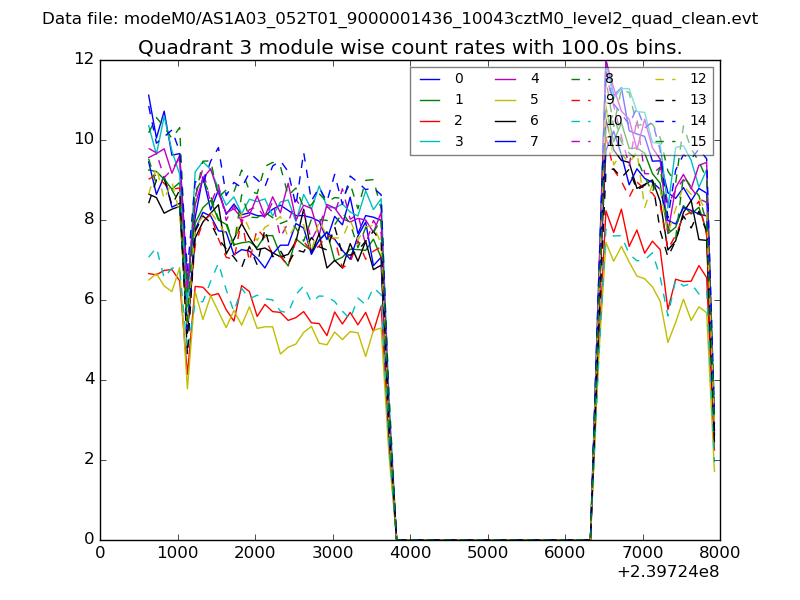
| Module-wise count rates for Quadrant C Data is divided into 100 sec bins |
 |
 |
| Module-wise count rates for Quadrant D Data is divided into 100 sec bins |
 |
 |
| Parameter | Plot |
|---|---|
| CZT HV Monitor |  |
| D_VDD | 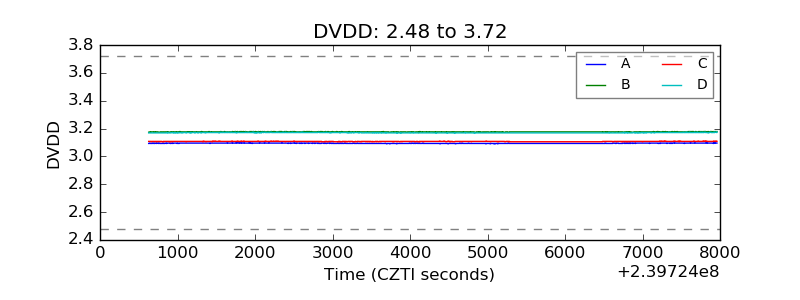 |
| Temperature 1 | 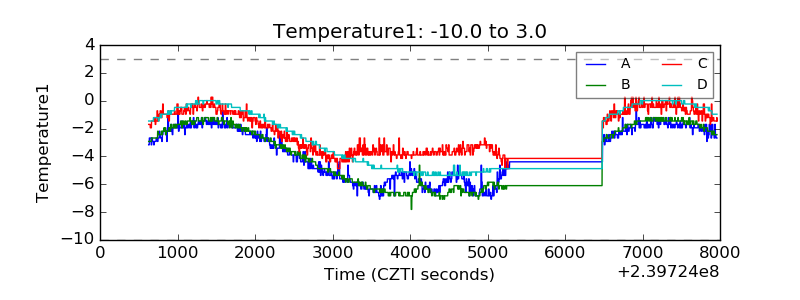 |
| Veto HV Monitor | 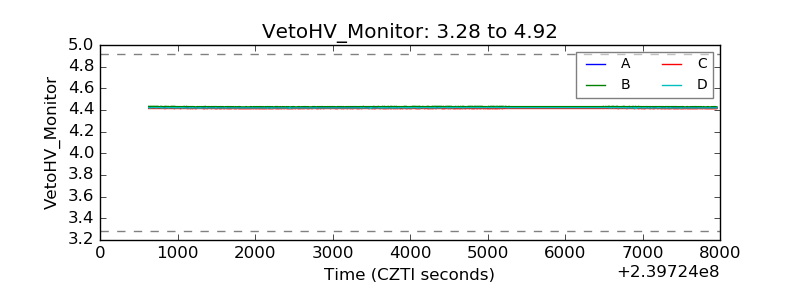 |
| Veto LLD | 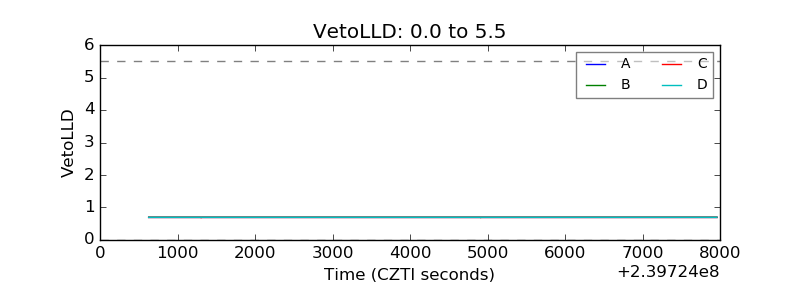 |
| Alpha Counter | 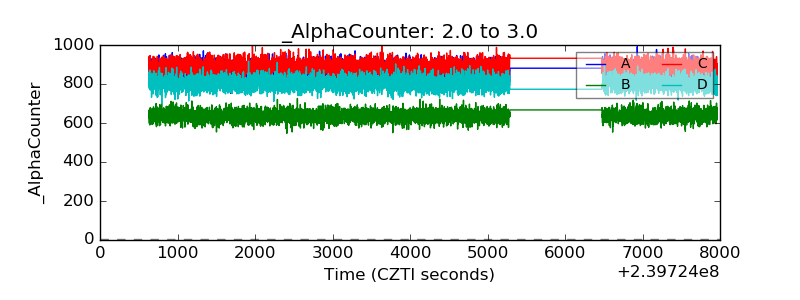 |
| _CPM_Rate | 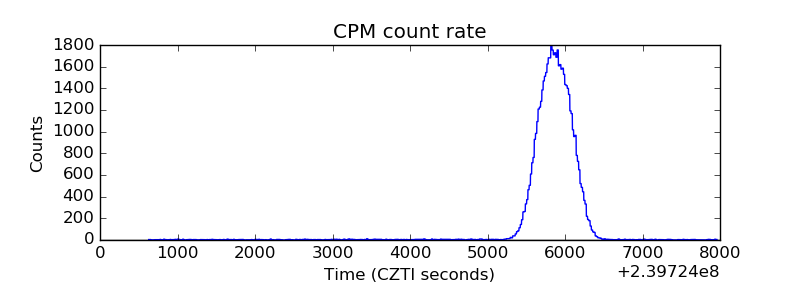 |
| CZT Counter | 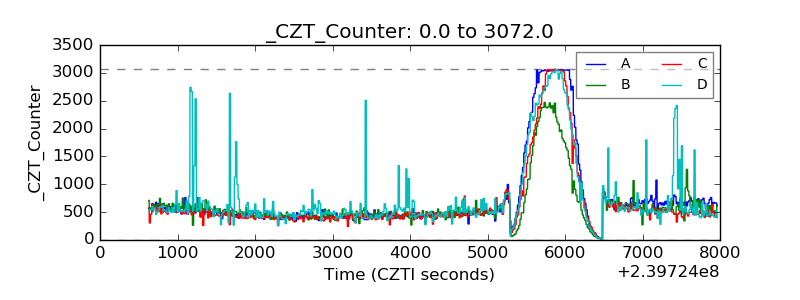 |
| +2.5 Volts monitor |  |
| +5 Volts monitor |  |
| _ROLL_ROT | 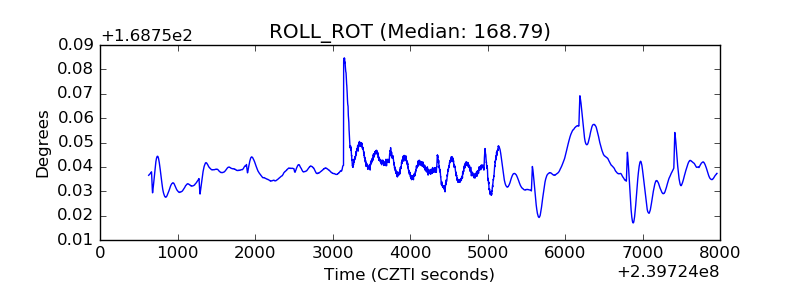 |
| _Roll_DEC | 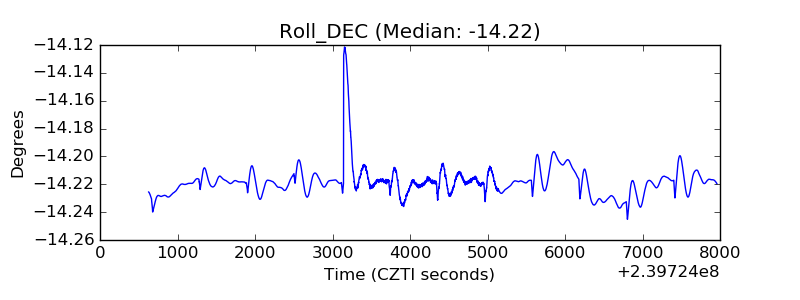 |
| _Roll_RA | 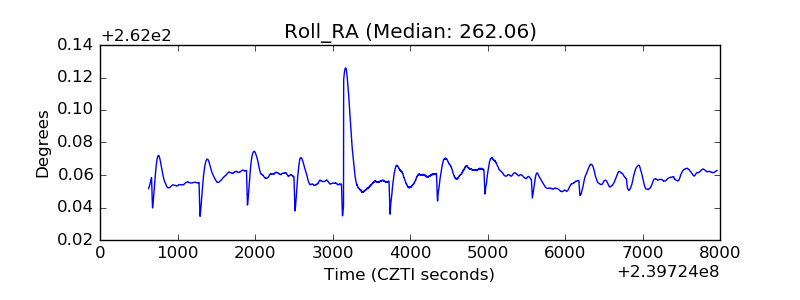 |
| Veto Counter | 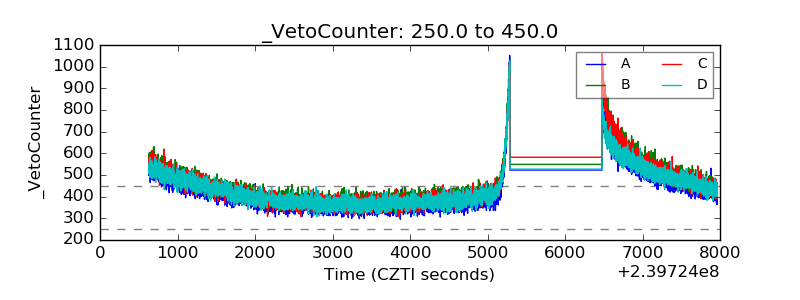 |