| Param | Original file | Final file |
|---|---|---|
| Filename | modeM0/AS1A03_052T01_9000001436_10044cztM0_level2.evt | modeM0/AS1A03_052T01_9000001436_10044cztM0_level2_quad_clean.evt |
| Size (bytes) | 493,799,040 | 101,615,040 |
| Size | 470.9 MB | 96.9 MB |
| Events in quadrant A | 3,869,416 | 668,976 |
| Events in quadrant B | 3,710,683 | 675,899 |
| Events in quadrant C | 3,158,526 | 653,609 |
| Events in quadrant D | 3,773,516 | 624,230 |
| Mode SS | |||
|---|---|---|---|
| Quadrant | BADHDUFLAG | Total packets | Discarded packets |
| A | 0 | 132 | 0 |
| B | 0 | 132 | 0 |
| C | 0 | 132 | 0 |
| D | 0 | 132 | 0 |
| Mode M9 | |||
|---|---|---|---|
| Quadrant | BADHDUFLAG | Total packets | Discarded packets |
| A | 0 | 14 | 0 |
| B | 0 | 14 | 0 |
| C | 0 | 14 | 0 |
| D | 0 | 15 | 0 |
| Mode M0 | |||
|---|---|---|---|
| Quadrant | BADHDUFLAG | Total packets | Discarded packets |
| A | 0 | 16005 | 3 |
| B | 0 | 15207 | 2 |
| C | 0 | 13704 | 2 |
| D | 0 | 15399 | 2 |
| Quadrant | Total seconds | Saturated seconds | Saturation percentage |
|---|---|---|---|
| A | 6522 | 105 | 1.609936% |
| B | 6522 | 124 | 1.901257% |
| C | 6522 | 66 | 1.011960% |
| D | 6522 | 143 | 2.192579% |
Noise dominated data is calculated using 1-second bins in cleaned event files. If a bin has >2000 counts, and if more than 50% of those come from <1% of pixels, then it is considered to be noise-dominated and hence unusable.
| Quadrant | # 1 sec bins | Bins with >0 counts | Bins with >2000 counts | High rate bins dominated by noise | Noise dominated (total time) | Noise dominated (detector-on time) | Marked lightcurve |
|---|---|---|---|---|---|---|---|
| A | 7782 | 6522 | 0 | 0 | 0.00% | 0.00% | 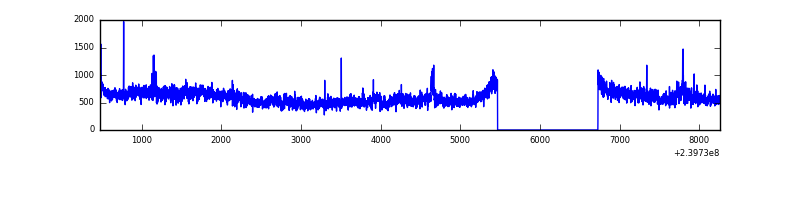 |
| B | 7782 | 6522 | 32 | 32 | 0.41% | 0.49% | 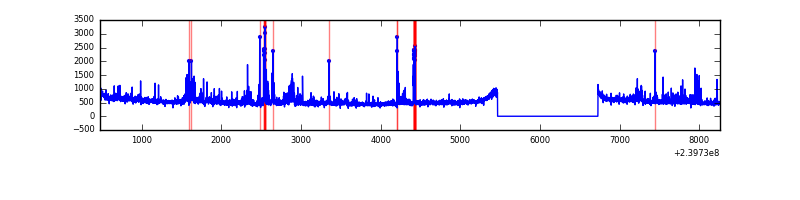 |
| C | 7782 | 6522 | 0 | 0 | 0.00% | 0.00% | 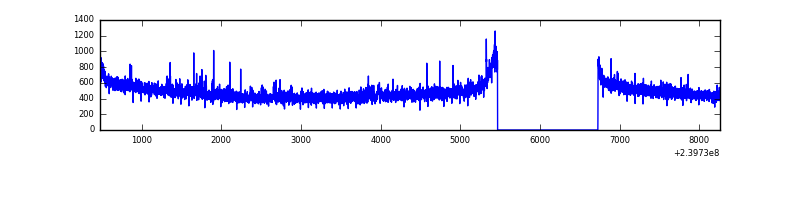 |
| D | 7782 | 6522 | 65 | 65 | 0.84% | 1.00% | 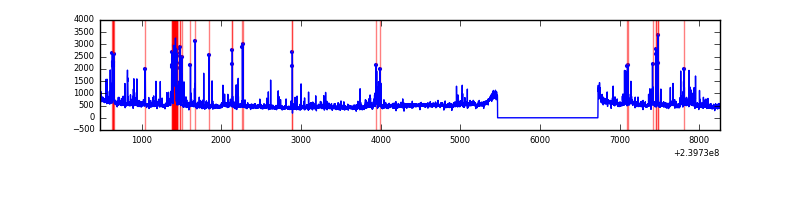 |
Top three noisy pixels from each quadrant. If the there are fewer than three noisy pixels in the level2.evt file, extra rows are filled as -1
| Pixel properties | Quadrant properties | ||||||
|---|---|---|---|---|---|---|---|
| Quadrant | DetID | PixID | Counts | Sigma | Mean | Median | Sigma |
| A | 8 | 15 | 606680 | 3594.84 | 836 | 821 | 168.5 |
| A | 15 | 239 | 23722 | 135.88 | 836 | 821 | 168.5 |
| A | 15 | 174 | 13896 | 77.58 | 836 | 821 | 168.5 |
| B | 4 | 81 | 310131 | 1967.51 | 833 | 815 | 157.2 |
| B | 10 | 247 | 59550 | 373.6 | 833 | 815 | 157.2 |
| B | 0 | 214 | 32534 | 201.76 | 833 | 815 | 157.2 |
| C | 14 | 67 | 41553 | 219.62 | 798 | 803 | 185.5 |
| C | 13 | 61 | 6119 | 28.65 | 798 | 803 | 185.5 |
| C | 8 | 222 | 4811 | 21.6 | 798 | 803 | 185.5 |
| D | 12 | 233 | 199925 | 922.66 | 795 | 778 | 215.8 |
| D | 7 | 71 | 157969 | 728.28 | 795 | 778 | 215.8 |
| D | 8 | 195 | 148620 | 684.96 | 795 | 778 | 215.8 |
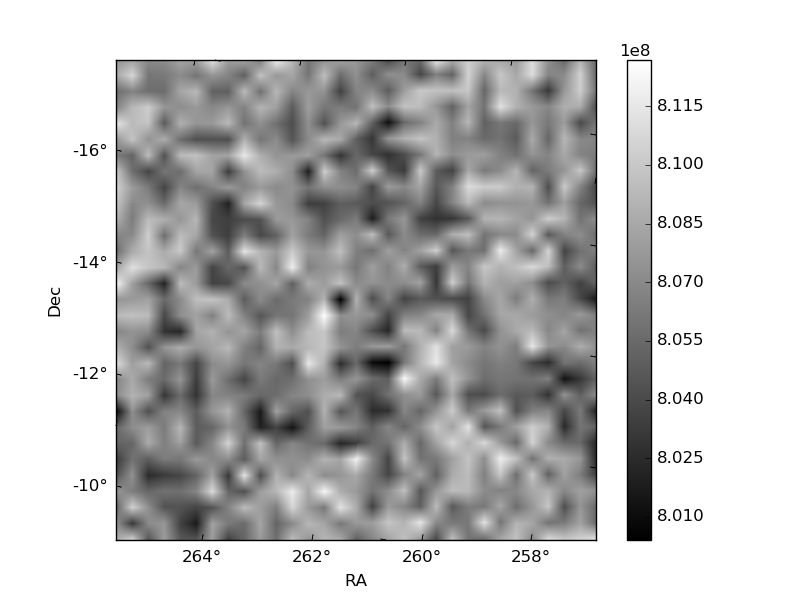
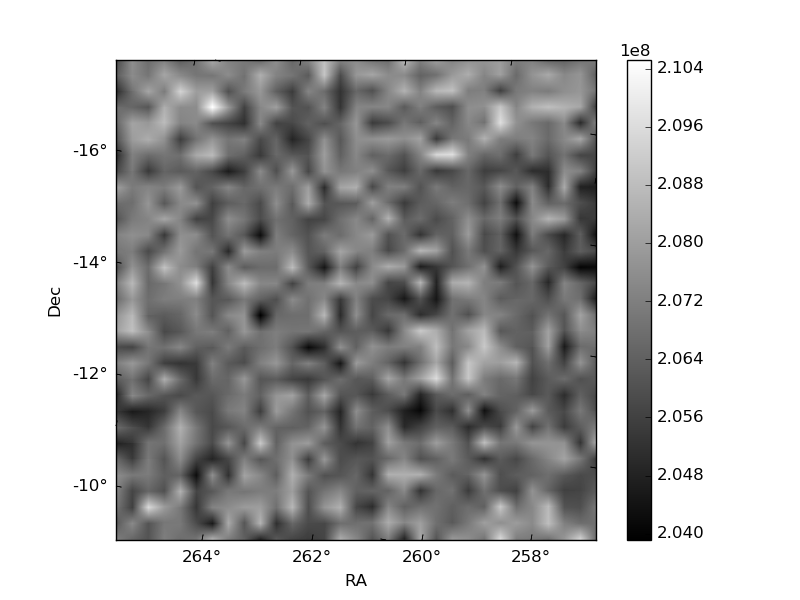
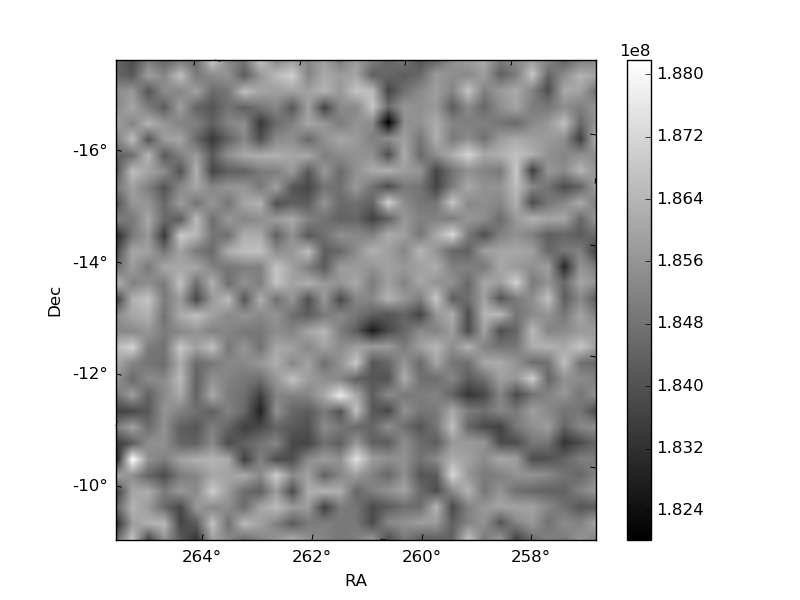
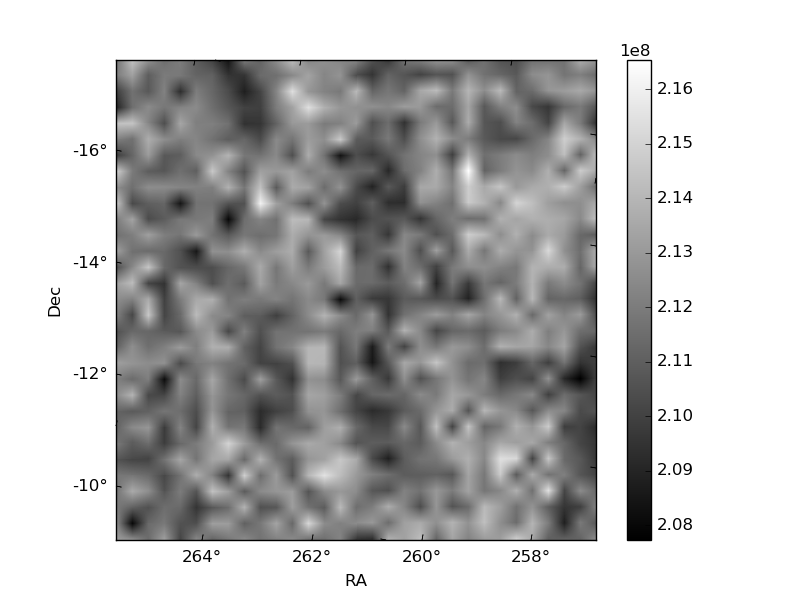
Histogram calculated using DETX and DETY for each event in the final _common_clean file
| Quadrant A | 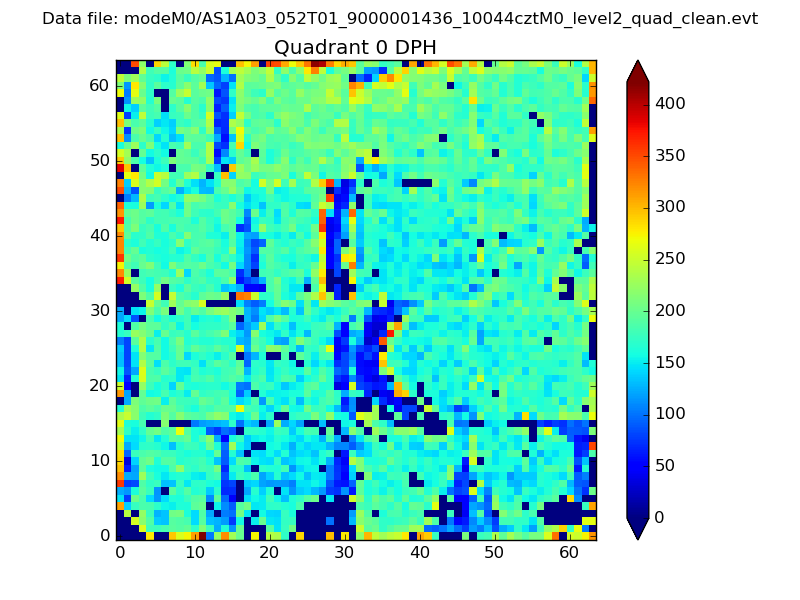 |
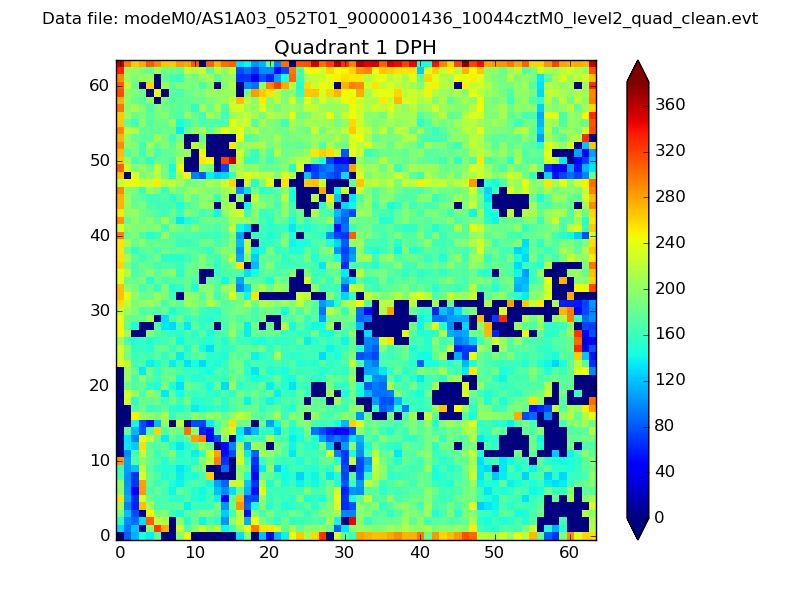 |
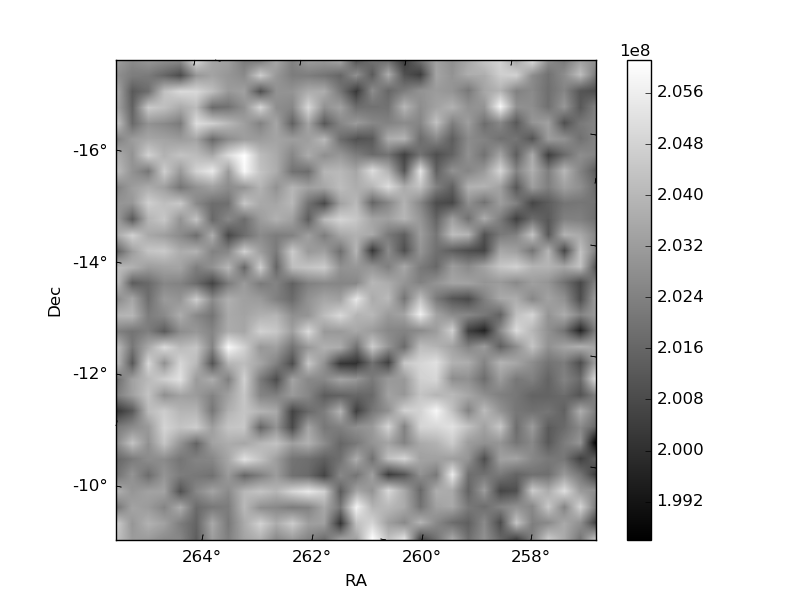
Quadrant B |
|---|---|---|---|
| Quadrant D | 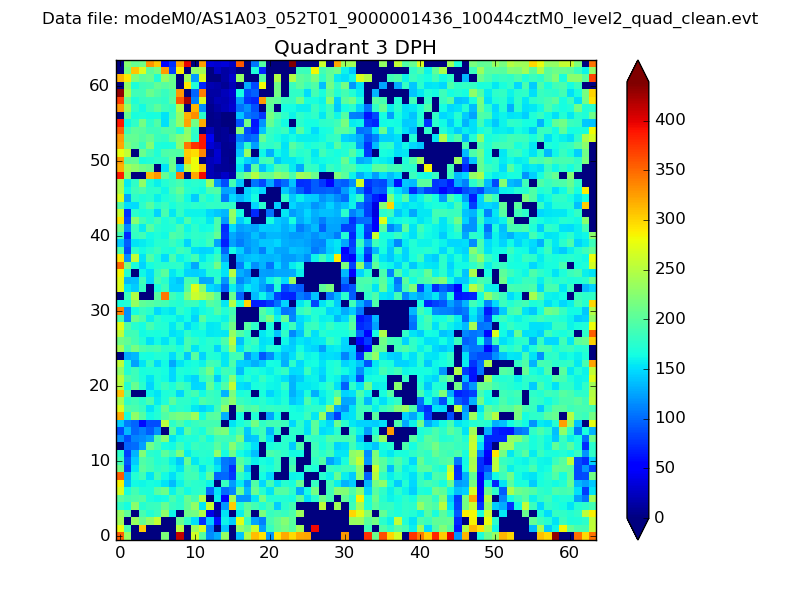 |
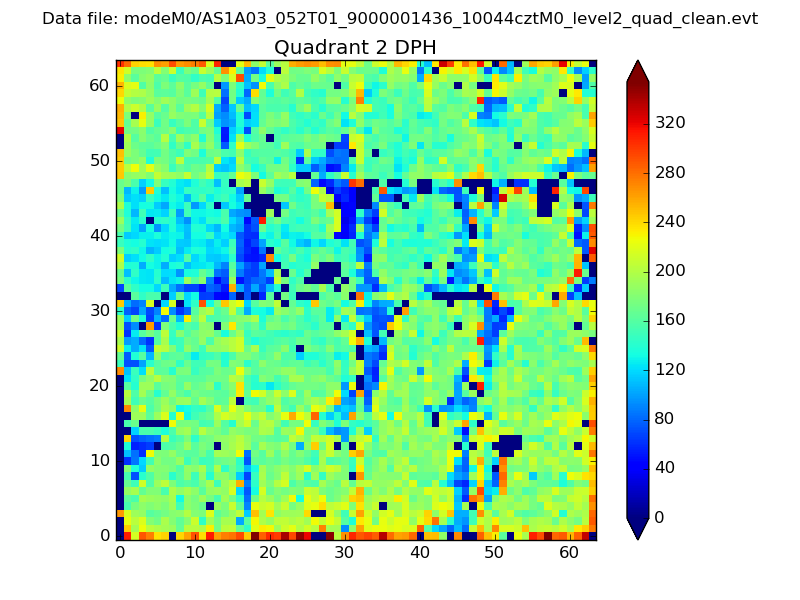 |
Quadrant C |
| Plot type | Count rate plots | Images |
|---|---|---|
| Comparison with Poisson distribution Blue bars denote a histogram of data divided into 1 sec bins. Red curve is a Poisson curve with rate = median count rate of data. |
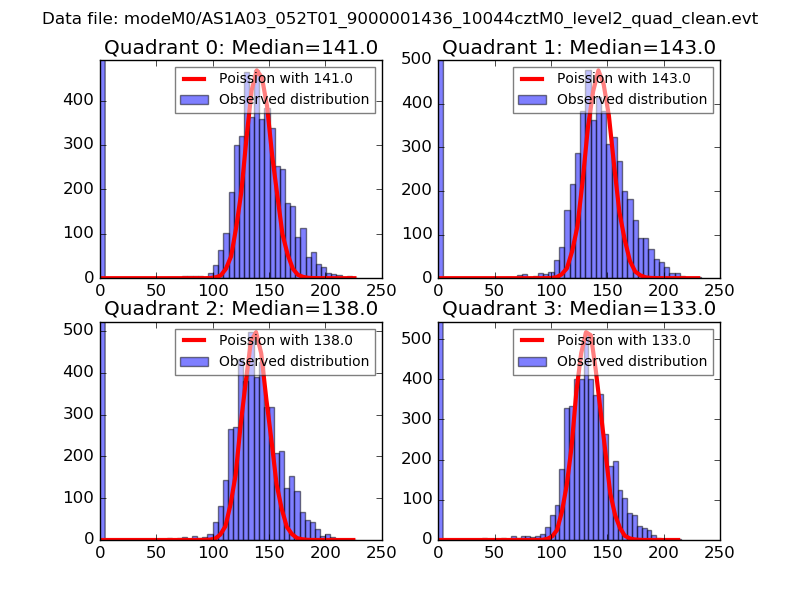 |
 |
| Quadrant-wise count rates Data is divided into 100 sec bins |
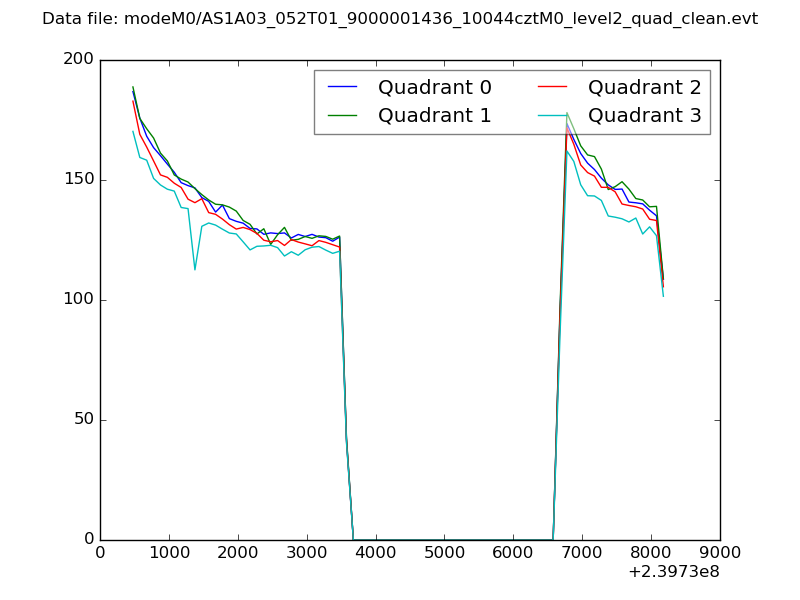 |
|
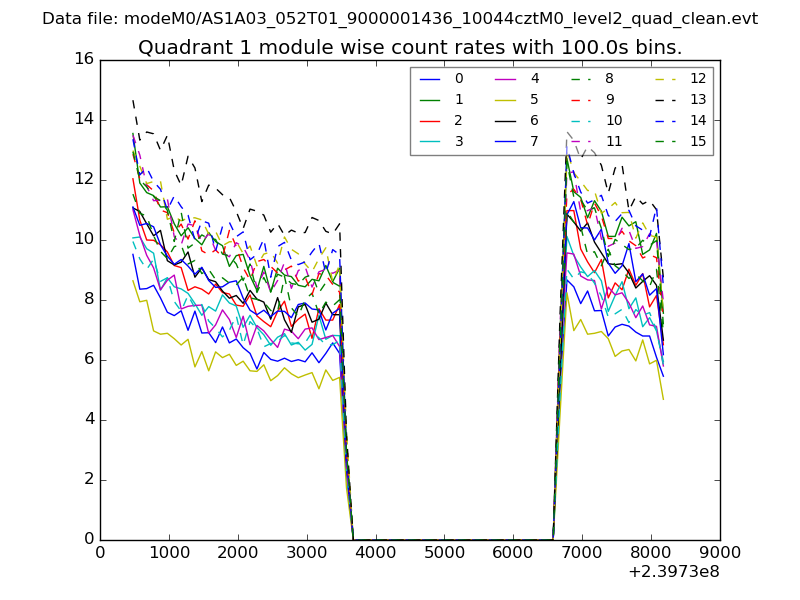
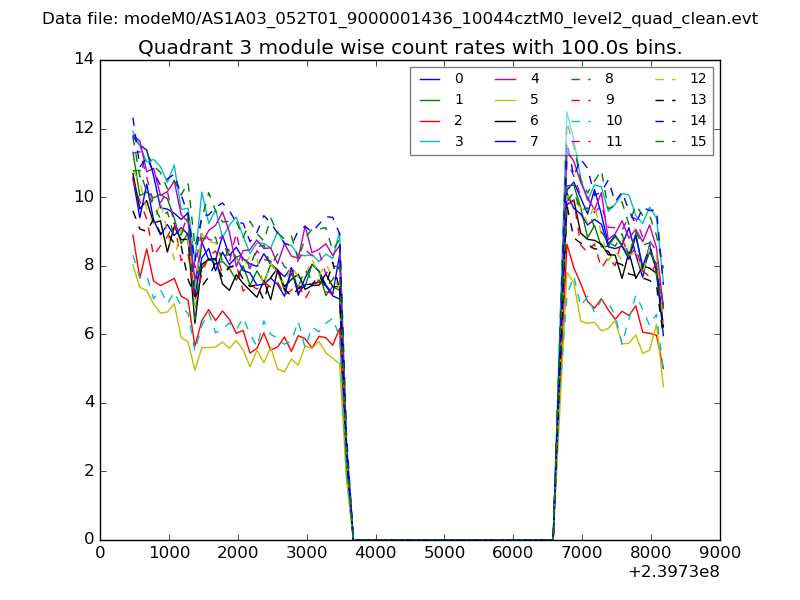
| Module-wise count rates for Quadrant A Data is divided into 100 sec bins |
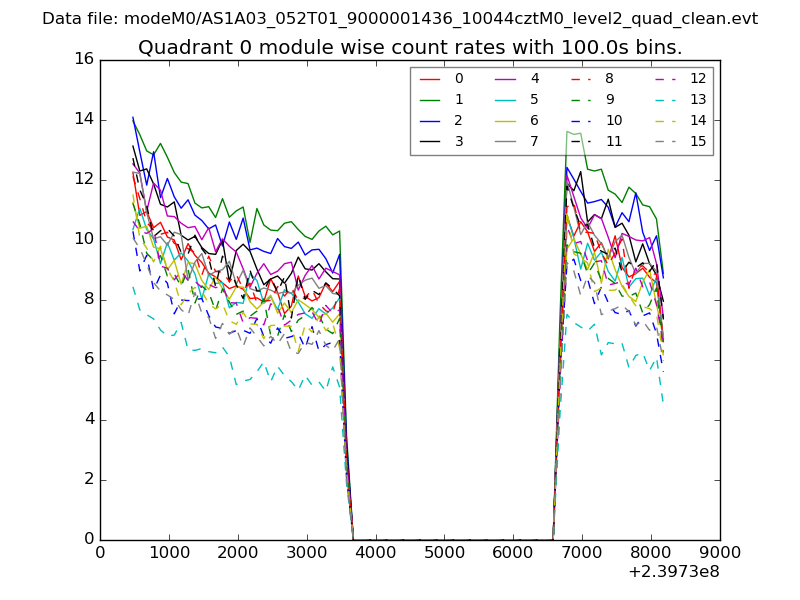 |
 |
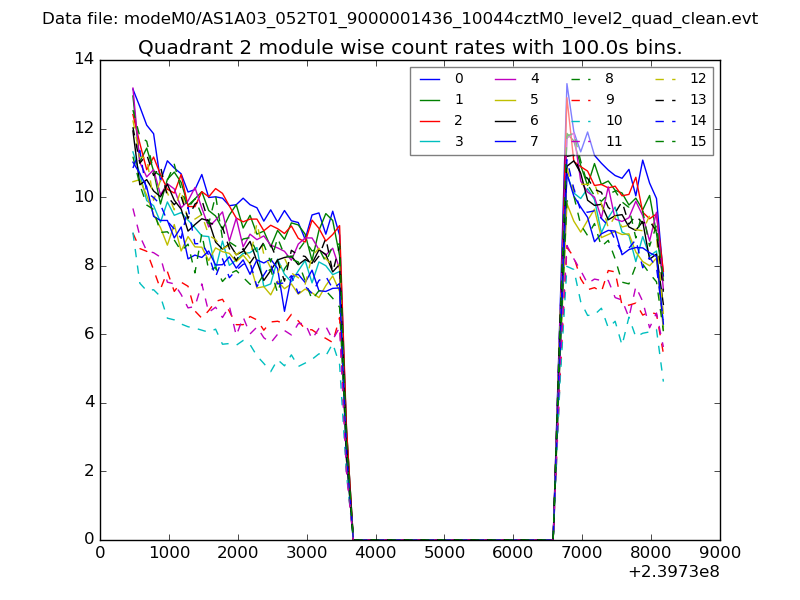
| Module-wise count rates for Quadrant B Data is divided into 100 sec bins |
 |
 |
| Module-wise count rates for Quadrant C Data is divided into 100 sec bins |
 |
 |
| Module-wise count rates for Quadrant D Data is divided into 100 sec bins |
 |
 |
| Parameter | Plot |
|---|---|
| CZT HV Monitor | 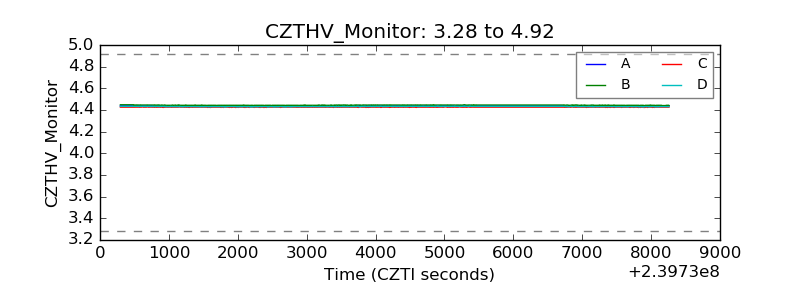 |
| D_VDD | 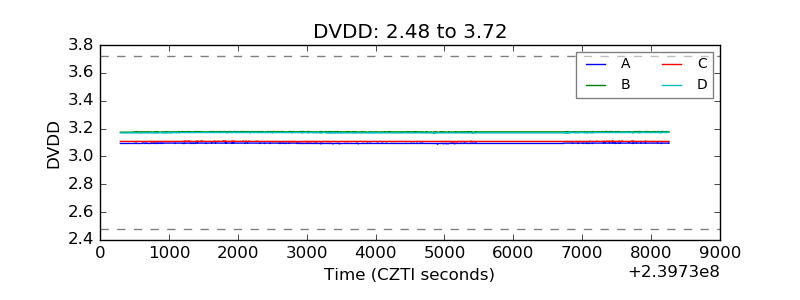 |
| Temperature 1 | 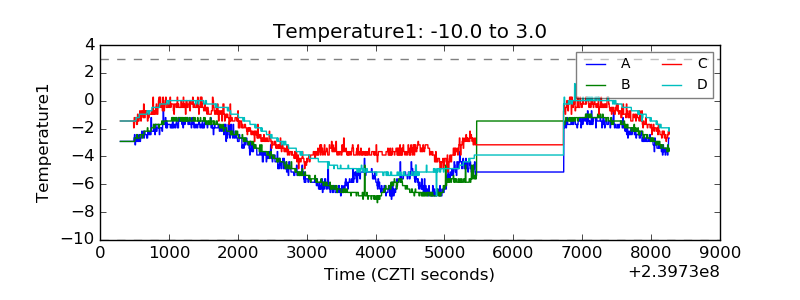 |
| Veto HV Monitor | 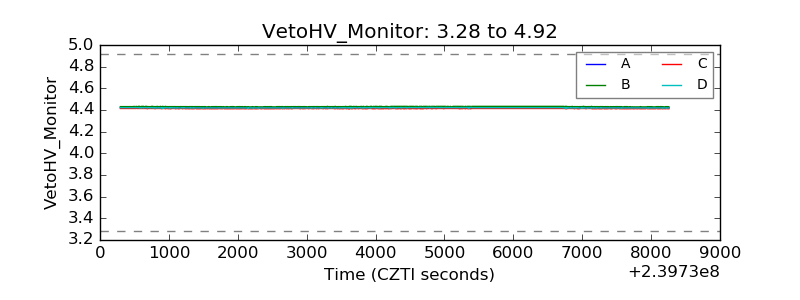 |
| Veto LLD | 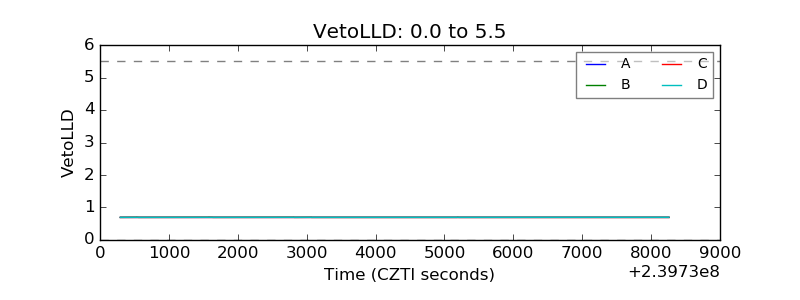 |
| Alpha Counter | 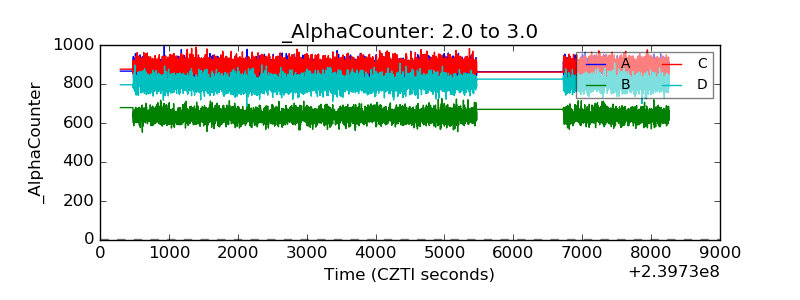 |
| _CPM_Rate | 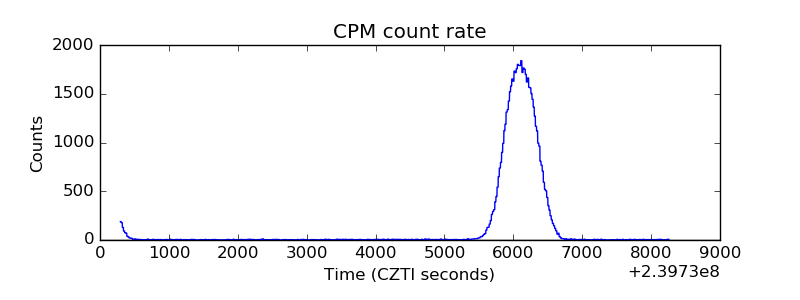 |
| CZT Counter | 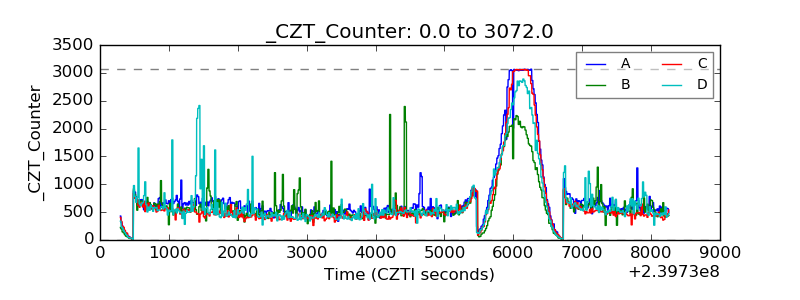 |
| +2.5 Volts monitor |  |
| +5 Volts monitor |  |
| _ROLL_ROT | 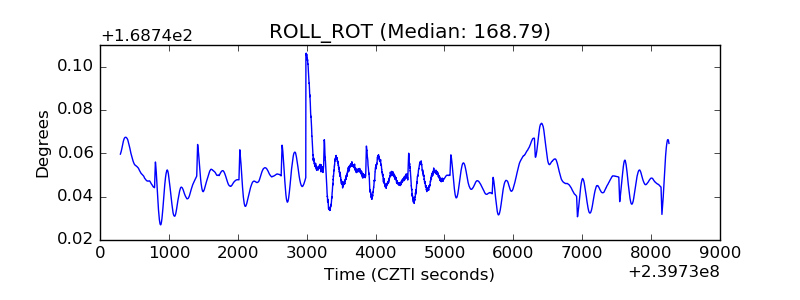 |
| _Roll_DEC | 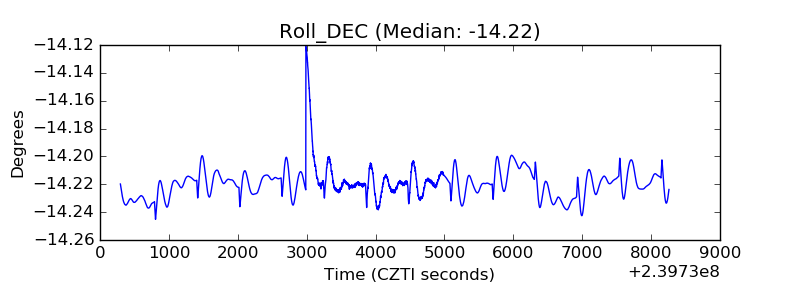 |
| _Roll_RA | 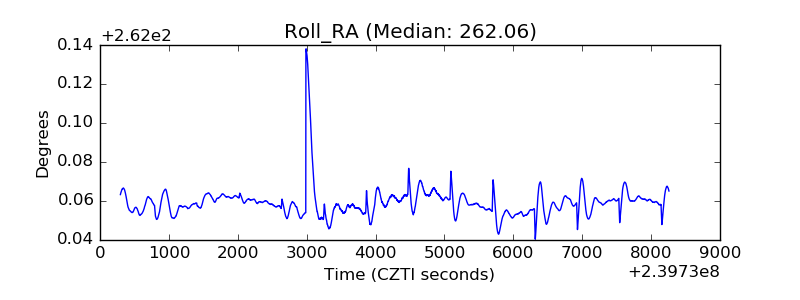 |
| Veto Counter | 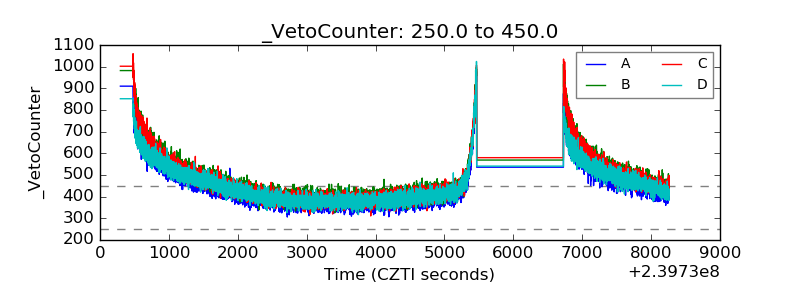 |