| Param | Original file | Final file |
|---|---|---|
| Filename | modeM0/AS1A03_052T01_9000001436_10045cztM0_level2.evt | modeM0/AS1A03_052T01_9000001436_10045cztM0_level2_quad_clean.evt |
| Size (bytes) | 494,619,840 | 88,704,000 |
| Size | 471.7 MB | 84.6 MB |
| Events in quadrant A | 3,574,857 | 572,791 |
| Events in quadrant B | 3,289,906 | 583,433 |
| Events in quadrant C | 2,995,158 | 563,644 |
| Events in quadrant D | 4,692,298 | 526,797 |
| Mode SS | |||
|---|---|---|---|
| Quadrant | BADHDUFLAG | Total packets | Discarded packets |
| A | 0 | 128 | 0 |
| B | 0 | 128 | 0 |
| C | 0 | 128 | 0 |
| D | 0 | 128 | 0 |
| Mode M9 | |||
|---|---|---|---|
| Quadrant | BADHDUFLAG | Total packets | Discarded packets |
| A | 0 | 13 | 0 |
| B | 0 | 13 | 0 |
| C | 0 | 13 | 0 |
| D | 0 | 13 | 0 |
| Mode M0 | |||
|---|---|---|---|
| Quadrant | BADHDUFLAG | Total packets | Discarded packets |
| A | 0 | 14803 | 3 |
| B | 0 | 13839 | 2 |
| C | 0 | 13140 | 2 |
| D | 0 | 18126 | 2 |
| Quadrant | Total seconds | Saturated seconds | Saturation percentage |
|---|---|---|---|
| A | 6296 | 87 | 1.381830% |
| B | 6296 | 85 | 1.350064% |
| C | 6296 | 50 | 0.794155% |
| D | 6297 | 631 | 10.020645% |
Noise dominated data is calculated using 1-second bins in cleaned event files. If a bin has >2000 counts, and if more than 50% of those come from <1% of pixels, then it is considered to be noise-dominated and hence unusable.
| Quadrant | # 1 sec bins | Bins with >0 counts | Bins with >2000 counts | High rate bins dominated by noise | Noise dominated (total time) | Noise dominated (detector-on time) | Marked lightcurve |
|---|---|---|---|---|---|---|---|
| A | 7601 | 6297 | 2 | 2 | 0.03% | 0.03% | 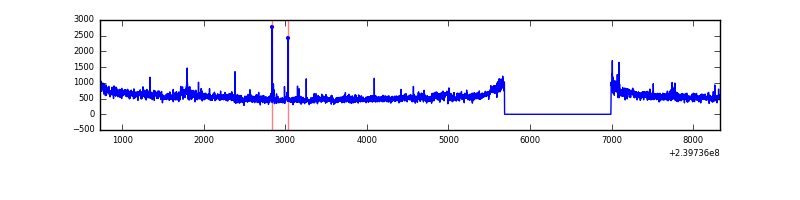 |
| B | 7601 | 6296 | 4 | 4 | 0.05% | 0.06% | 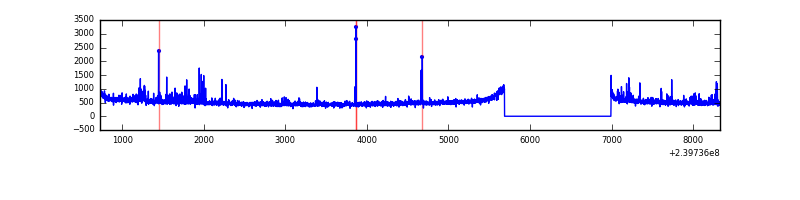 |
| C | 7601 | 6297 | 0 | 0 | 0.00% | 0.00% | 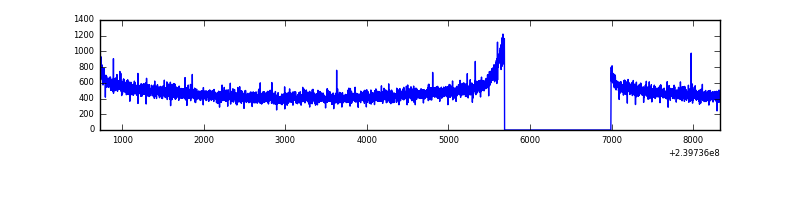 |
| D | 7602 | 6298 | 540 | 540 | 7.10% | 8.57% | 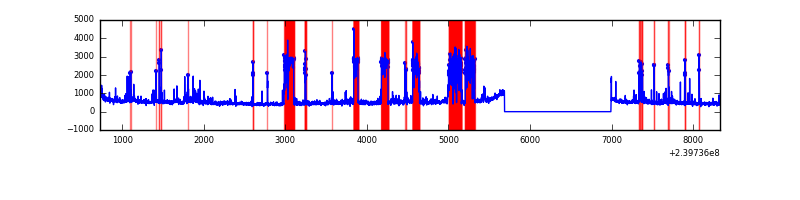 |
Top three noisy pixels from each quadrant. If the there are fewer than three noisy pixels in the level2.evt file, extra rows are filled as -1
| Pixel properties | Quadrant properties | ||||||
|---|---|---|---|---|---|---|---|
| Quadrant | DetID | PixID | Counts | Sigma | Mean | Median | Sigma |
| A | 8 | 15 | 453840 | 2805.81 | 795 | 781 | 161.5 |
| A | 15 | 174 | 52195 | 318.41 | 795 | 781 | 161.5 |
| A | 0 | 226 | 7542 | 41.87 | 795 | 781 | 161.5 |
| B | 4 | 81 | 93157 | 609.26 | 797 | 779 | 151.6 |
| B | 0 | 214 | 28190 | 180.78 | 797 | 779 | 151.6 |
| B | 10 | 247 | 24922 | 159.23 | 797 | 779 | 151.6 |
| C | 14 | 67 | 9949 | 51.41 | 764 | 769 | 178.6 |
| C | 13 | 61 | 5879 | 28.61 | 764 | 769 | 178.6 |
| C | 8 | 222 | 4926 | 23.28 | 764 | 769 | 178.6 |
| D | 1 | 20 | 1377650 | 6975.02 | 730 | 715 | 197.4 |
| D | 7 | 71 | 141352 | 712.41 | 730 | 715 | 197.4 |
| D | 2 | 152 | 138009 | 695.48 | 730 | 715 | 197.4 |
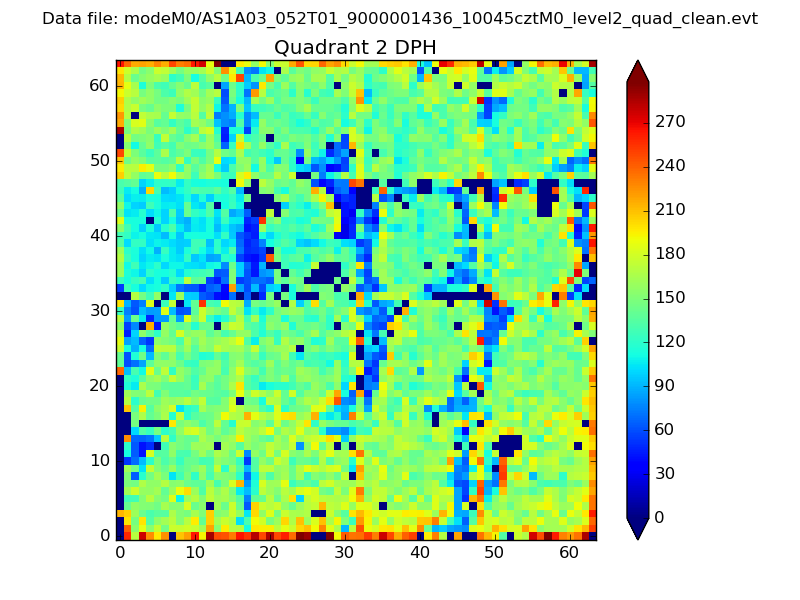
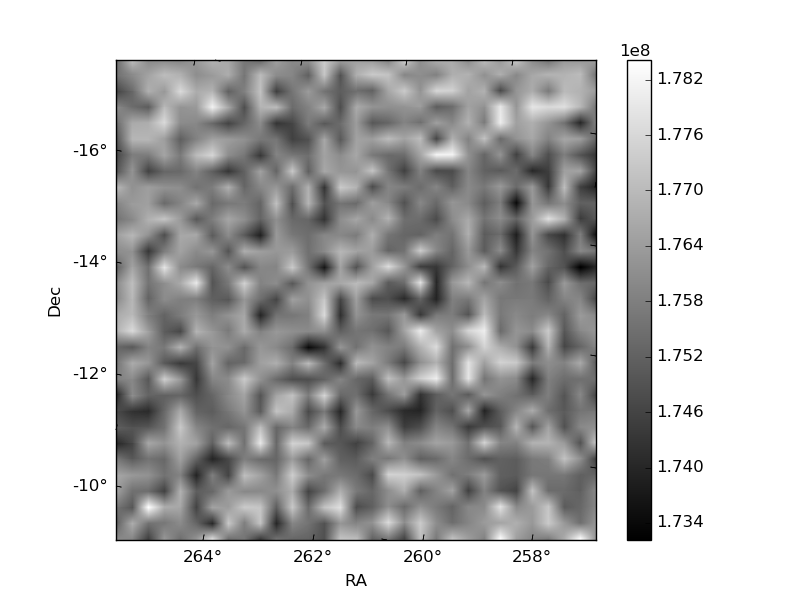
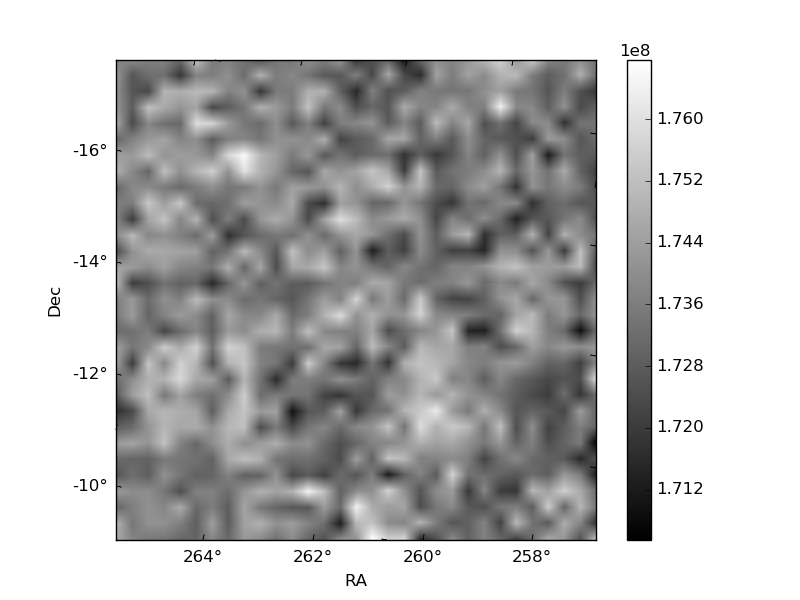
Histogram calculated using DETX and DETY for each event in the final _common_clean file
| Quadrant A |  |
 |
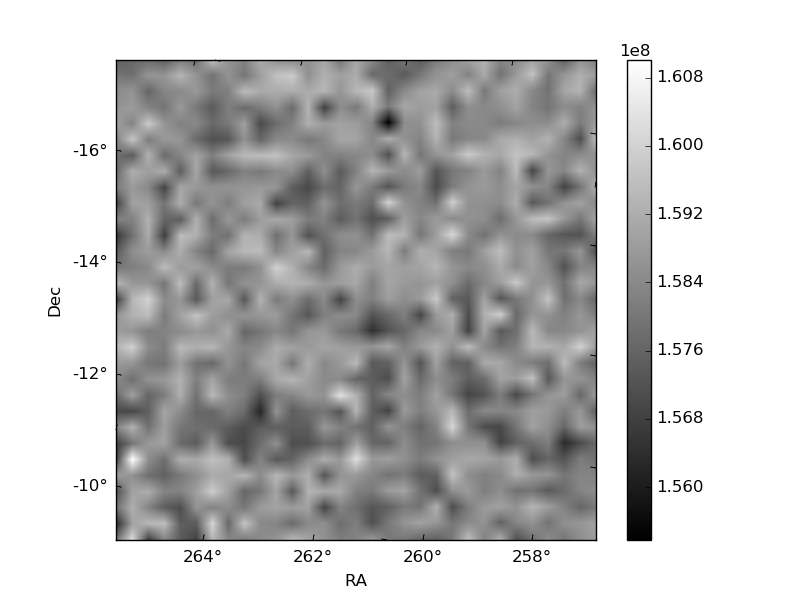
Quadrant B |
|---|---|---|---|
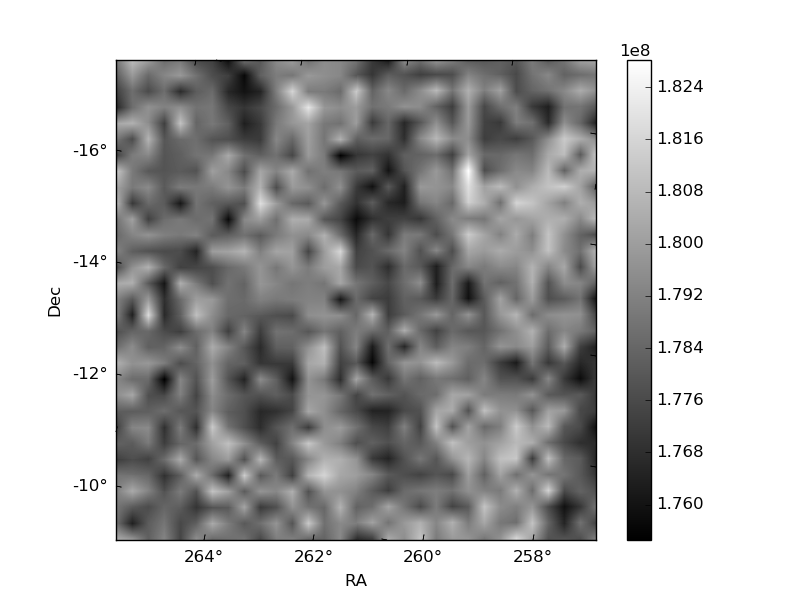
| Quadrant D | 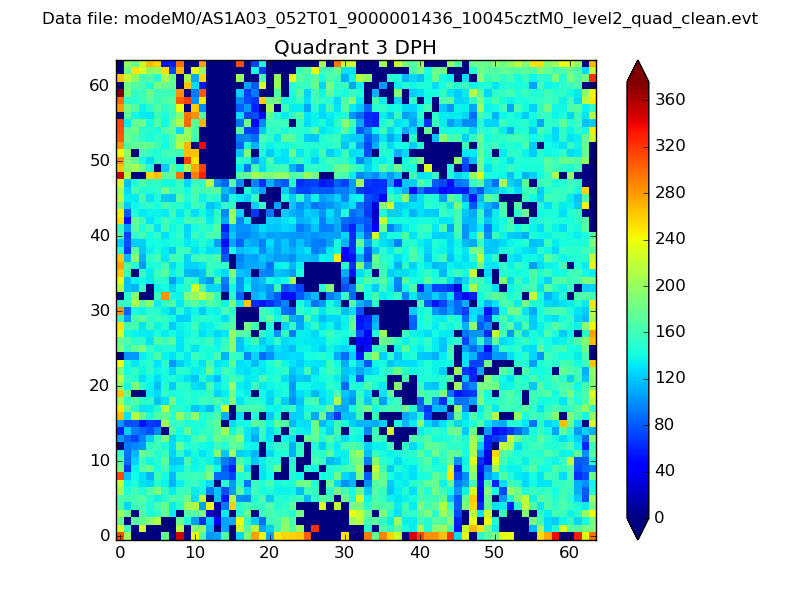 |
 |
Quadrant C |
| Plot type | Count rate plots | Images |
|---|---|---|
| Comparison with Poisson distribution Blue bars denote a histogram of data divided into 1 sec bins. Red curve is a Poisson curve with rate = median count rate of data. |
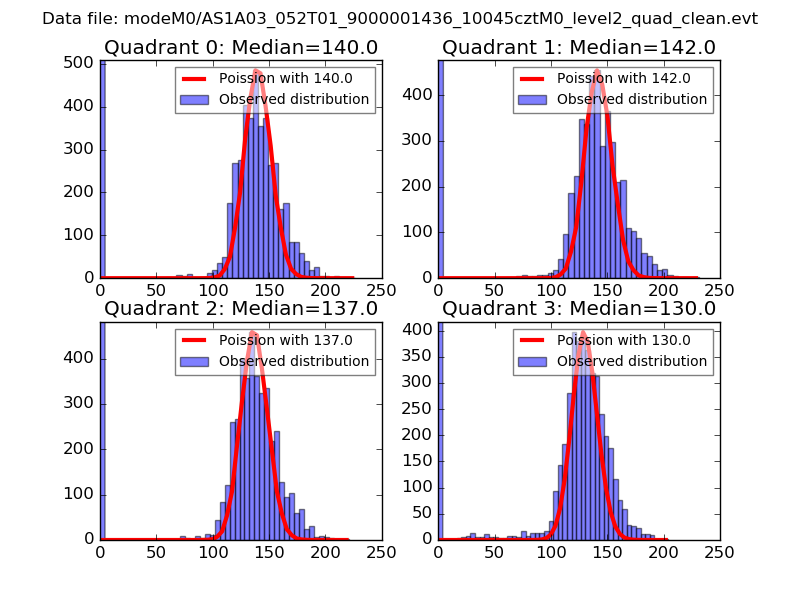 |
 |
| Quadrant-wise count rates Data is divided into 100 sec bins |
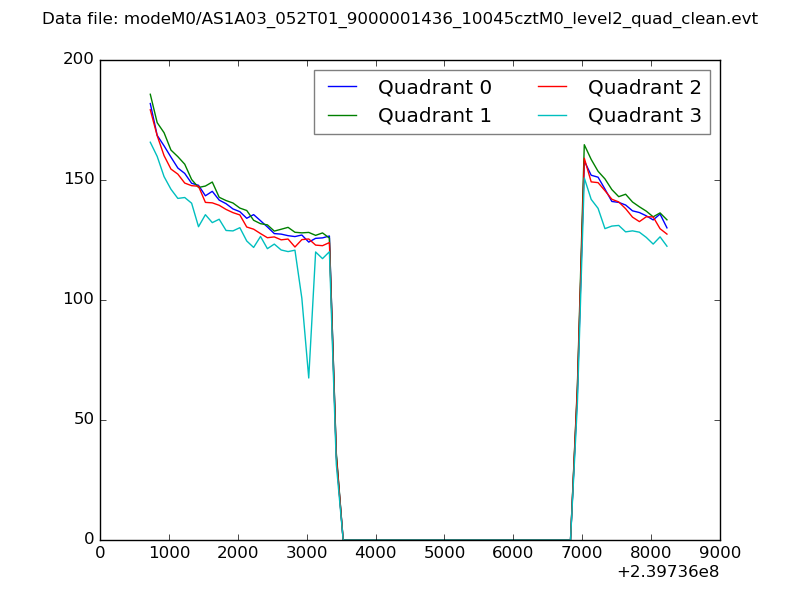 |
|
| Module-wise count rates for Quadrant A Data is divided into 100 sec bins |
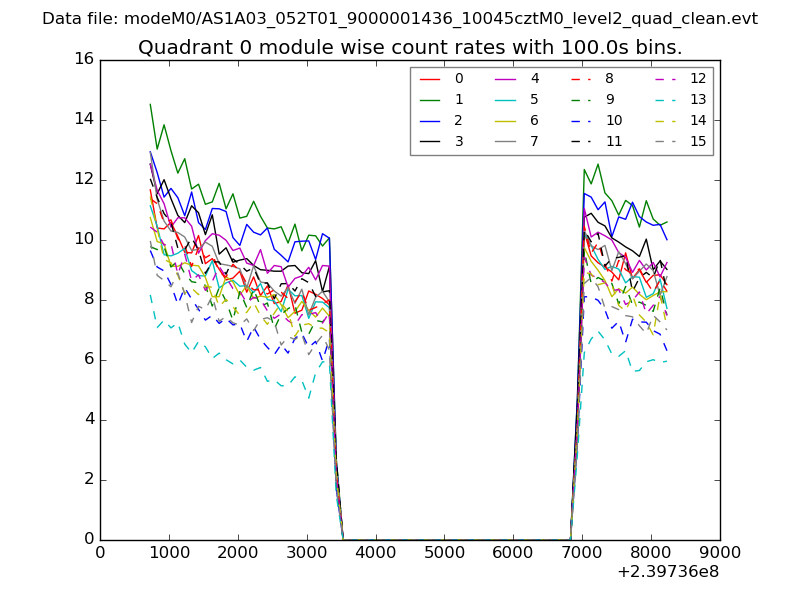 |
 |
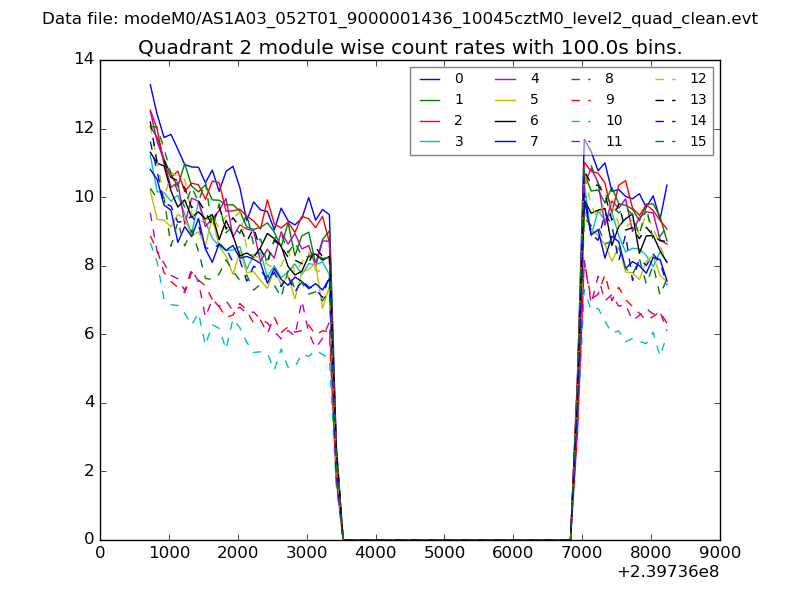
| Module-wise count rates for Quadrant B Data is divided into 100 sec bins |
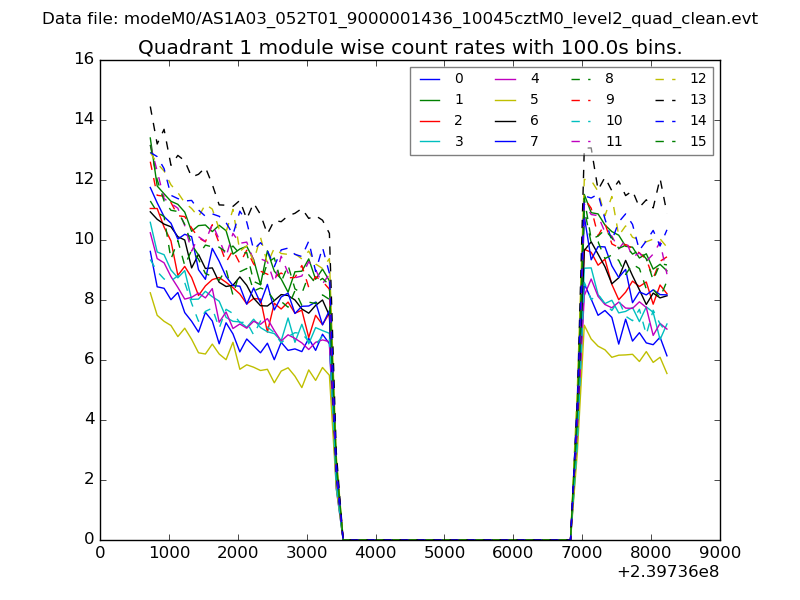 |
 |
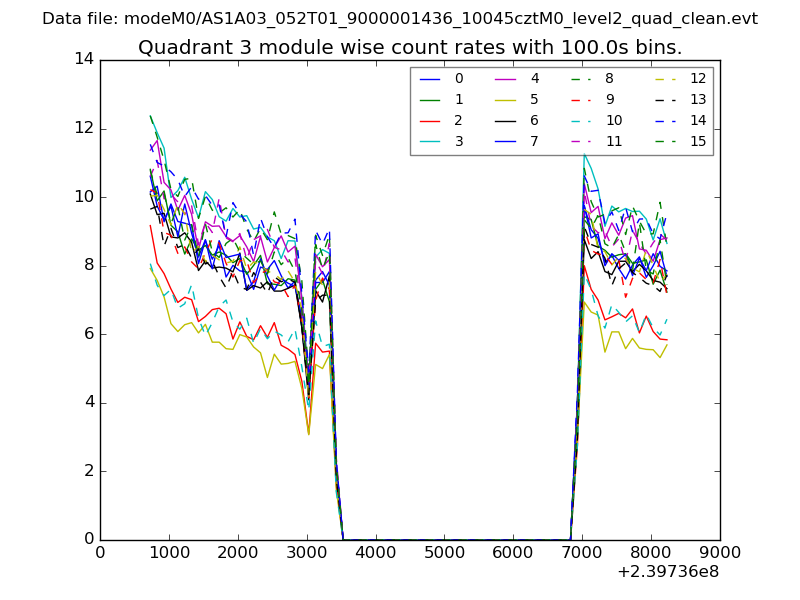
| Module-wise count rates for Quadrant C Data is divided into 100 sec bins |
 |
 |
| Module-wise count rates for Quadrant D Data is divided into 100 sec bins |
 |
 |
| Parameter | Plot |
|---|---|
| CZT HV Monitor | 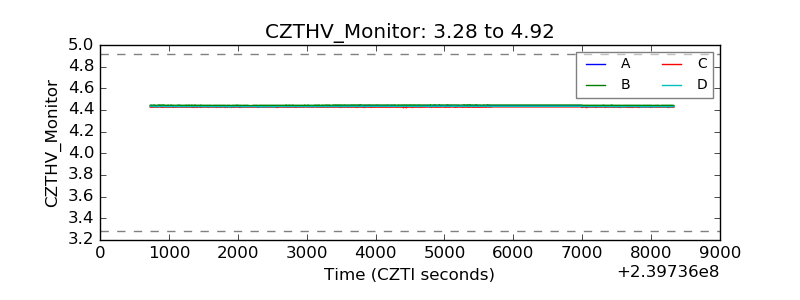 |
| D_VDD | 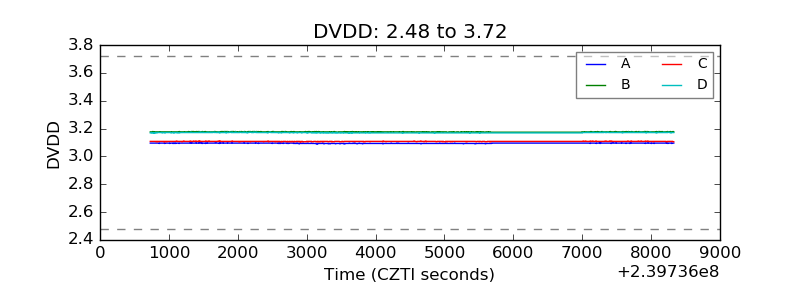 |
| Temperature 1 | 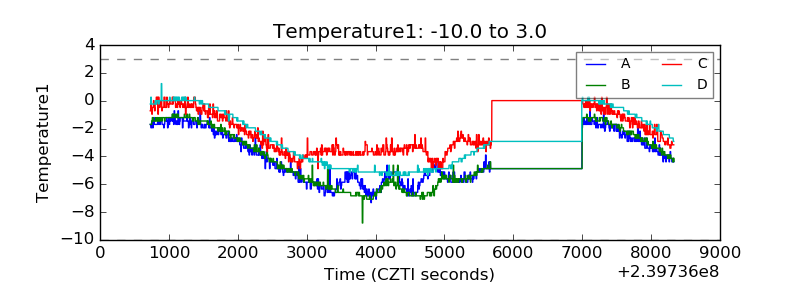 |
| Veto HV Monitor | 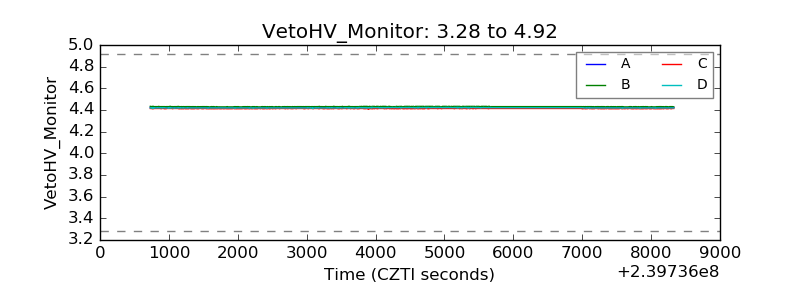 |
| Veto LLD | 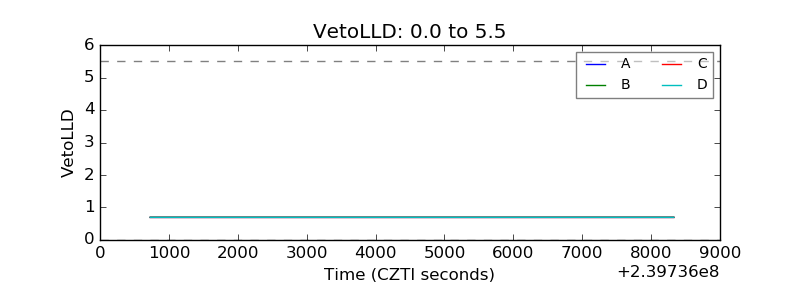 |
| Alpha Counter | 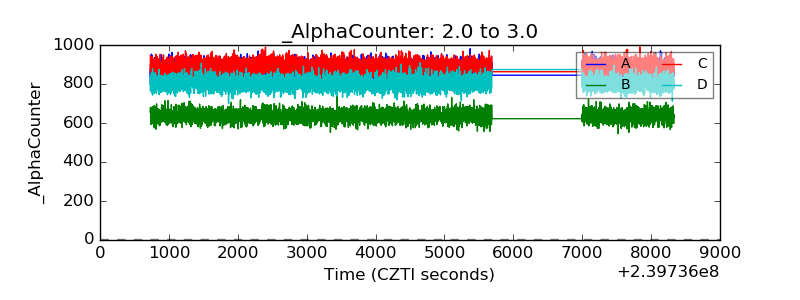 |
| _CPM_Rate | 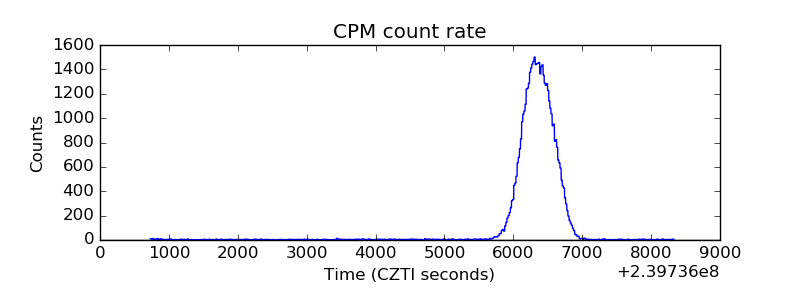 |
| CZT Counter |  |
| +2.5 Volts monitor |  |
| +5 Volts monitor | 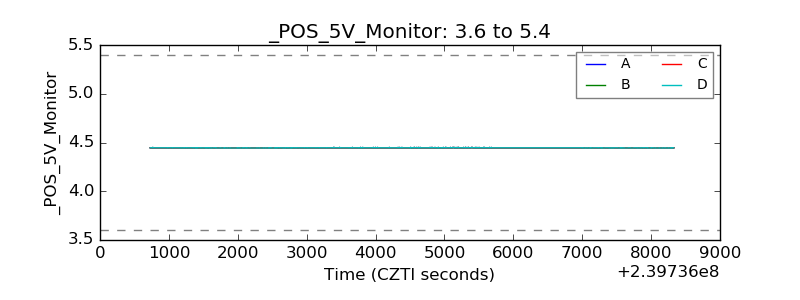 |
| _ROLL_ROT | 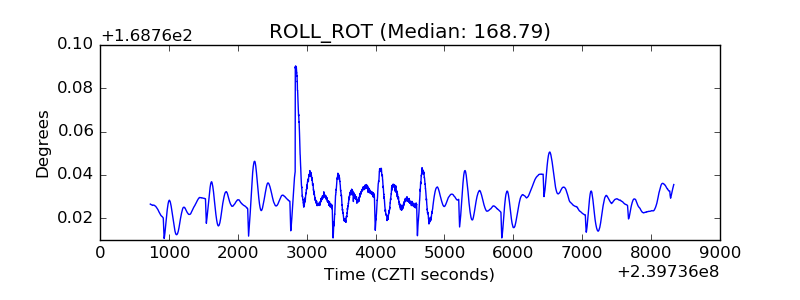 |
| _Roll_DEC | 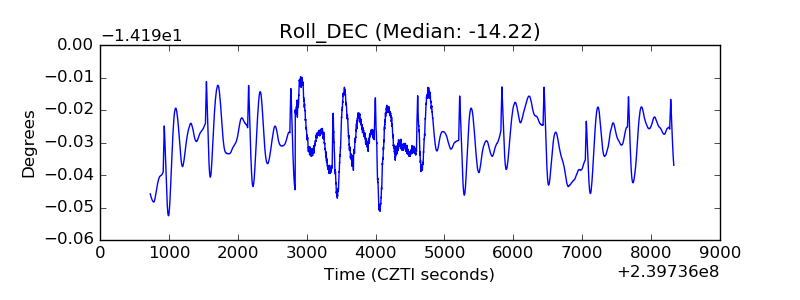 |
| _Roll_RA |  |
| Veto Counter | 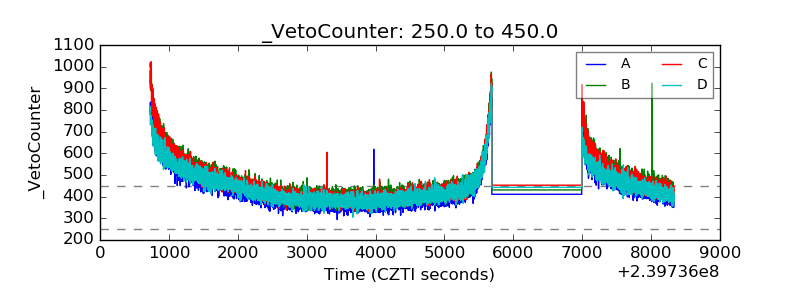 |