| Param | Original file | Final file |
|---|---|---|
| Filename | modeM0/AS1A03_052T01_9000001436_10046cztM0_level2.evt | modeM0/AS1A03_052T01_9000001436_10046cztM0_level2_quad_clean.evt |
| Size (bytes) | 105,062,400 | 21,888,000 |
| Size | 100.2 MB | 20.9 MB |
| Events in quadrant A | 794,799 | 137,136 |
| Events in quadrant B | 835,951 | 133,392 |
| Events in quadrant C | 711,699 | 142,934 |
| Events in quadrant D | 734,290 | 138,194 |
| Mode SS | |||
|---|---|---|---|
| Quadrant | BADHDUFLAG | Total packets | Discarded packets |
| A | 0 | 124 | 99 |
| B | 0 | 125 | 91 |
| C | 0 | 124 | 94 |
| D | 0 | 123 | 85 |
| Mode M9 | |||
|---|---|---|---|
| Quadrant | BADHDUFLAG | Total packets | Discarded packets |
| A | 0 | 22 | 10 |
| B | 0 | 21 | 12 |
| C | 0 | 22 | 6 |
| D | 0 | 22 | 10 |
| Mode M0 | |||
|---|---|---|---|
| Quadrant | BADHDUFLAG | Total packets | Discarded packets |
| A | 0 | 13933 | 10639 |
| B | 0 | 14391 | 11018 |
| C | 0 | 12637 | 9505 |
| D | 0 | 13257 | 10055 |
| Quadrant | Total seconds | Saturated seconds | Saturation percentage |
|---|---|---|---|
| A | 1470 | 15 | 1.020408% |
| B | 1418 | 42 | 2.961918% |
| C | 1512 | 8 | 0.529101% |
| D | 1523 | 9 | 0.590939% |
Noise dominated data is calculated using 1-second bins in cleaned event files. If a bin has >2000 counts, and if more than 50% of those come from <1% of pixels, then it is considered to be noise-dominated and hence unusable.
| Quadrant | # 1 sec bins | Bins with >0 counts | Bins with >2000 counts | High rate bins dominated by noise | Noise dominated (total time) | Noise dominated (detector-on time) | Marked lightcurve |
|---|---|---|---|---|---|---|---|
| A | 7464 | 2197 | 0 | 0 | 0.00% | 0.00% | 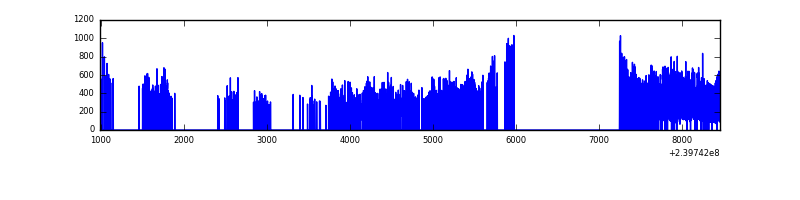 |
| B | 7465 | 2153 | 15 | 15 | 0.20% | 0.70% | 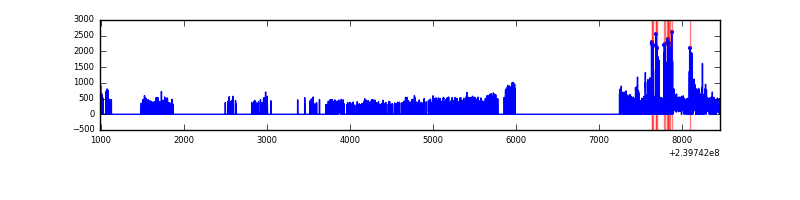 |
| C | 7465 | 2249 | 0 | 0 | 0.00% | 0.00% | 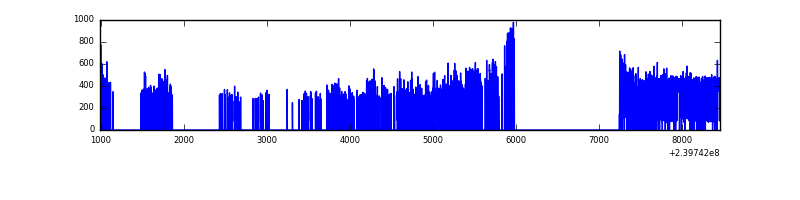 |
| D | 7465 | 2288 | 1 | 1 | 0.01% | 0.04% | 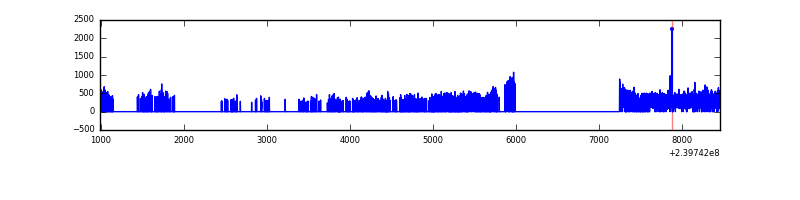 |
Top three noisy pixels from each quadrant. If the there are fewer than three noisy pixels in the level2.evt file, extra rows are filled as -1
| Pixel properties | Quadrant properties | ||||||
|---|---|---|---|---|---|---|---|
| Quadrant | DetID | PixID | Counts | Sigma | Mean | Median | Sigma |
| A | 8 | 15 | 91409 | 2352.86 | 181 | 177 | 38.8 |
| A | 15 | 174 | 4350 | 107.62 | 181 | 177 | 38.8 |
| A | 15 | 239 | 2498 | 59.86 | 181 | 177 | 38.8 |
| B | 4 | 81 | 103611 | 2899.34 | 176 | 172 | 35.7 |
| B | 4 | 239 | 38468 | 1073.41 | 176 | 172 | 35.7 |
| B | 12 | 111 | 3518 | 93.77 | 176 | 172 | 35.7 |
| C | 13 | 61 | 1406 | 27.73 | 181 | 183 | 44.1 |
| C | 14 | 67 | 1301 | 25.35 | 181 | 183 | 44.1 |
| C | 8 | 222 | 1091 | 20.59 | 181 | 183 | 44.1 |
| D | 7 | 71 | 13854 | 272.45 | 182 | 177 | 50.2 |
| D | 2 | 152 | 9355 | 182.83 | 182 | 177 | 50.2 |
| D | 8 | 195 | 5880 | 113.6 | 182 | 177 | 50.2 |
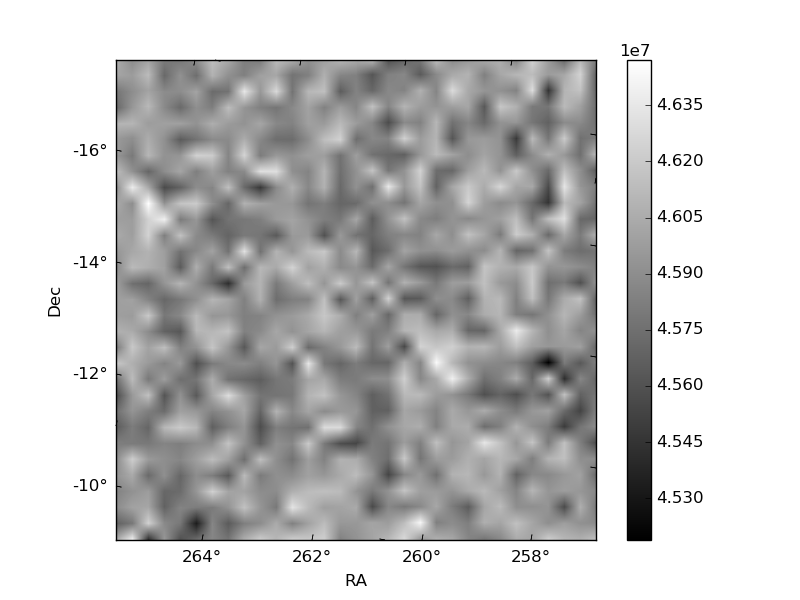
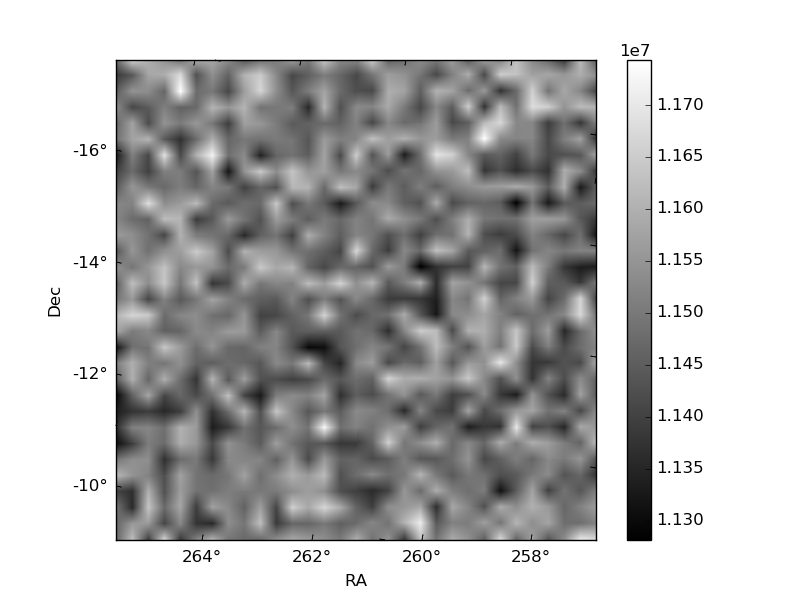
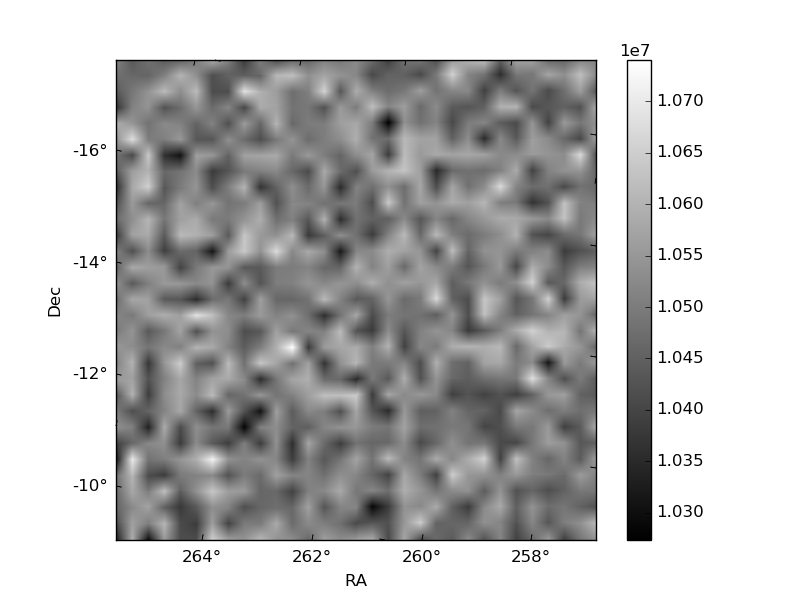
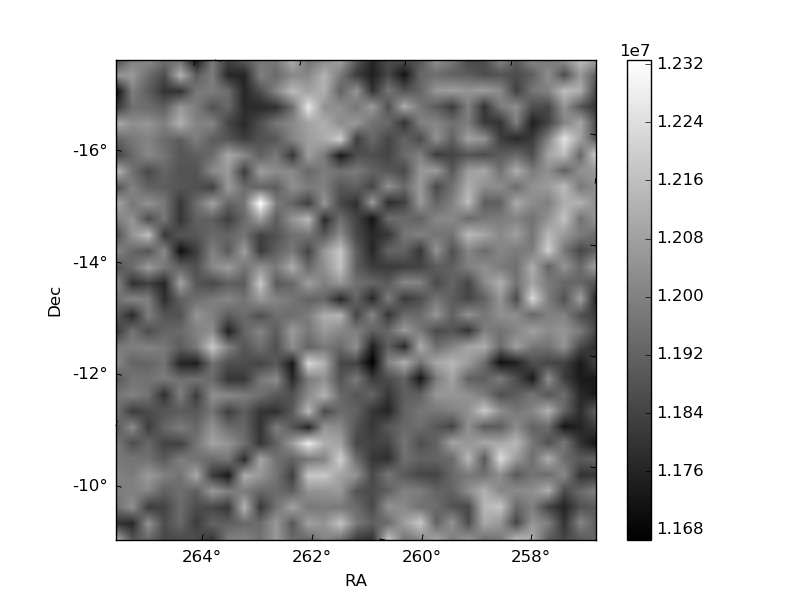
Histogram calculated using DETX and DETY for each event in the final _common_clean file
| Quadrant A | 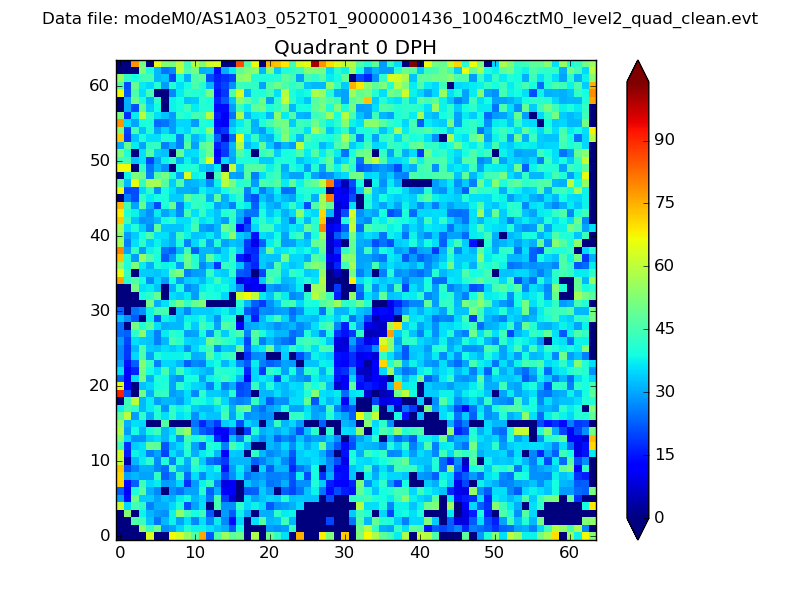 |
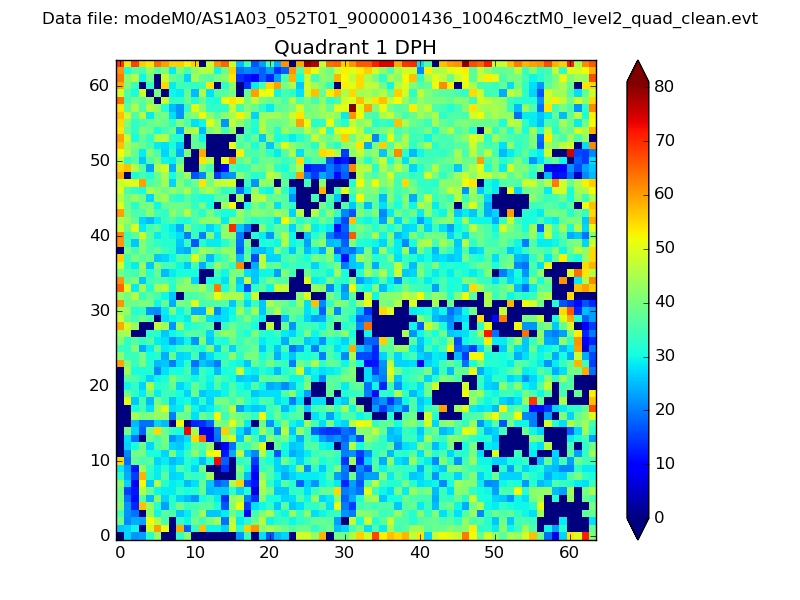 |
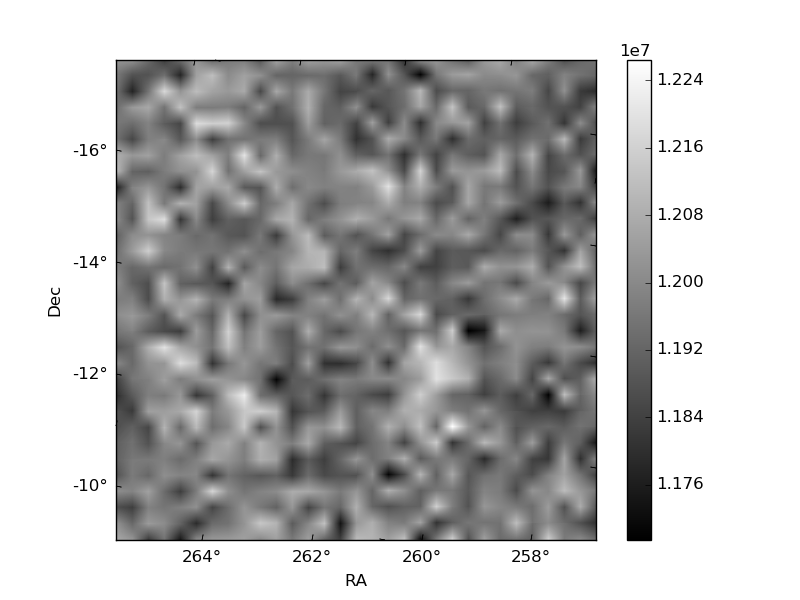
Quadrant B |
|---|---|---|---|
| Quadrant D | 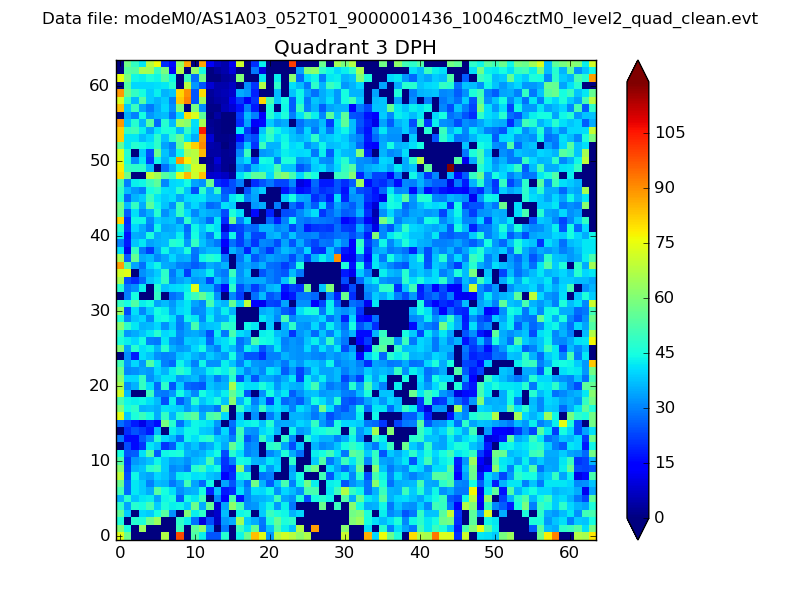 |
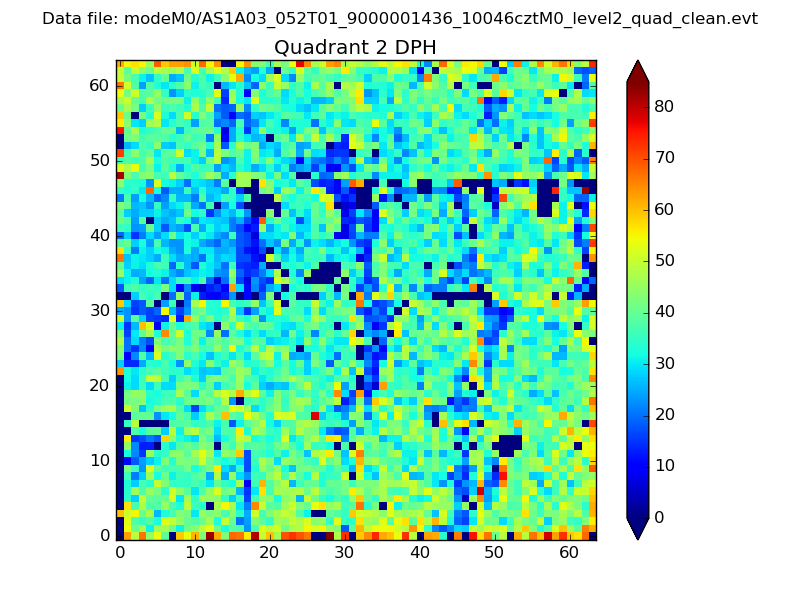 |
Quadrant C |
| Plot type | Count rate plots | Images |
|---|---|---|
| Comparison with Poisson distribution Blue bars denote a histogram of data divided into 1 sec bins. Red curve is a Poisson curve with rate = median count rate of data. |
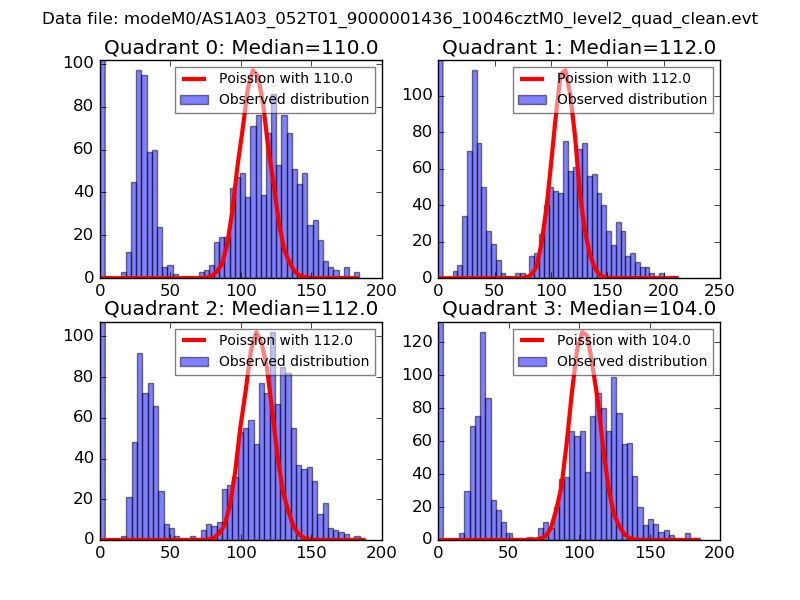 |
 |
| Quadrant-wise count rates Data is divided into 100 sec bins |
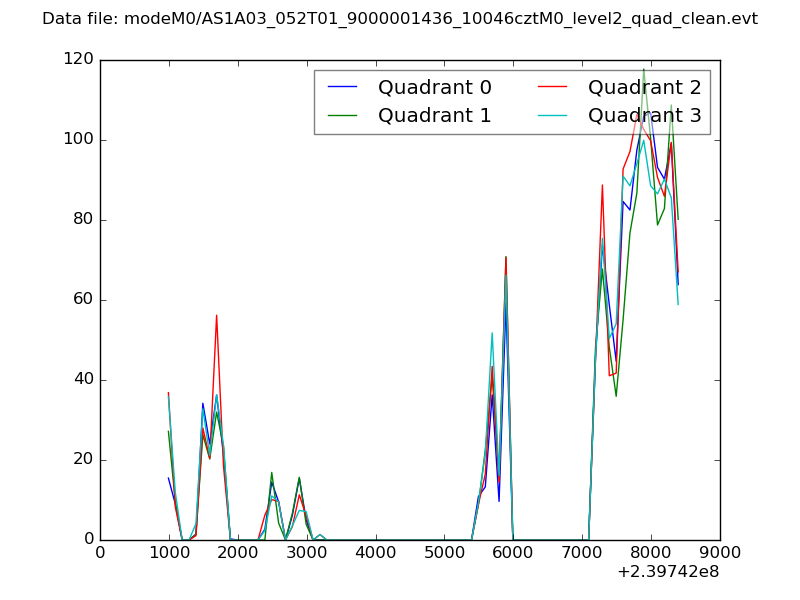 |
|
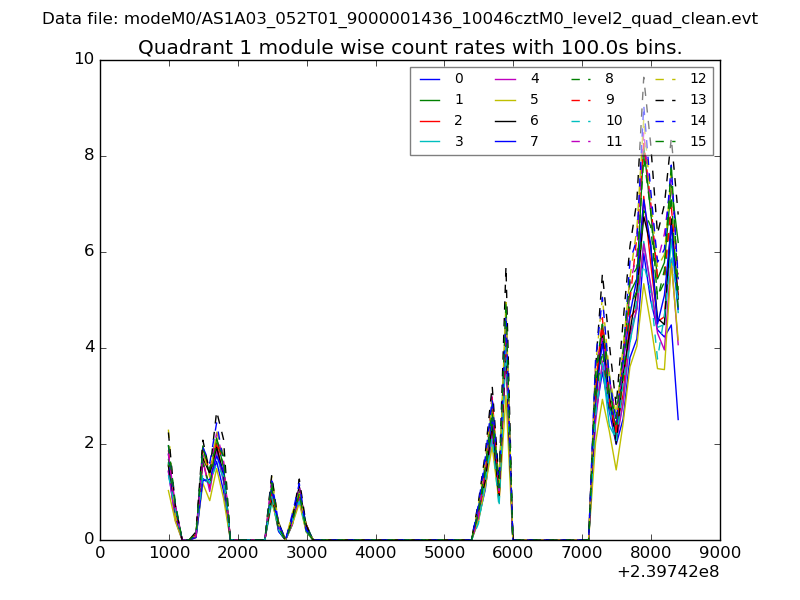
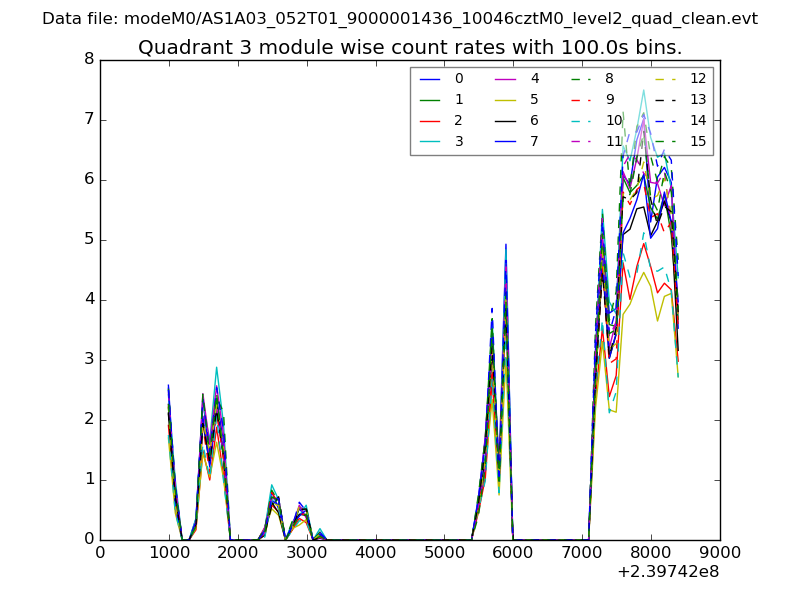
| Module-wise count rates for Quadrant A Data is divided into 100 sec bins |
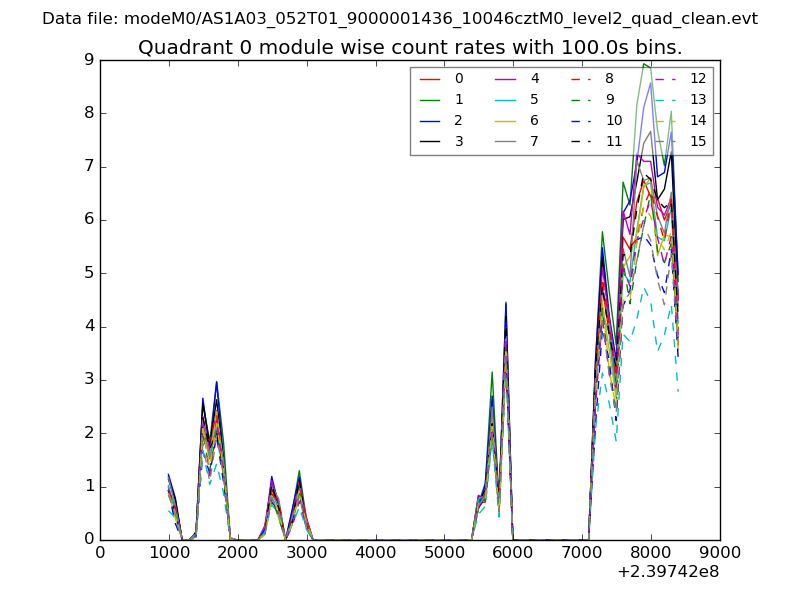 |
 |
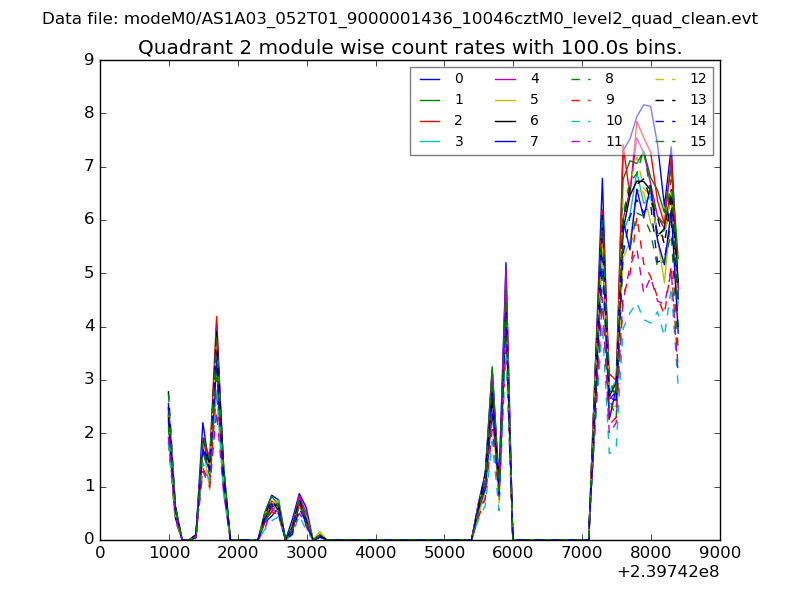
| Module-wise count rates for Quadrant B Data is divided into 100 sec bins |
 |
 |
| Module-wise count rates for Quadrant C Data is divided into 100 sec bins |
 |
 |
| Module-wise count rates for Quadrant D Data is divided into 100 sec bins |
 |
 |
| Parameter | Plot |
|---|---|
| CZT HV Monitor | 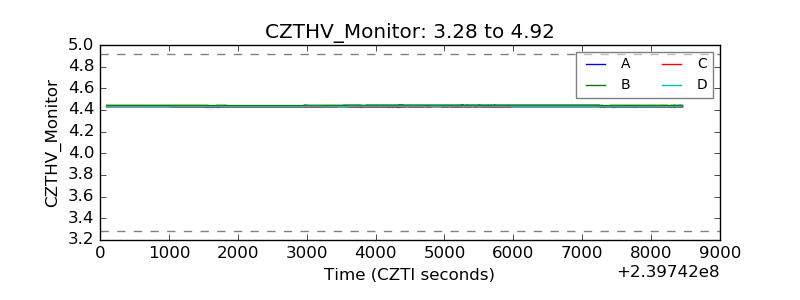 |
| D_VDD | 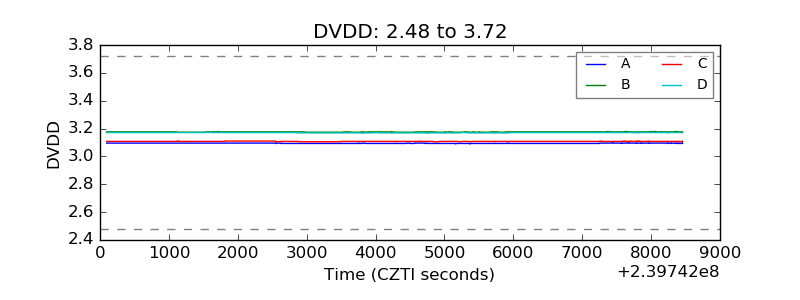 |
| Temperature 1 | 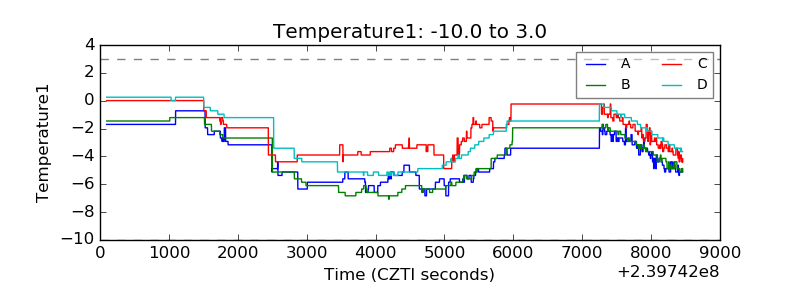 |
| Veto HV Monitor | 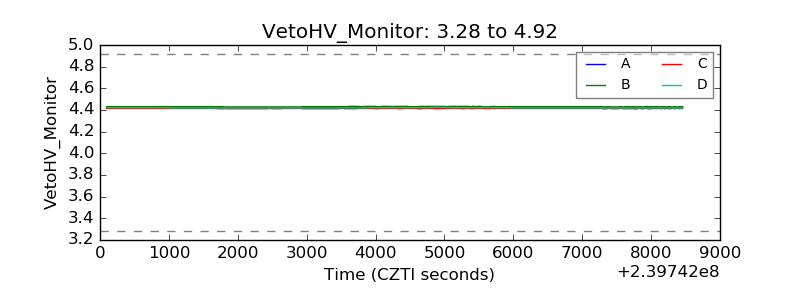 |
| Veto LLD | 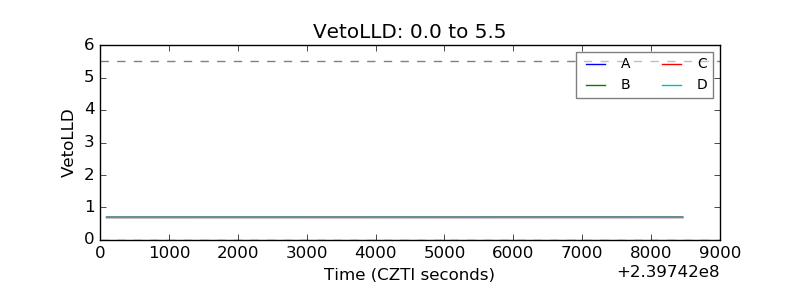 |
| Alpha Counter | 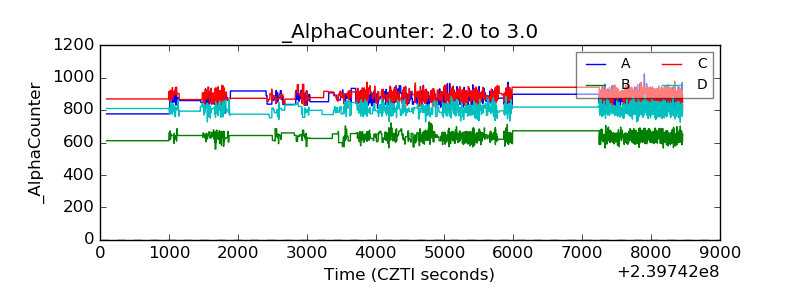 |
| _CPM_Rate | 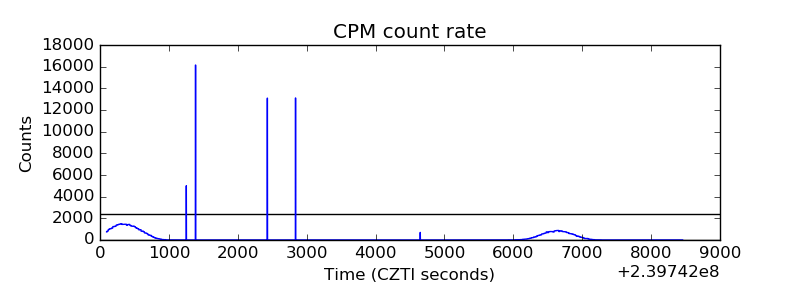 |
| CZT Counter | 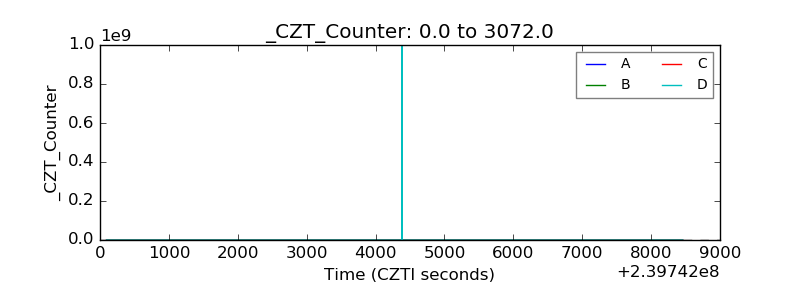 |
| +2.5 Volts monitor |  |
| +5 Volts monitor |  |
| _ROLL_ROT | 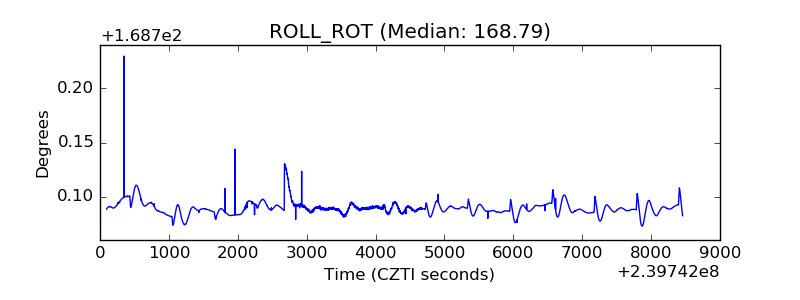 |
| _Roll_DEC | 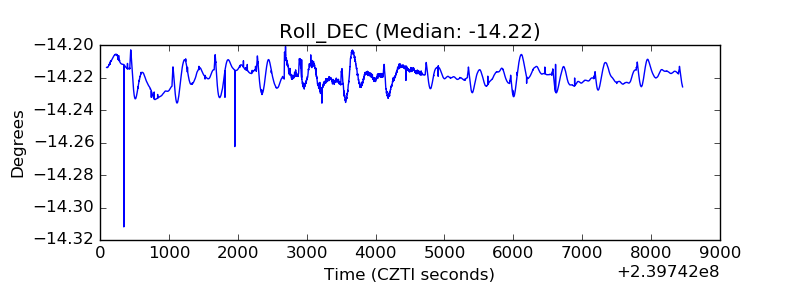 |
| _Roll_RA | 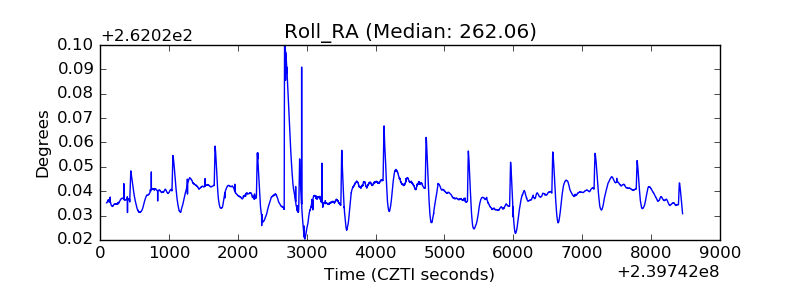 |
| Veto Counter | 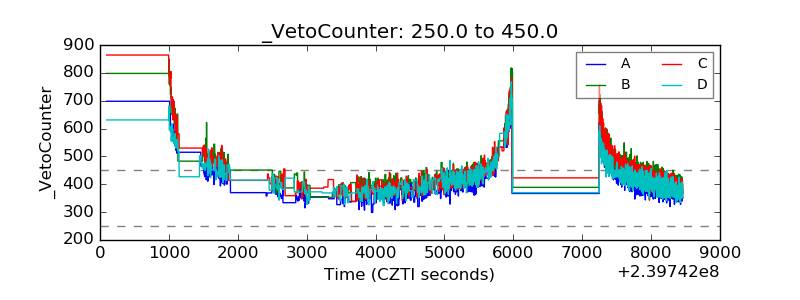 |