| Param | Original file | Final file |
|---|---|---|
| Filename | modeM0/AS1A03_052T01_9000001436_10049cztM0_level2.evt | modeM0/AS1A03_052T01_9000001436_10049cztM0_level2_quad_clean.evt |
| Size (bytes) | 939,980,160 | 138,484,800 |
| Size | 896.4 MB | 132.1 MB |
| Events in quadrant A | 6,812,764 | 860,007 |
| Events in quadrant B | 6,584,599 | 883,850 |
| Events in quadrant C | 5,147,940 | 864,836 |
| Events in quadrant D | 9,142,706 | 788,331 |
| Mode SS | |||
|---|---|---|---|
| Quadrant | BADHDUFLAG | Total packets | Discarded packets |
| A | 0 | 264 | 22 |
| B | 0 | 264 | 34 |
| C | 0 | 264 | 26 |
| D | 0 | 264 | 26 |
| Mode M9 | |||
|---|---|---|---|
| Quadrant | BADHDUFLAG | Total packets | Discarded packets |
| A | 0 | 12 | 0 |
| B | 0 | 12 | 0 |
| C | 0 | 12 | 0 |
| D | 0 | 13 | 0 |
| Mode M0 | |||
|---|---|---|---|
| Quadrant | BADHDUFLAG | Total packets | Discarded packets |
| A | 0 | 32044 | 4081 |
| B | 0 | 30804 | 3582 |
| C | 0 | 26505 | 2933 |
| D | 0 | 38614 | 3783 |
| Quadrant | Total seconds | Saturated seconds | Saturation percentage |
|---|---|---|---|
| A | 11417 | 428 | 3.748796% |
| B | 11521 | 245 | 2.126552% |
| C | 11571 | 46 | 0.397546% |
| D | 11468 | 1139 | 9.931985% |
Noise dominated data is calculated using 1-second bins in cleaned event files. If a bin has >2000 counts, and if more than 50% of those come from <1% of pixels, then it is considered to be noise-dominated and hence unusable.
| Quadrant | # 1 sec bins | Bins with >0 counts | Bins with >2000 counts | High rate bins dominated by noise | Noise dominated (total time) | Noise dominated (detector-on time) | Marked lightcurve |
|---|---|---|---|---|---|---|---|
| A | 13977 | 12082 | 237 | 237 | 1.70% | 1.96% | 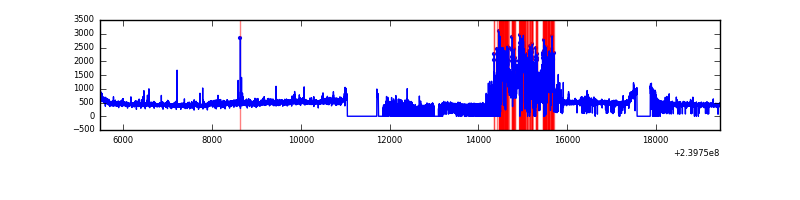 |
| B | 13977 | 12160 | 80 | 80 | 0.57% | 0.66% | 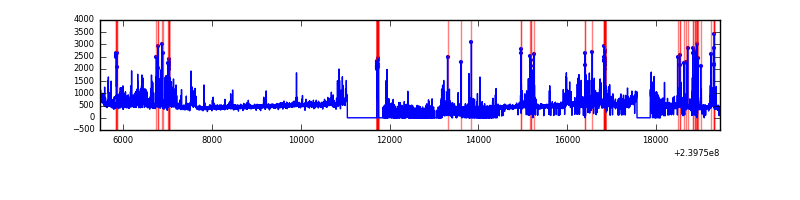 |
| C | 13977 | 12196 | 0 | 0 | 0.00% | 0.00% | 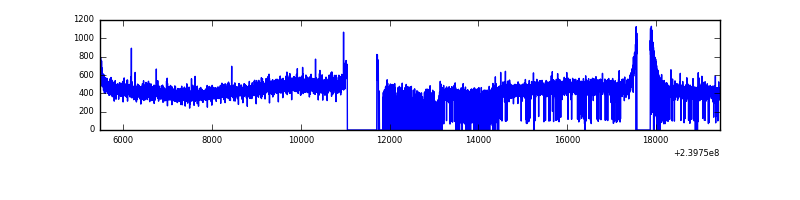 |
| D | 13977 | 12125 | 1163 | 1163 | 8.32% | 9.59% | 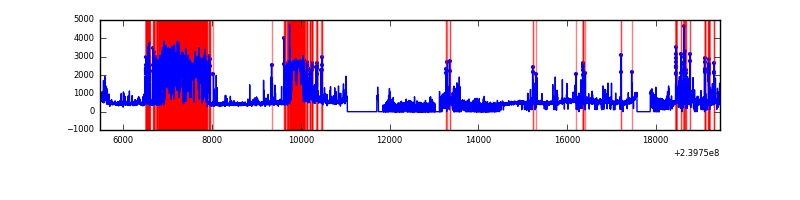 |
Top three noisy pixels from each quadrant. If the there are fewer than three noisy pixels in the level2.evt file, extra rows are filled as -1
| Pixel properties | Quadrant properties | ||||||
|---|---|---|---|---|---|---|---|
| Quadrant | DetID | PixID | Counts | Sigma | Mean | Median | Sigma |
| A | 15 | 239 | 1460995 | 5319.47 | 1340 | 1309 | 274.4 |
| A | 8 | 15 | 178131 | 644.38 | 1340 | 1309 | 274.4 |
| A | 15 | 174 | 13016 | 42.66 | 1340 | 1309 | 274.4 |
| B | 4 | 81 | 934072 | 3530.44 | 1360 | 1326 | 264.2 |
| B | 10 | 247 | 165545 | 621.57 | 1360 | 1326 | 264.2 |
| B | 4 | 239 | 106195 | 396.93 | 1360 | 1326 | 264.2 |
| C | 13 | 61 | 10170 | 28.93 | 1316 | 1323 | 305.8 |
| C | 14 | 67 | 9685 | 27.34 | 1316 | 1323 | 305.8 |
| C | 8 | 222 | 7305 | 19.56 | 1316 | 1323 | 305.8 |
| D | 1 | 20 | 3118165 | 9296.39 | 1247 | 1217 | 335.3 |
| D | 1 | 52 | 473372 | 1408.22 | 1247 | 1217 | 335.3 |
| D | 8 | 195 | 215139 | 638.03 | 1247 | 1217 | 335.3 |
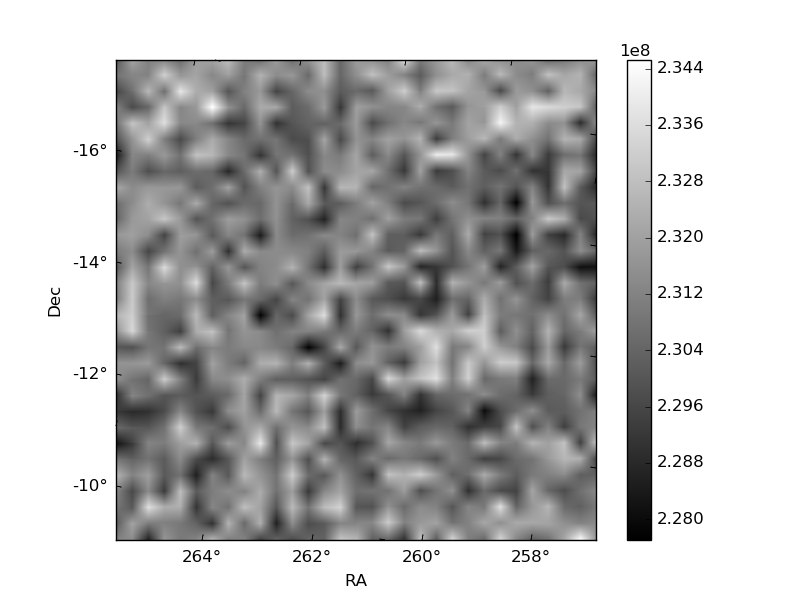
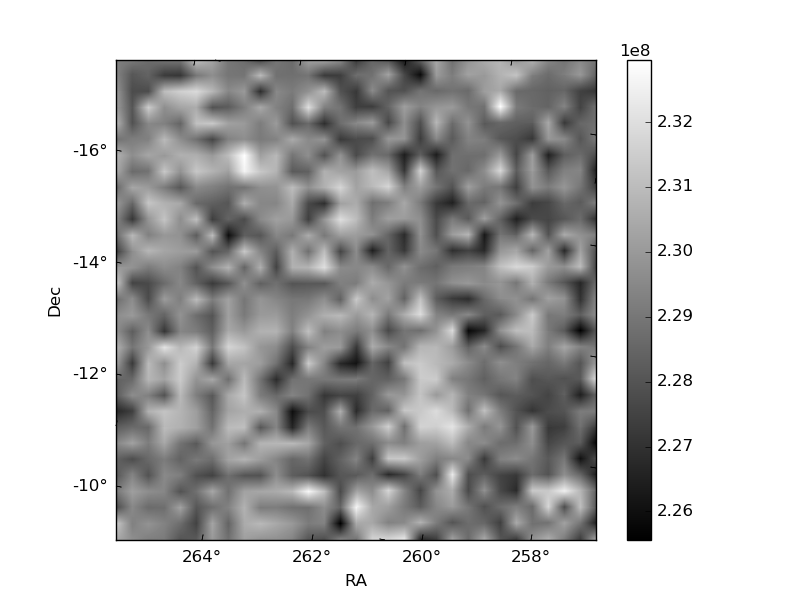
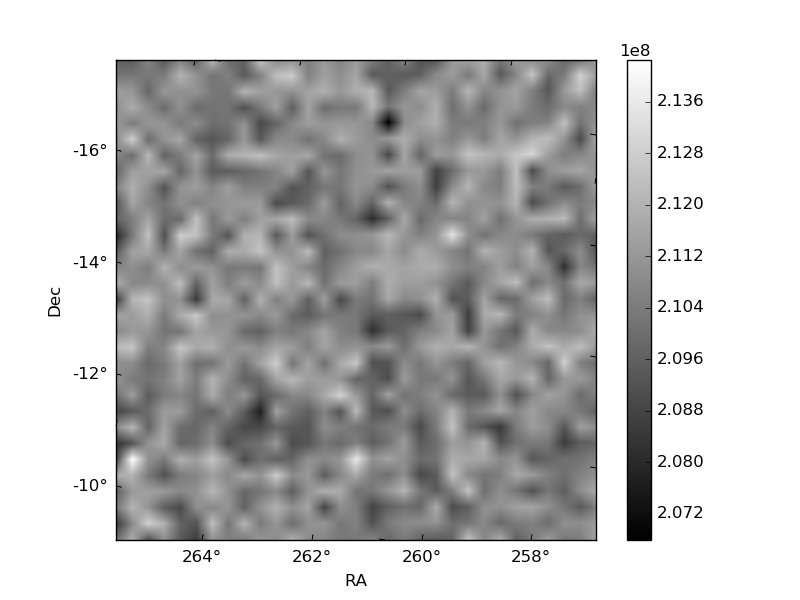
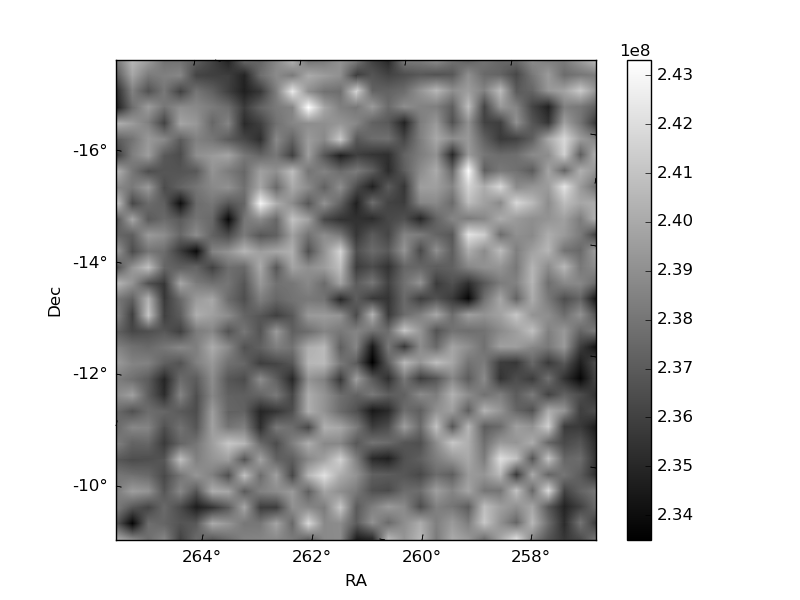
Histogram calculated using DETX and DETY for each event in the final _common_clean file
| Quadrant A |  |
 |
Quadrant B |
|---|---|---|---|
| Quadrant D |  |
 |
Quadrant C |
| Plot type | Count rate plots | Images |
|---|---|---|
| Comparison with Poisson distribution Blue bars denote a histogram of data divided into 1 sec bins. Red curve is a Poisson curve with rate = median count rate of data. |
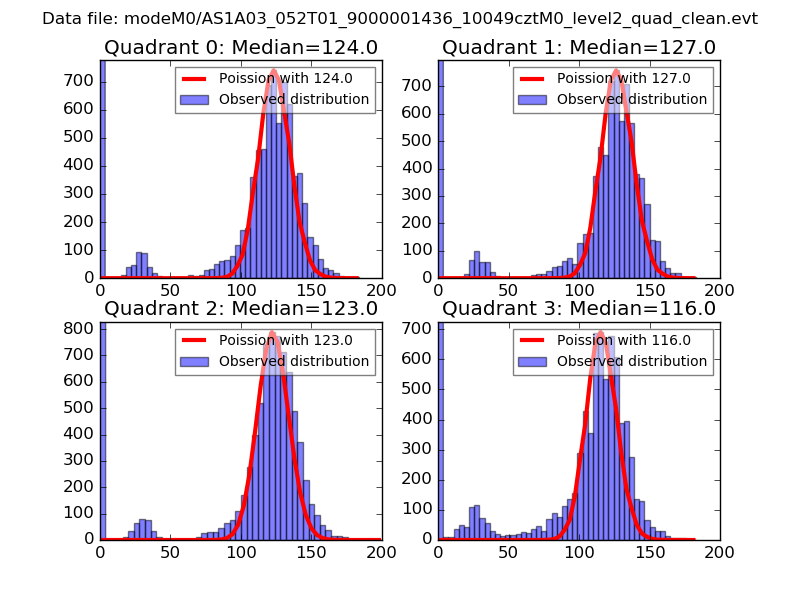 |
 |
| Quadrant-wise count rates Data is divided into 100 sec bins |
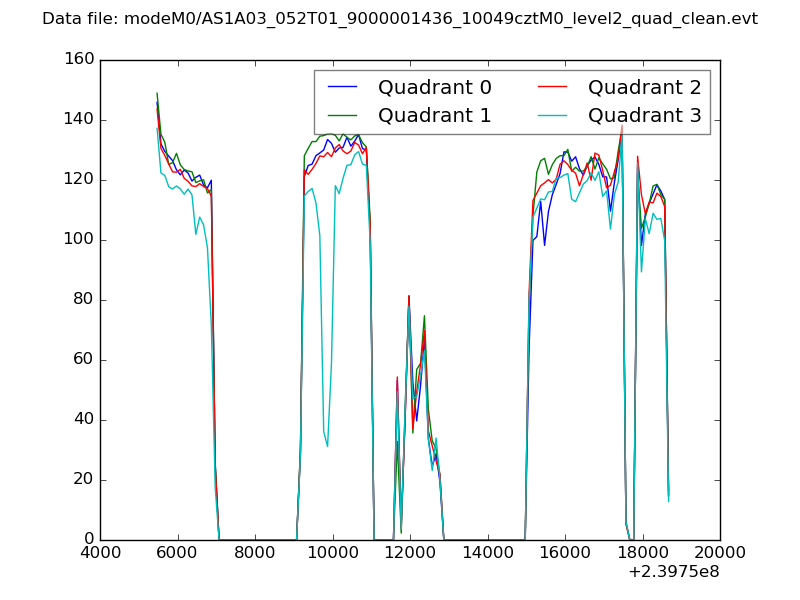 |
|
| Module-wise count rates for Quadrant A Data is divided into 100 sec bins |
 |
 |
| Module-wise count rates for Quadrant B Data is divided into 100 sec bins |
 |
 |
| Module-wise count rates for Quadrant C Data is divided into 100 sec bins |
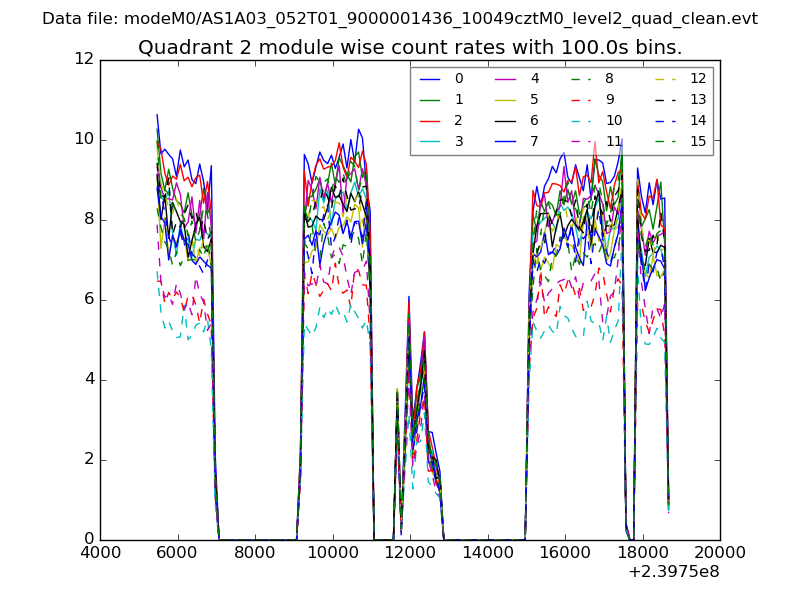 |
 |
| Module-wise count rates for Quadrant D Data is divided into 100 sec bins |
 |
 |
| Parameter | Plot |
|---|---|
| CZT HV Monitor |  |
| D_VDD |  |
| Temperature 1 |  |
| Veto HV Monitor |  |
| Veto LLD |  |
| Alpha Counter | 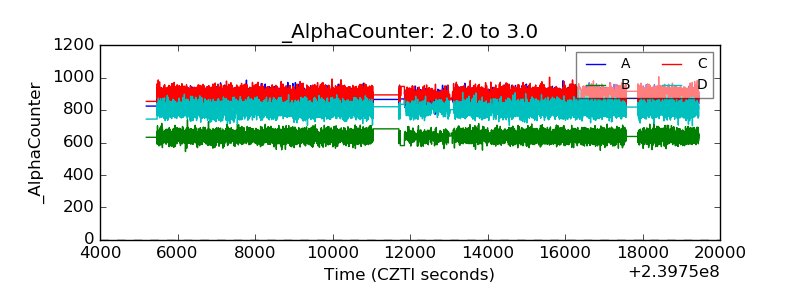 |
| _CPM_Rate | 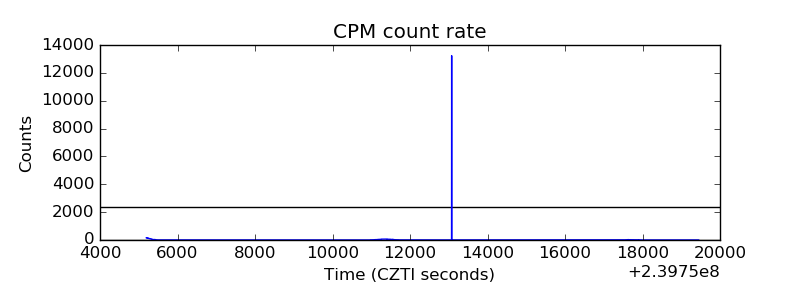 |
| CZT Counter |  |
| +2.5 Volts monitor |  |
| +5 Volts monitor |  |
| _ROLL_ROT |  |
| _Roll_DEC |  |
| _Roll_RA |  |
| Veto Counter |  |