| Param | Original file | Final file |
|---|---|---|
| Filename | modeM0/AS1A03_052T01_9000001436_10050cztM0_level2.evt | modeM0/AS1A03_052T01_9000001436_10050cztM0_level2_quad_clean.evt |
| Size (bytes) | 581,411,520 | 78,396,480 |
| Size | 554.5 MB | 74.8 MB |
| Events in quadrant A | 3,374,439 | 477,752 |
| Events in quadrant B | 3,860,388 | 484,781 |
| Events in quadrant C | 3,215,309 | 475,706 |
| Events in quadrant D | 6,663,144 | 427,485 |
| Mode SS | |||
|---|---|---|---|
| Quadrant | BADHDUFLAG | Total packets | Discarded packets |
| A | 0 | 150 | 0 |
| B | 0 | 150 | 0 |
| C | 0 | 150 | 2 |
| D | 0 | 150 | 0 |
| Mode M9 | |||
|---|---|---|---|
| Quadrant | BADHDUFLAG | Total packets | Discarded packets |
| A | 0 | 3 | 0 |
| B | 0 | 3 | 0 |
| C | 0 | 3 | 0 |
| D | 0 | 3 | 0 |
| Mode M0 | |||
|---|---|---|---|
| Quadrant | BADHDUFLAG | Total packets | Discarded packets |
| A | 0 | 15052 | 51 |
| B | 0 | 16381 | 42 |
| C | 0 | 14938 | 39 |
| D | 0 | 24898 | 146 |
| Quadrant | Total seconds | Saturated seconds | Saturation percentage |
|---|---|---|---|
| A | 7290 | 83 | 1.138546% |
| B | 7297 | 149 | 2.041935% |
| C | 7296 | 67 | 0.918311% |
| D | 7278 | 780 | 10.717230% |
Noise dominated data is calculated using 1-second bins in cleaned event files. If a bin has >2000 counts, and if more than 50% of those come from <1% of pixels, then it is considered to be noise-dominated and hence unusable.
| Quadrant | # 1 sec bins | Bins with >0 counts | Bins with >2000 counts | High rate bins dominated by noise | Noise dominated (total time) | Noise dominated (detector-on time) | Marked lightcurve |
|---|---|---|---|---|---|---|---|
| A | 7624 | 7314 | 1 | 1 | 0.01% | 0.01% | 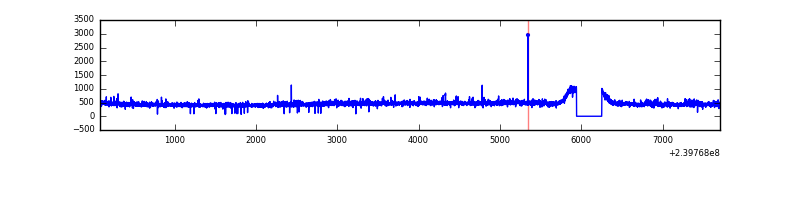 |
| B | 7624 | 7313 | 41 | 41 | 0.54% | 0.56% | 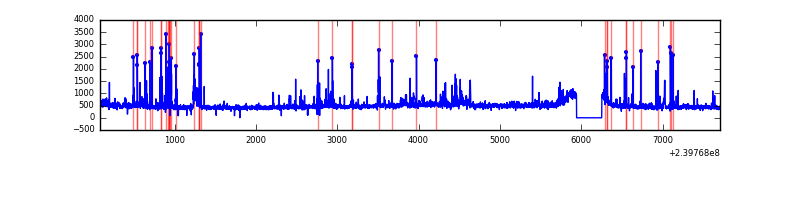 |
| C | 7624 | 7314 | 0 | 0 | 0.00% | 0.00% | 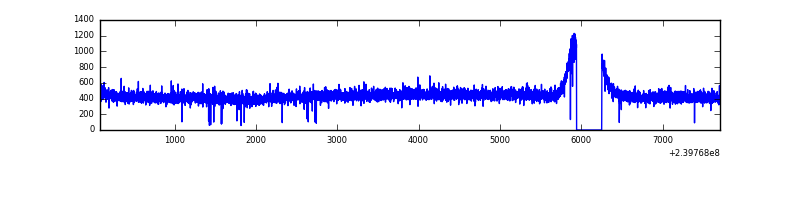 |
| D | 7624 | 7312 | 631 | 631 | 8.28% | 8.63% | 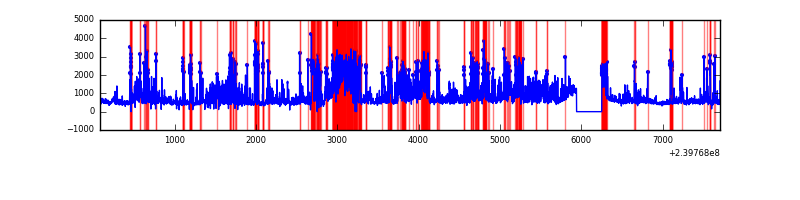 |
Top three noisy pixels from each quadrant. If the there are fewer than three noisy pixels in the level2.evt file, extra rows are filled as -1
| Pixel properties | Quadrant properties | ||||||
|---|---|---|---|---|---|---|---|
| Quadrant | DetID | PixID | Counts | Sigma | Mean | Median | Sigma |
| A | 8 | 15 | 105659 | 599.92 | 846 | 827 | 174.7 |
| A | 0 | 226 | 7612 | 38.83 | 846 | 827 | 174.7 |
| A | 13 | 253 | 7541 | 38.42 | 846 | 827 | 174.7 |
| B | 10 | 247 | 229488 | 1368.84 | 854 | 833 | 167.0 |
| B | 4 | 81 | 225151 | 1342.88 | 854 | 833 | 167.0 |
| B | 0 | 214 | 41992 | 246.4 | 854 | 833 | 167.0 |
| C | 13 | 61 | 6182 | 27.72 | 822 | 827 | 193.2 |
| C | 8 | 222 | 5527 | 24.33 | 822 | 827 | 193.2 |
| C | 14 | 67 | 5431 | 23.84 | 822 | 827 | 193.2 |
| D | 2 | 16 | 2635075 | 12575.42 | 783 | 765 | 209.5 |
| D | 1 | 52 | 522272 | 2489.52 | 783 | 765 | 209.5 |
| D | 1 | 20 | 225934 | 1074.89 | 783 | 765 | 209.5 |
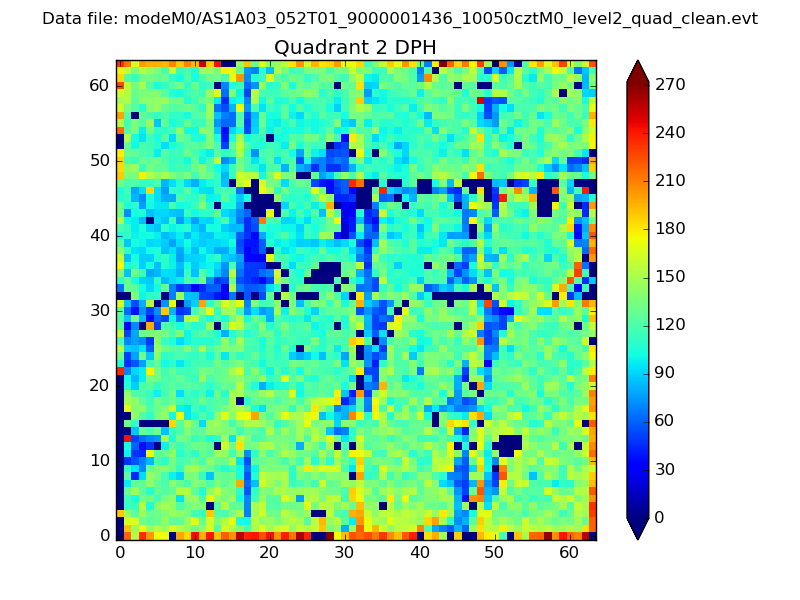
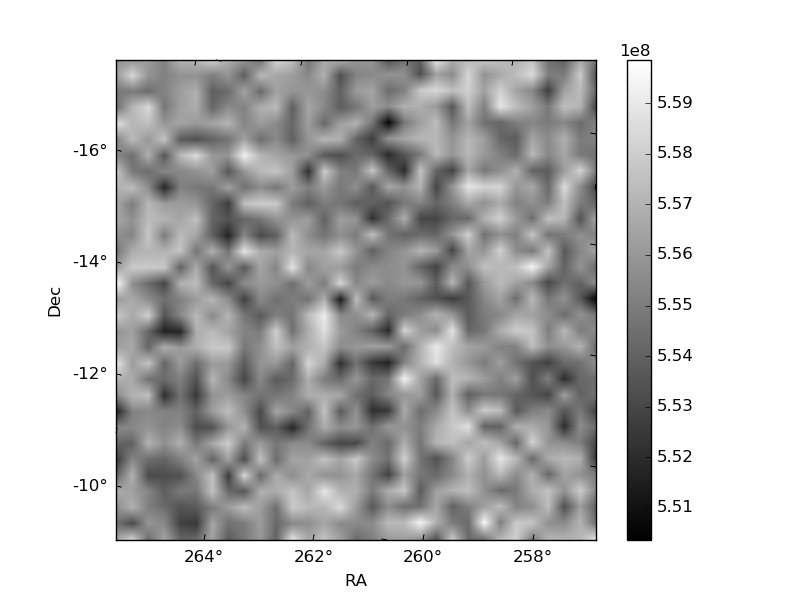
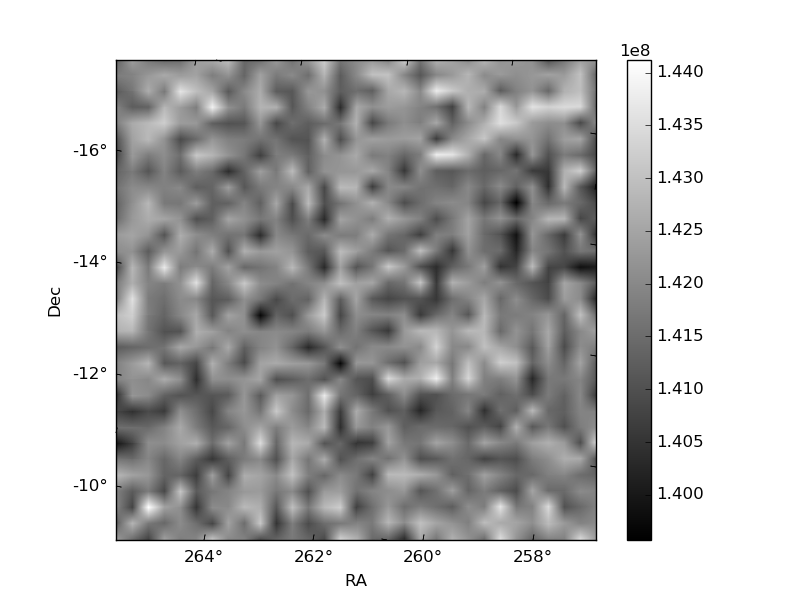
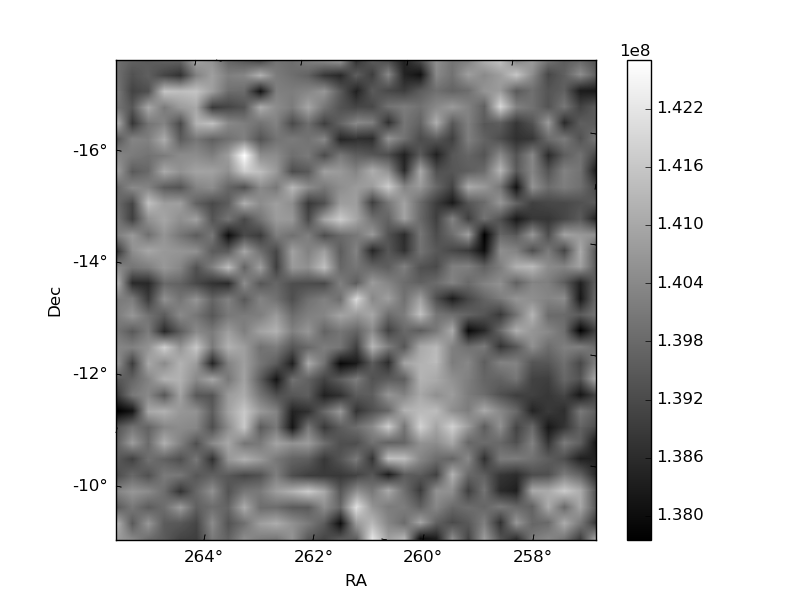
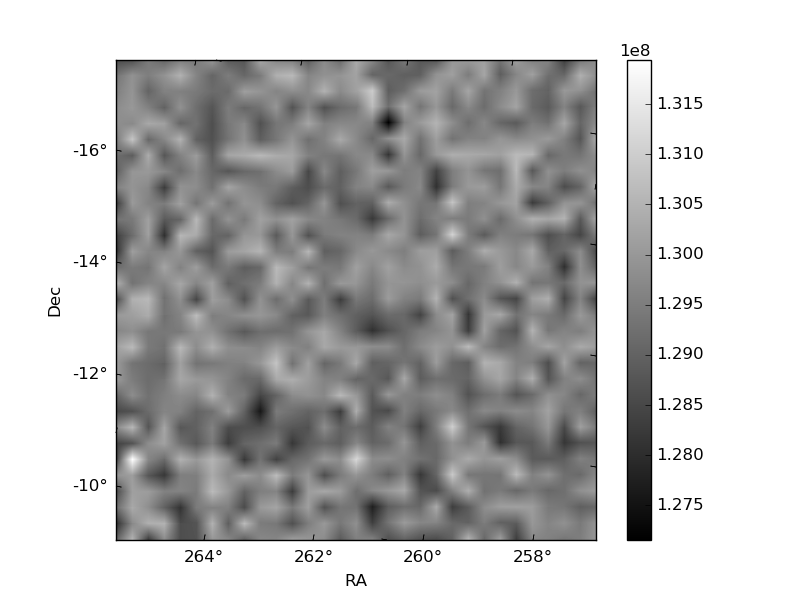
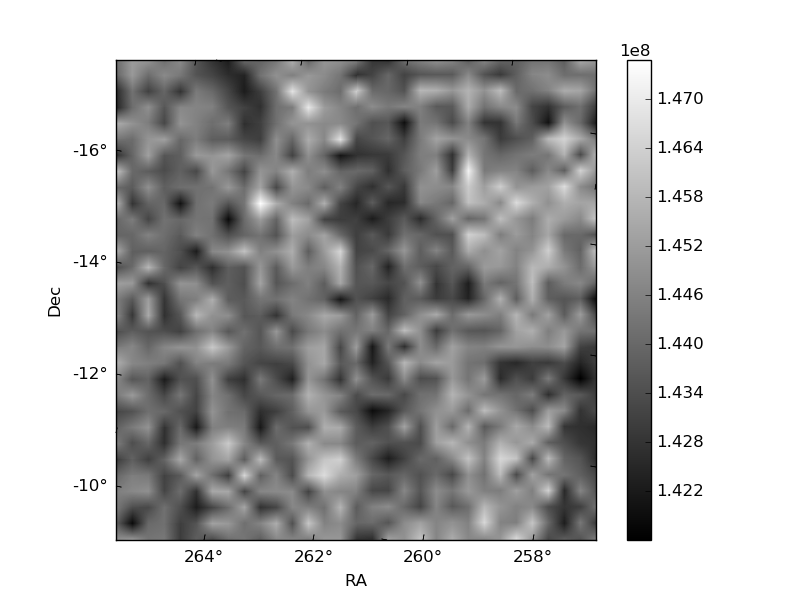
Histogram calculated using DETX and DETY for each event in the final _common_clean file
| Quadrant A | 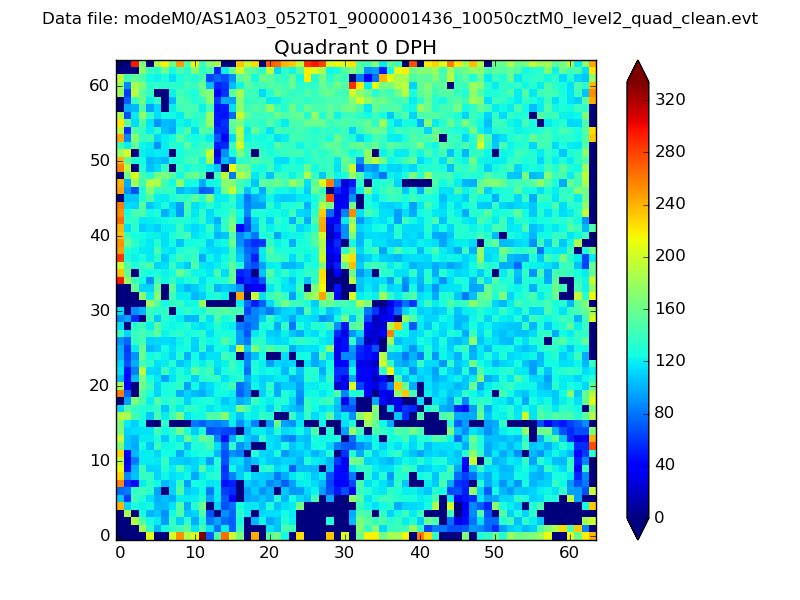 |
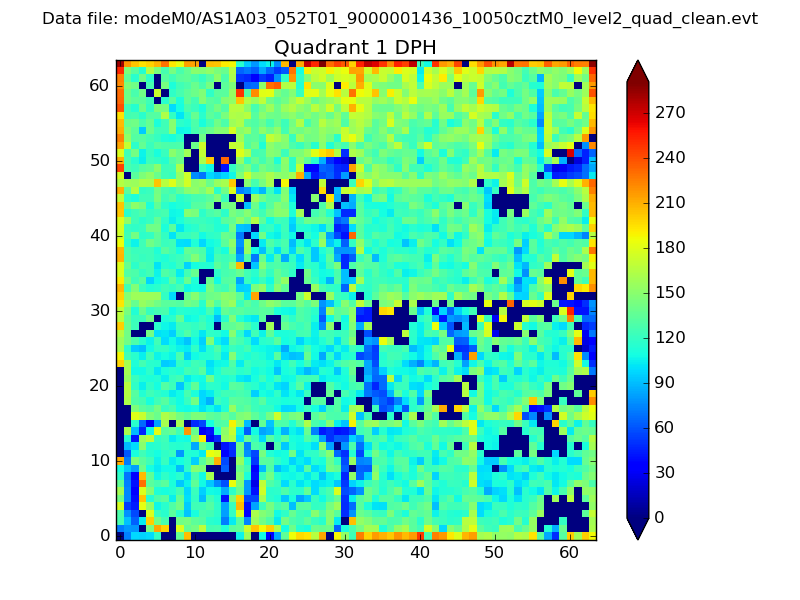 |
Quadrant B |
|---|---|---|---|
| Quadrant D | 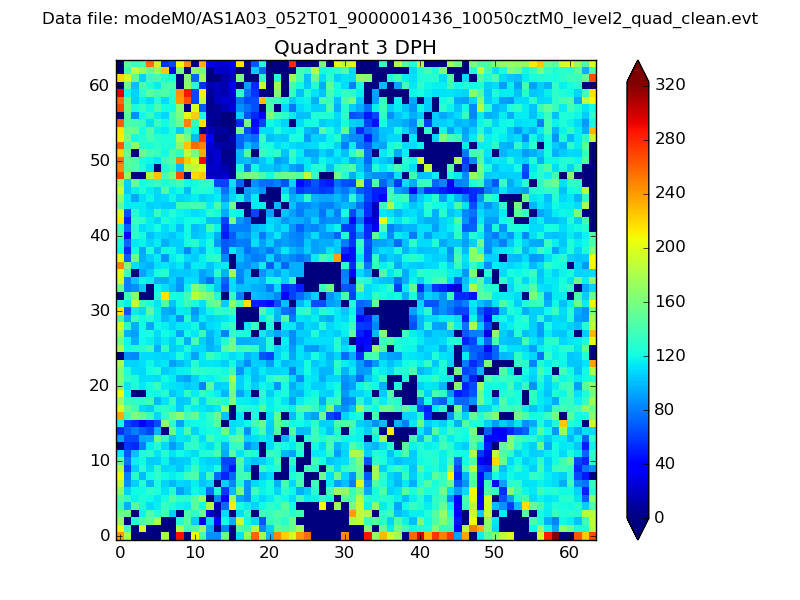 |
 |
Quadrant C |
| Plot type | Count rate plots | Images |
|---|---|---|
| Comparison with Poisson distribution Blue bars denote a histogram of data divided into 1 sec bins. Red curve is a Poisson curve with rate = median count rate of data. |
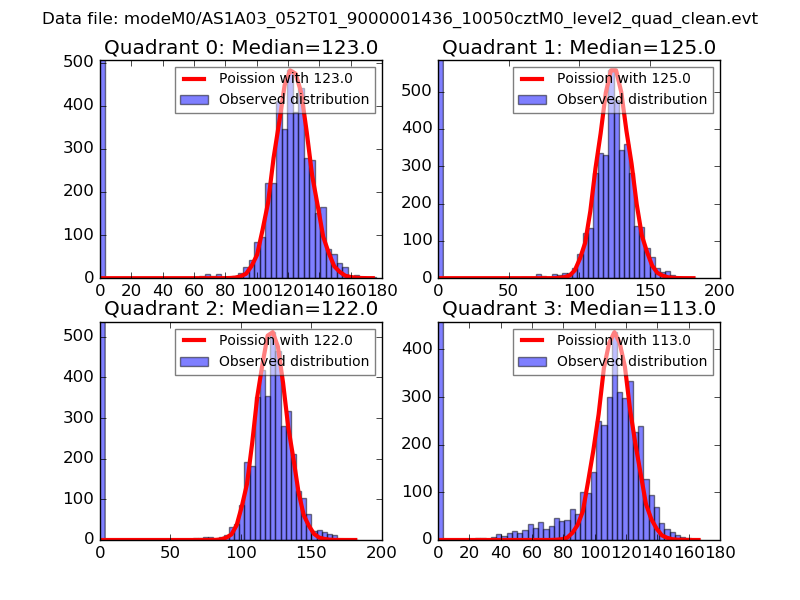 |
 |
| Quadrant-wise count rates Data is divided into 100 sec bins |
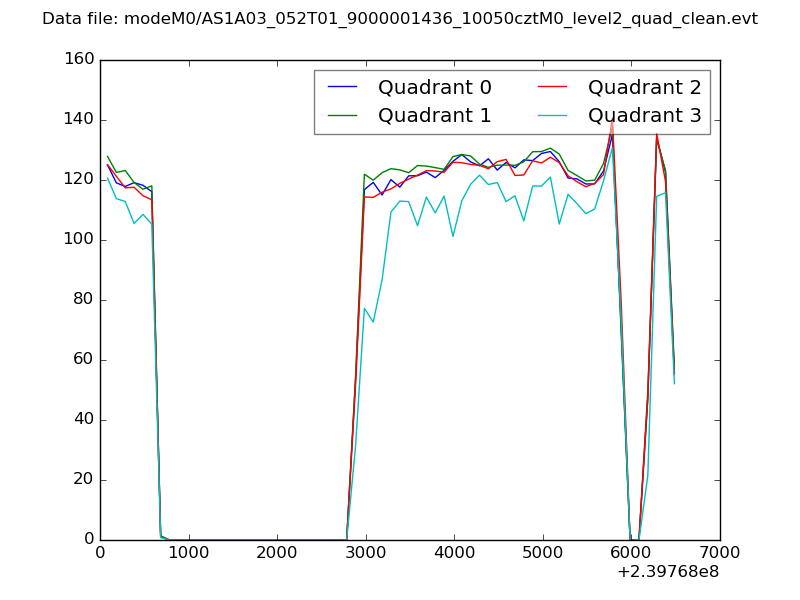 |
|
| Module-wise count rates for Quadrant A Data is divided into 100 sec bins |
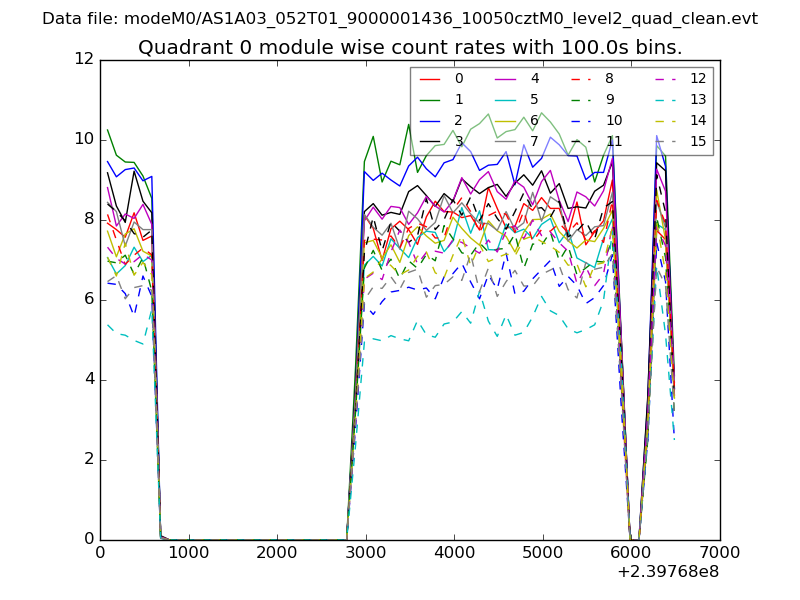 |
 |
| Module-wise count rates for Quadrant B Data is divided into 100 sec bins |
 |
 |
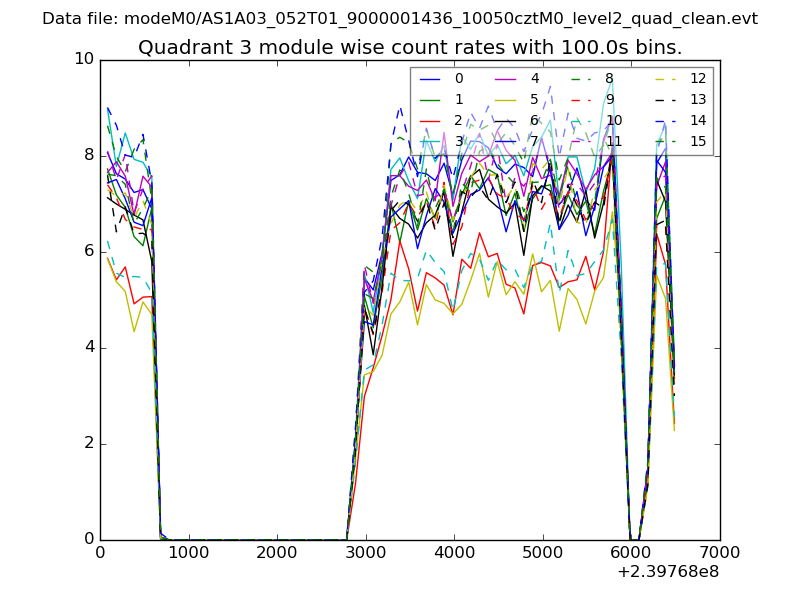
| Module-wise count rates for Quadrant C Data is divided into 100 sec bins |
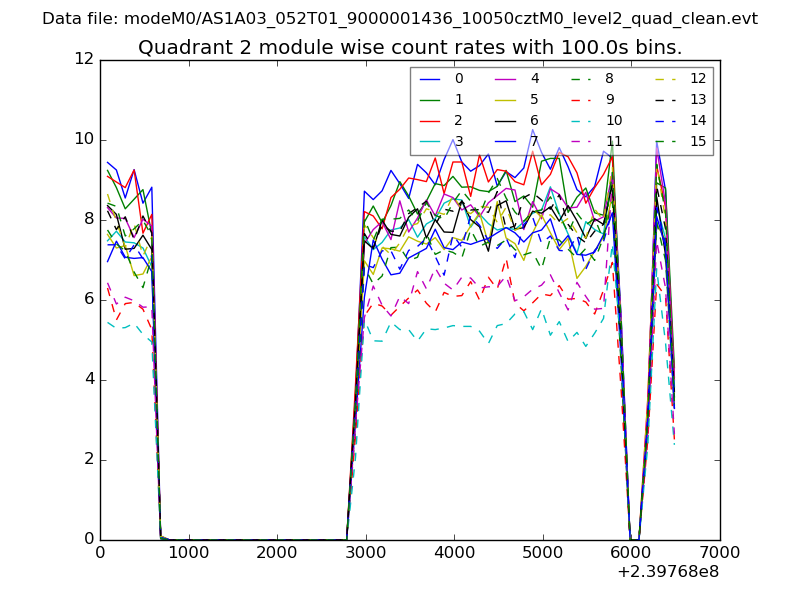 |
 |
| Module-wise count rates for Quadrant D Data is divided into 100 sec bins |
 |
 |
| Parameter | Plot |
|---|---|
| CZT HV Monitor | 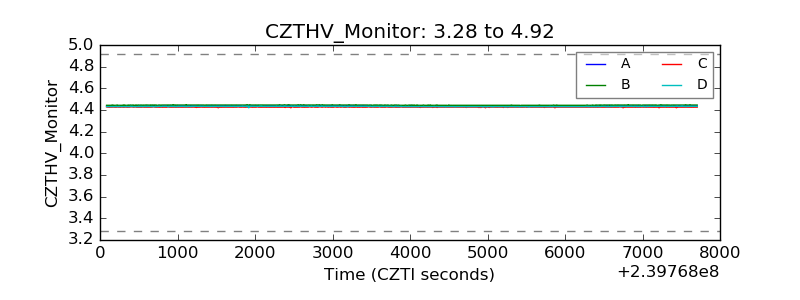 |
| D_VDD | 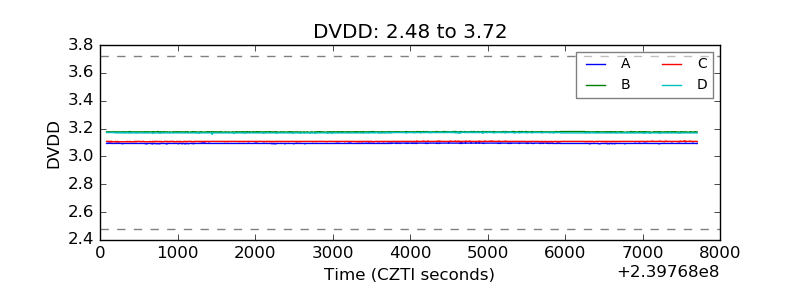 |
| Temperature 1 |  |
| Veto HV Monitor | 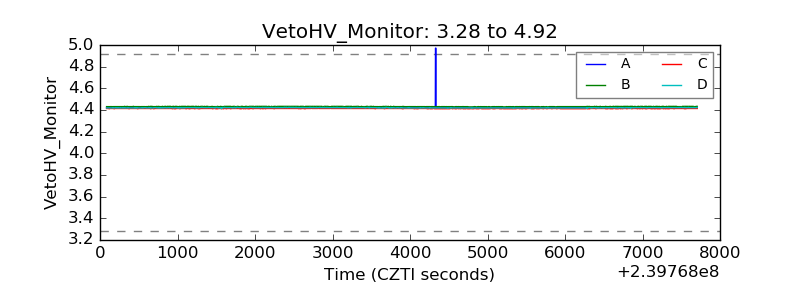 |
| Veto LLD | 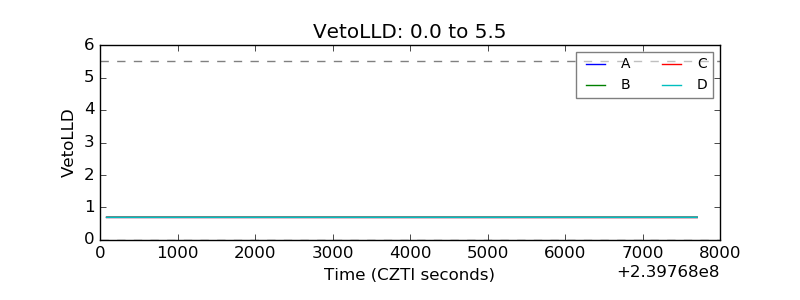 |
| Alpha Counter | 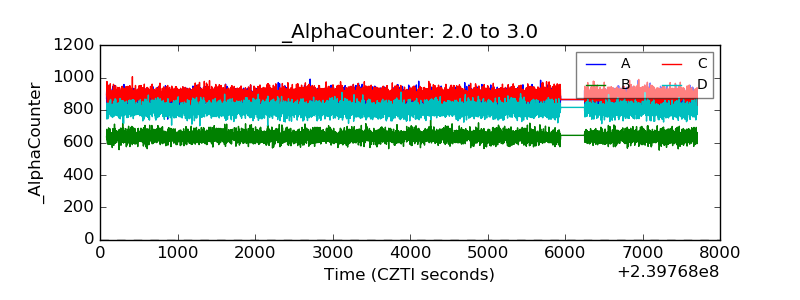 |
| _CPM_Rate | 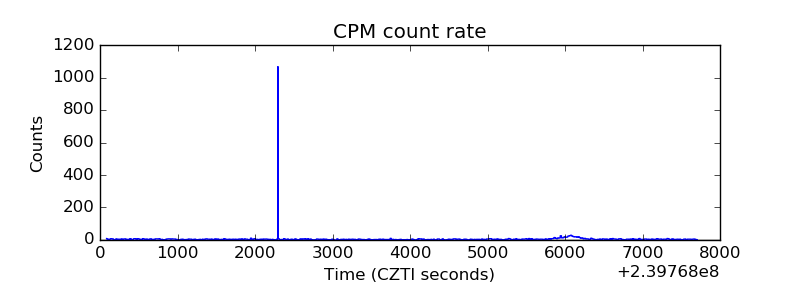 |
| CZT Counter | 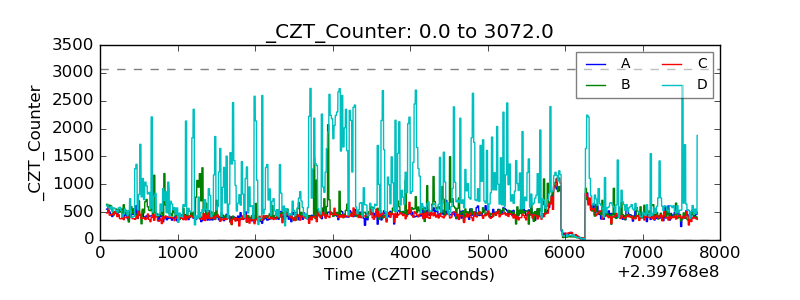 |
| +2.5 Volts monitor |  |
| +5 Volts monitor |  |
| _ROLL_ROT | 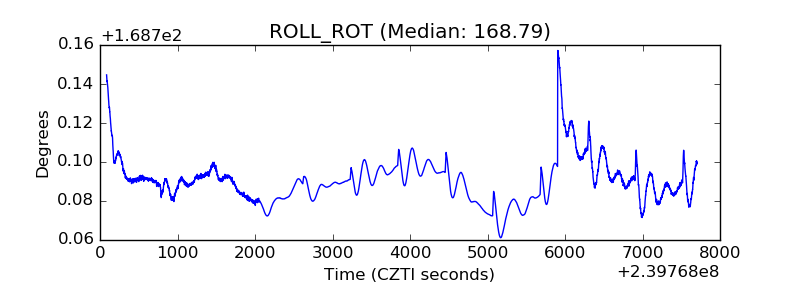 |
| _Roll_DEC | 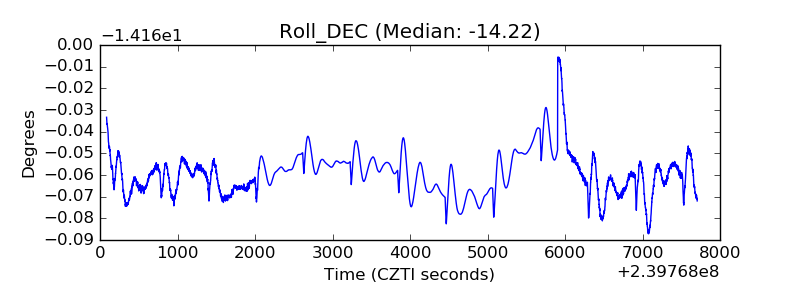 |
| _Roll_RA | 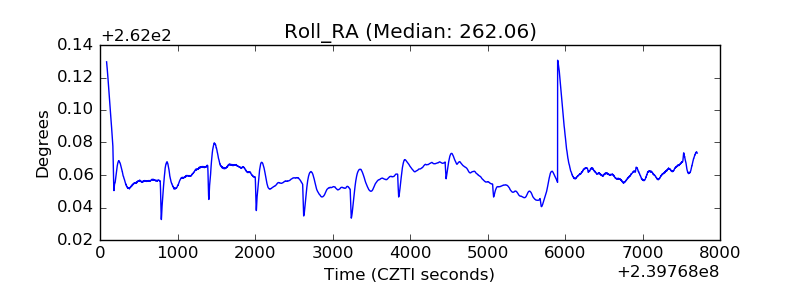 |
| Veto Counter |  |