| Param | Original file | Final file |
|---|---|---|
| Filename | modeM0/AS1A03_052T01_9000001436_10053cztM0_level2.evt | modeM0/AS1A03_052T01_9000001436_10053cztM0_level2_quad_clean.evt |
| Size (bytes) | 189,149,760 | 28,437,120 |
| Size | 180.4 MB | 27.1 MB |
| Events in quadrant A | 1,284,736 | 175,426 |
| Events in quadrant B | 1,391,756 | 176,725 |
| Events in quadrant C | 1,198,386 | 176,333 |
| Events in quadrant D | 1,666,949 | 138,725 |
| Mode SS | |||
|---|---|---|---|
| Quadrant | BADHDUFLAG | Total packets | Discarded packets |
| A | 0 | 98 | 44 |
| B | 0 | 96 | 38 |
| C | 0 | 98 | 42 |
| D | 0 | 98 | 36 |
| Mode M0 | |||
|---|---|---|---|
| Quadrant | BADHDUFLAG | Total packets | Discarded packets |
| A | 0 | 10177 | 4467 |
| B | 0 | 11171 | 5259 |
| C | 0 | 9823 | 4198 |
| D | 0 | 15180 | 8606 |
| Quadrant | Total seconds | Saturated seconds | Saturation percentage |
|---|---|---|---|
| A | 2816 | 1 | 0.035511% |
| B | 2705 | 27 | 0.998152% |
| C | 2811 | 1 | 0.035575% |
| D | 2381 | 35 | 1.469971% |
Noise dominated data is calculated using 1-second bins in cleaned event files. If a bin has >2000 counts, and if more than 50% of those come from <1% of pixels, then it is considered to be noise-dominated and hence unusable.
| Quadrant | # 1 sec bins | Bins with >0 counts | Bins with >2000 counts | High rate bins dominated by noise | Noise dominated (total time) | Noise dominated (detector-on time) | Marked lightcurve |
|---|---|---|---|---|---|---|---|
| A | 4930 | 3578 | 1 | 1 | 0.02% | 0.03% | 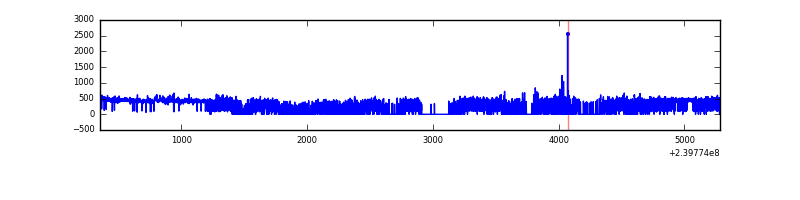 |
| B | 4930 | 3457 | 13 | 13 | 0.26% | 0.38% | 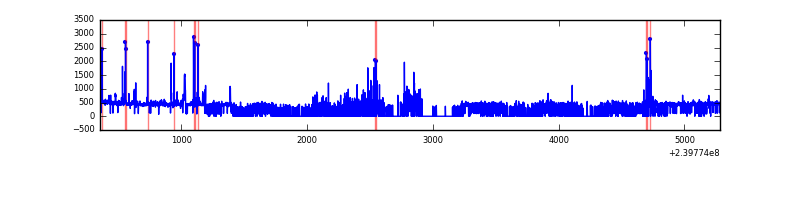 |
| C | 4930 | 3564 | 0 | 0 | 0.00% | 0.00% | 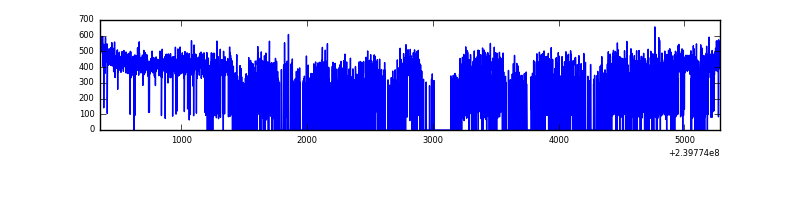 |
| D | 4931 | 3072 | 27 | 27 | 0.55% | 0.88% | 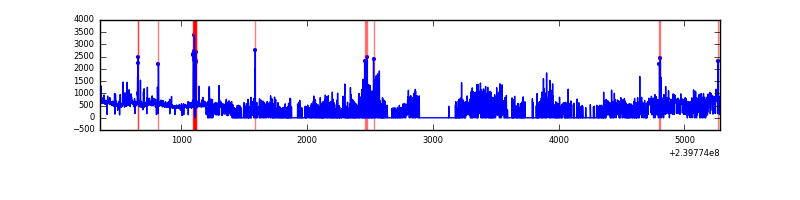 |
Top three noisy pixels from each quadrant. If the there are fewer than three noisy pixels in the level2.evt file, extra rows are filled as -1
| Pixel properties | Quadrant properties | ||||||
|---|---|---|---|---|---|---|---|
| Quadrant | DetID | PixID | Counts | Sigma | Mean | Median | Sigma |
| A | 8 | 15 | 57760 | 857.33 | 316 | 309 | 67.0 |
| A | 15 | 174 | 8415 | 120.96 | 316 | 309 | 67.0 |
| A | 13 | 248 | 3035 | 40.68 | 316 | 309 | 67.0 |
| B | 4 | 81 | 83215 | 1382.97 | 307 | 299 | 60.0 |
| B | 10 | 247 | 82250 | 1366.87 | 307 | 299 | 60.0 |
| B | 0 | 246 | 22227 | 365.74 | 307 | 299 | 60.0 |
| C | 13 | 61 | 2352 | 28.17 | 306 | 307 | 72.6 |
| C | 14 | 67 | 2295 | 27.39 | 306 | 307 | 72.6 |
| C | 8 | 222 | 1928 | 22.33 | 306 | 307 | 72.6 |
| D | 2 | 16 | 410506 | 5893.3 | 254 | 248 | 69.6 |
| D | 8 | 195 | 88703 | 1270.64 | 254 | 248 | 69.6 |
| D | 1 | 52 | 83431 | 1194.91 | 254 | 248 | 69.6 |
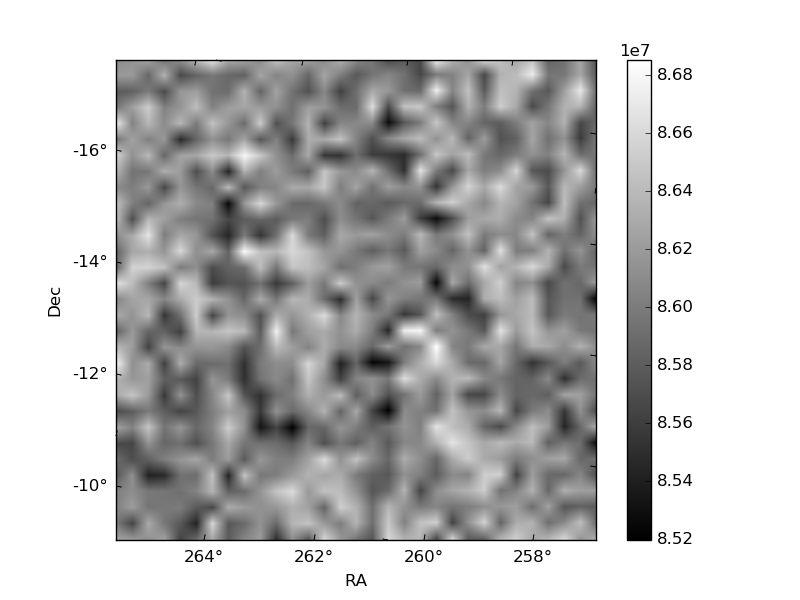
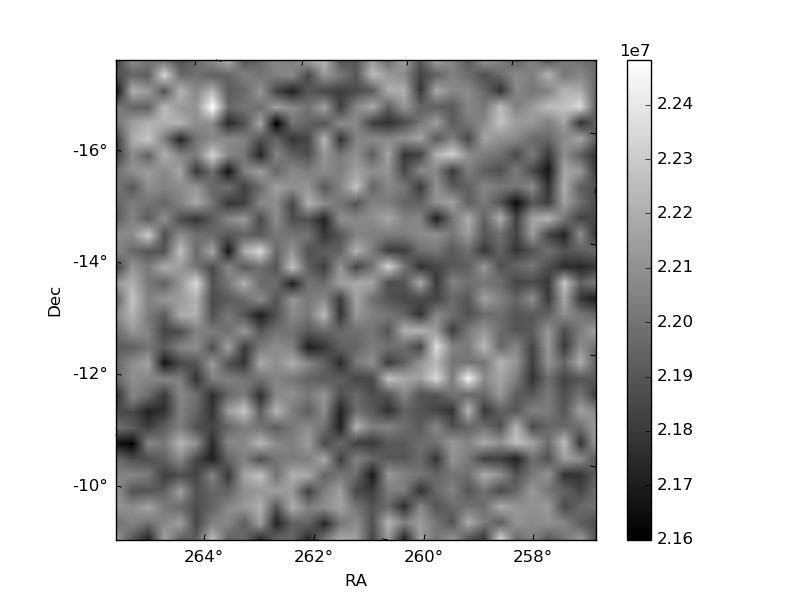
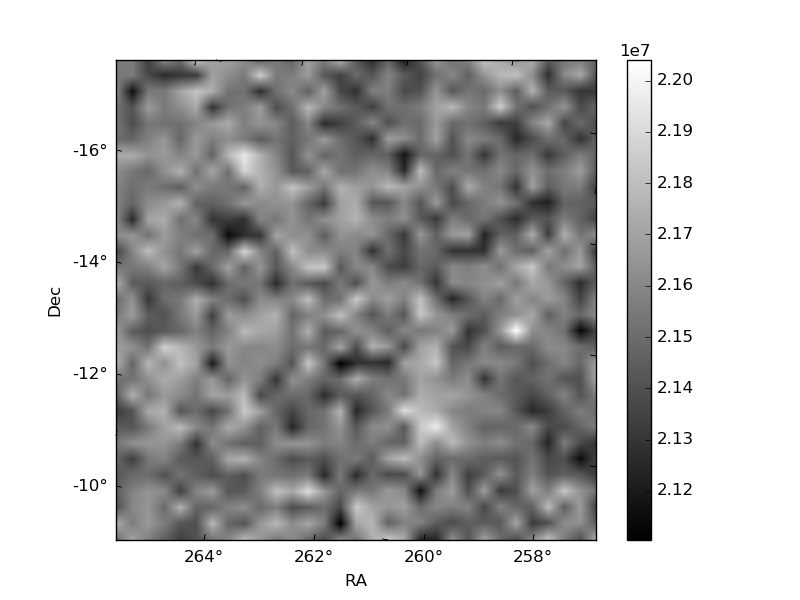
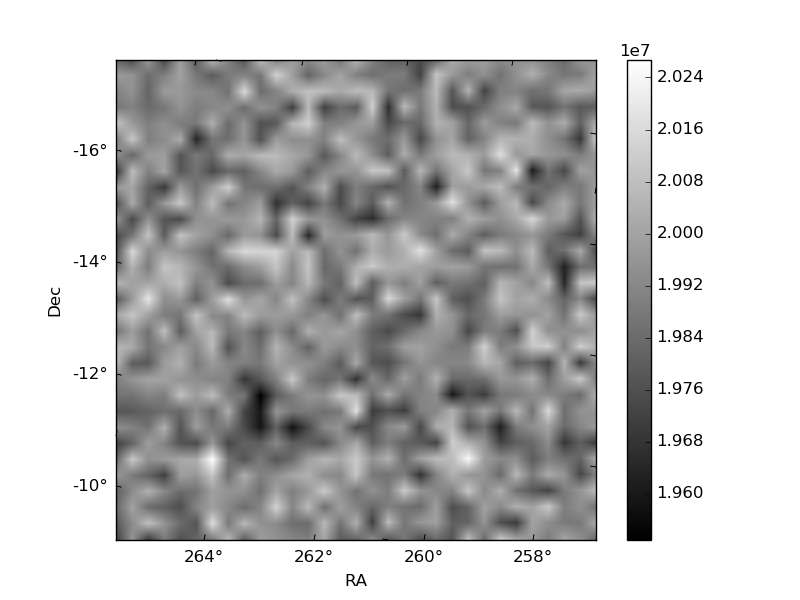
Histogram calculated using DETX and DETY for each event in the final _common_clean file
| Quadrant A | 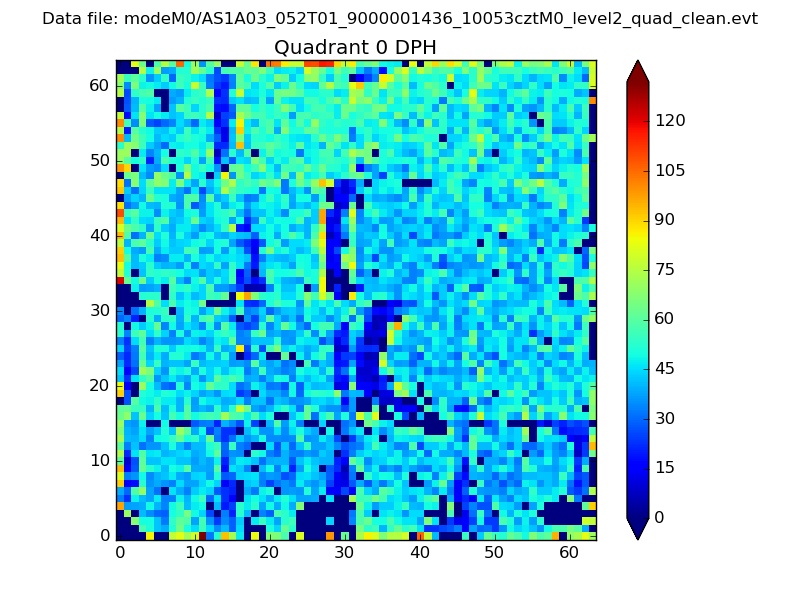 |
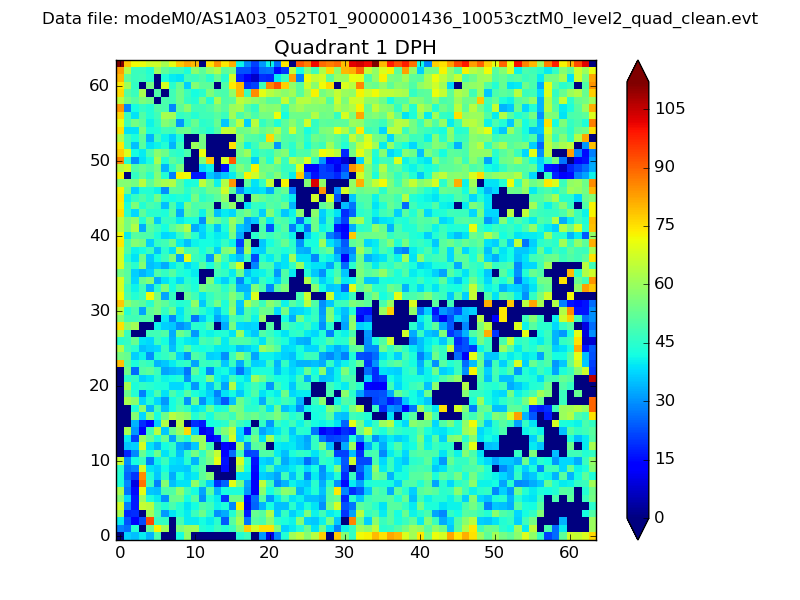 |
Quadrant B |
|---|---|---|---|
| Quadrant D | 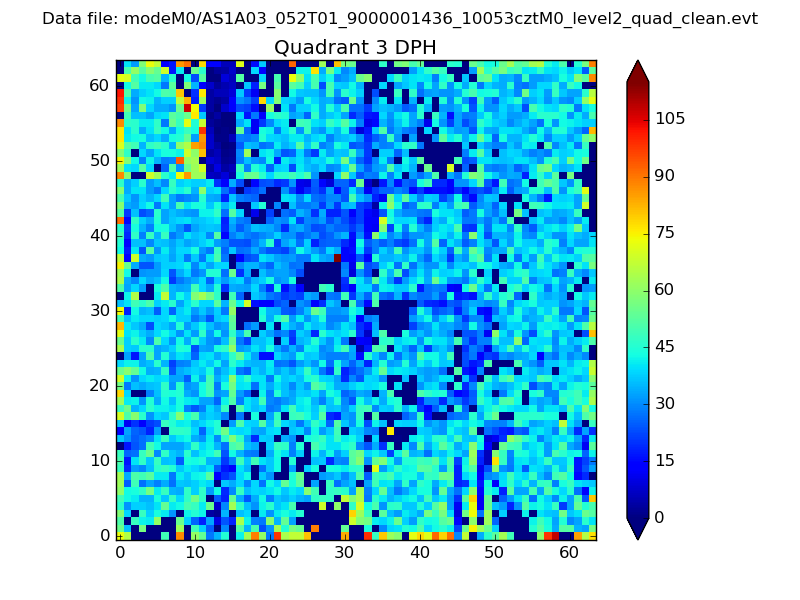 |
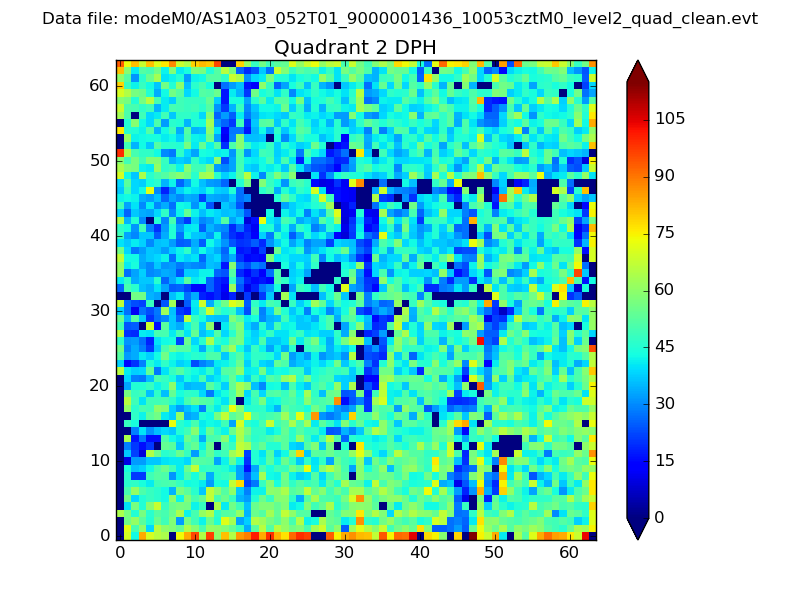 |
Quadrant C |
| Plot type | Count rate plots | Images |
|---|---|---|
| Comparison with Poisson distribution Blue bars denote a histogram of data divided into 1 sec bins. Red curve is a Poisson curve with rate = median count rate of data. |
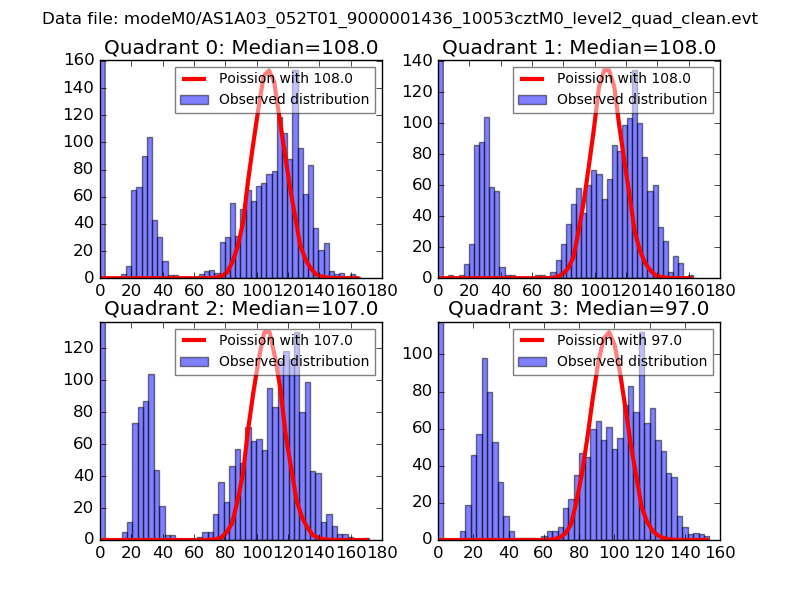 |
 |
| Quadrant-wise count rates Data is divided into 100 sec bins |
 |
|
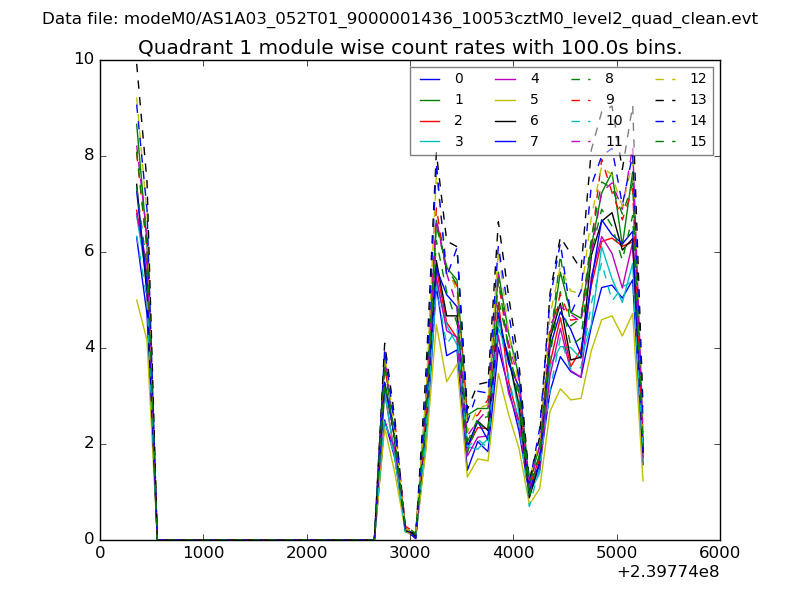
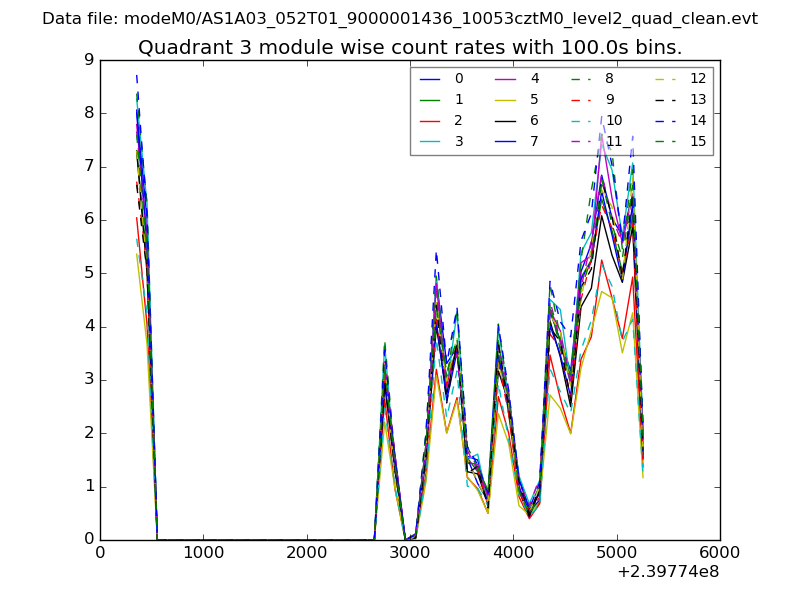
| Module-wise count rates for Quadrant A Data is divided into 100 sec bins |
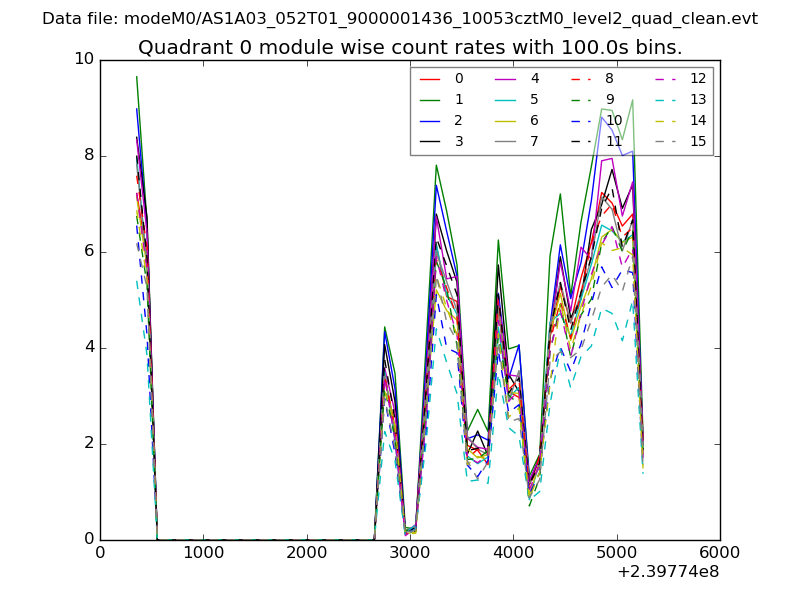 |
 |
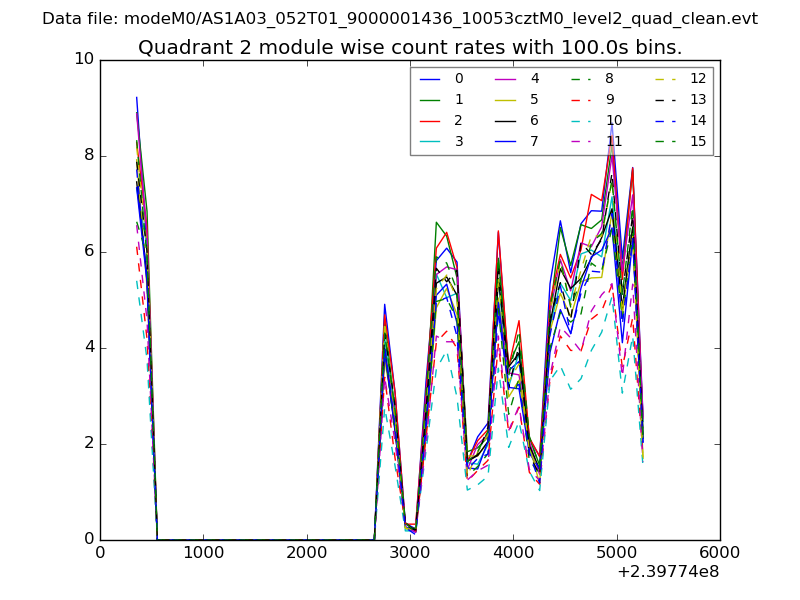
| Module-wise count rates for Quadrant B Data is divided into 100 sec bins |
 |
 |
| Module-wise count rates for Quadrant C Data is divided into 100 sec bins |
 |
 |
| Module-wise count rates for Quadrant D Data is divided into 100 sec bins |
 |
 |
| Parameter | Plot |
|---|---|
| CZT HV Monitor | 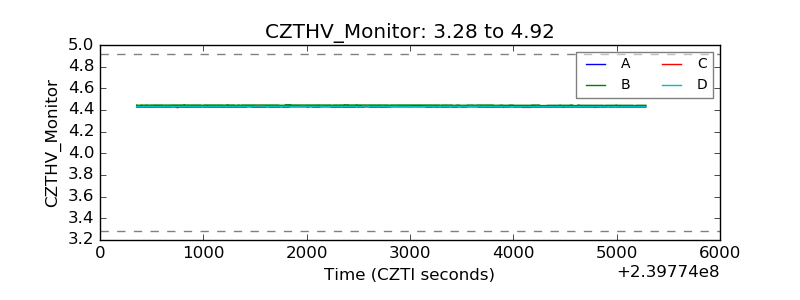 |
| D_VDD | 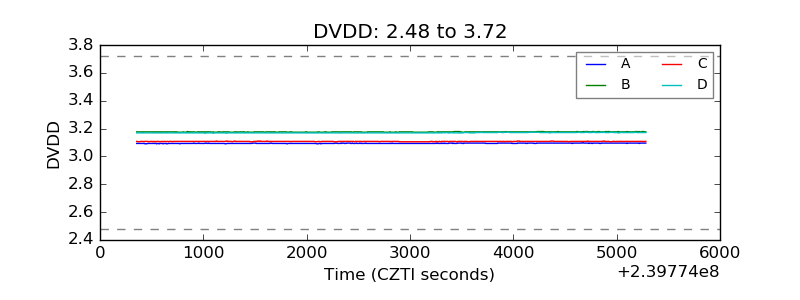 |
| Temperature 1 | 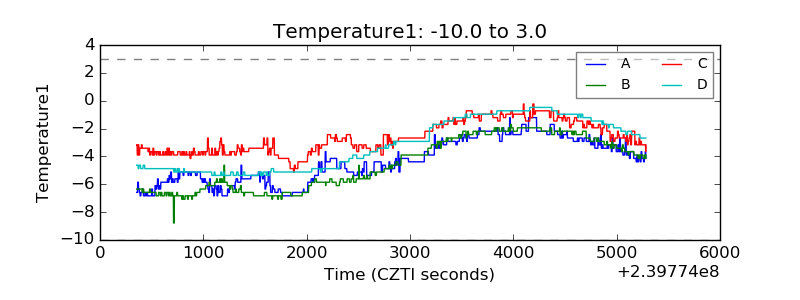 |
| Veto HV Monitor | 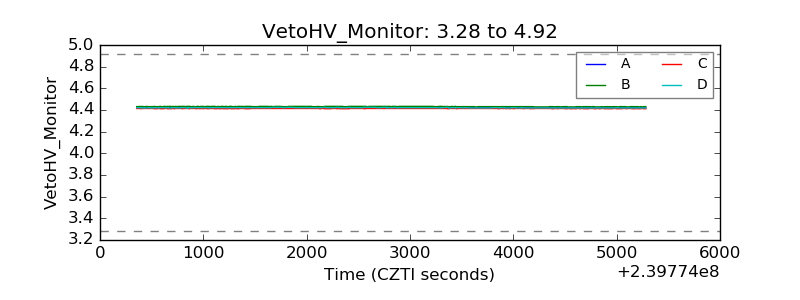 |
| Veto LLD | 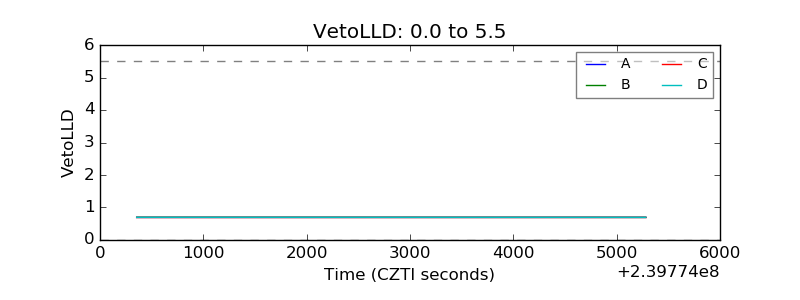 |
| Alpha Counter |  |
| _CPM_Rate |  |
| CZT Counter | 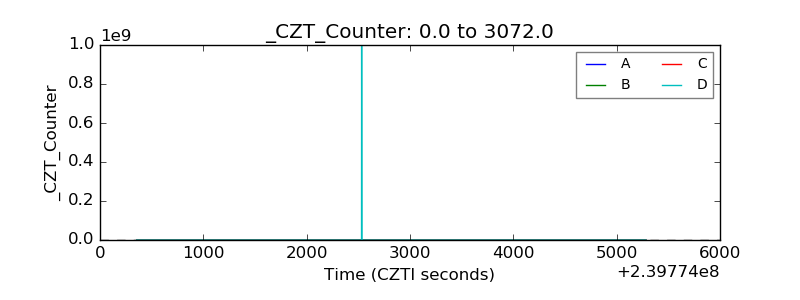 |
| +2.5 Volts monitor |  |
| +5 Volts monitor |  |
| _ROLL_ROT | 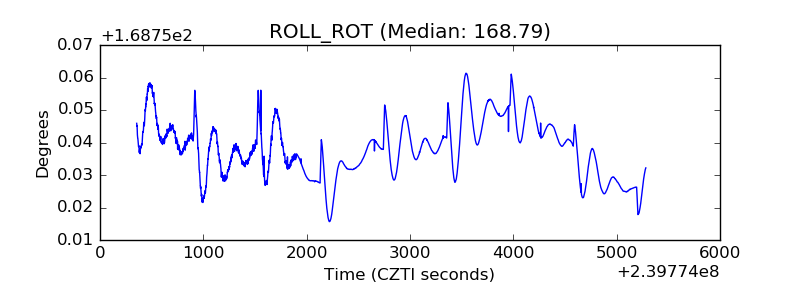 |
| _Roll_DEC | 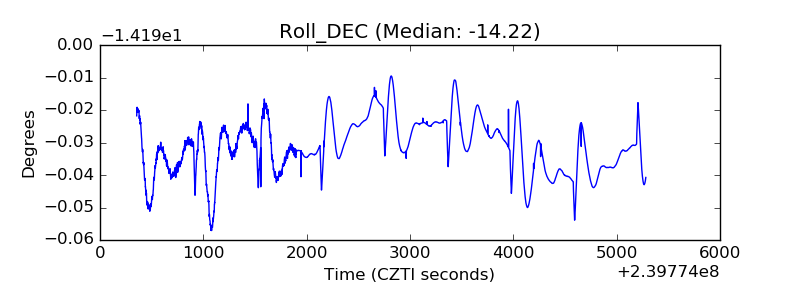 |
| _Roll_RA | 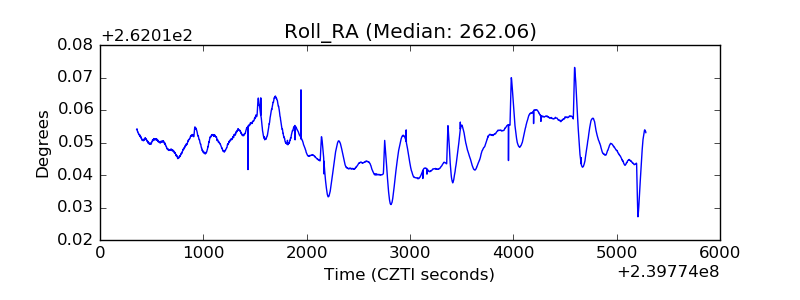 |
| Veto Counter | 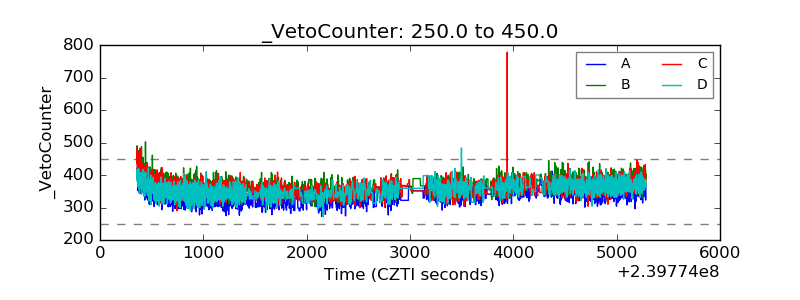 |