| Param | Original file | Final file |
|---|---|---|
| Filename | modeM0/AS1A03_052T01_9000001436_10054cztM0_level2.evt | modeM0/AS1A03_052T01_9000001436_10054cztM0_level2_quad_clean.evt |
| Size (bytes) | 297,515,520 | 45,872,640 |
| Size | 283.7 MB | 43.7 MB |
| Events in quadrant A | 1,832,650 | 283,166 |
| Events in quadrant B | 2,092,526 | 287,885 |
| Events in quadrant C | 1,644,975 | 283,655 |
| Events in quadrant D | 3,177,456 | 262,263 |
| Mode SS | |||
|---|---|---|---|
| Quadrant | BADHDUFLAG | Total packets | Discarded packets |
| A | 0 | 80 | 8 |
| B | 0 | 80 | 0 |
| C | 0 | 80 | 2 |
| D | 0 | 80 | 2 |
| Mode M0 | |||
|---|---|---|---|
| Quadrant | BADHDUFLAG | Total packets | Discarded packets |
| A | 0 | 8373 | 365 |
| B | 0 | 9197 | 416 |
| C | 0 | 8023 | 287 |
| D | 0 | 12850 | 675 |
| Quadrant | Total seconds | Saturated seconds | Saturation percentage |
|---|---|---|---|
| A | 3849 | 25 | 0.649519% |
| B | 3845 | 46 | 1.196359% |
| C | 3863 | 0 | 0.000000% |
| D | 3818 | 111 | 2.907281% |
Noise dominated data is calculated using 1-second bins in cleaned event files. If a bin has >2000 counts, and if more than 50% of those come from <1% of pixels, then it is considered to be noise-dominated and hence unusable.
| Quadrant | # 1 sec bins | Bins with >0 counts | Bins with >2000 counts | High rate bins dominated by noise | Noise dominated (total time) | Noise dominated (detector-on time) | Marked lightcurve |
|---|---|---|---|---|---|---|---|
| A | 4007 | 3979 | 18 | 18 | 0.45% | 0.45% | 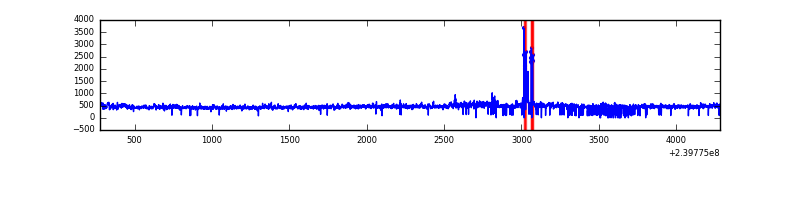 |
| B | 4007 | 3969 | 24 | 24 | 0.60% | 0.60% | 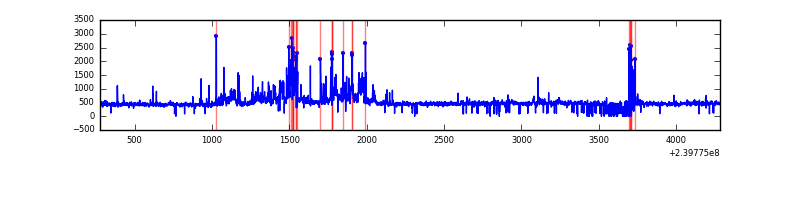 |
| C | 4007 | 3982 | 0 | 0 | 0.00% | 0.00% | 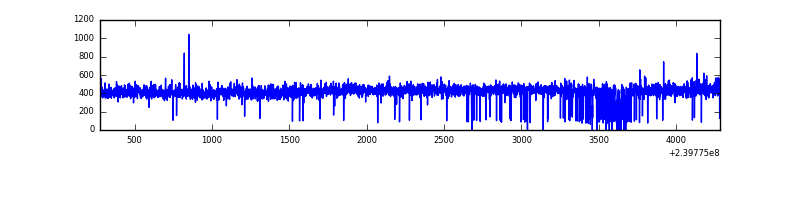 |
| D | 4007 | 3973 | 104 | 104 | 2.60% | 2.62% | 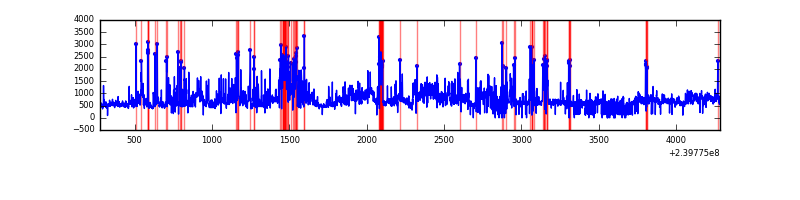 |
Top three noisy pixels from each quadrant. If the there are fewer than three noisy pixels in the level2.evt file, extra rows are filled as -1
| Pixel properties | Quadrant properties | ||||||
|---|---|---|---|---|---|---|---|
| Quadrant | DetID | PixID | Counts | Sigma | Mean | Median | Sigma |
| A | 8 | 15 | 101416 | 1101.15 | 435 | 426 | 91.7 |
| A | 15 | 174 | 56081 | 606.84 | 435 | 426 | 91.7 |
| A | 0 | 226 | 3918 | 38.08 | 435 | 426 | 91.7 |
| B | 4 | 81 | 288989 | 3437.53 | 433 | 423 | 83.9 |
| B | 10 | 247 | 63311 | 749.15 | 433 | 423 | 83.9 |
| B | 0 | 246 | 37887 | 446.29 | 433 | 423 | 83.9 |
| C | 8 | 222 | 3457 | 30.93 | 419 | 421 | 98.2 |
| C | 13 | 61 | 3198 | 28.29 | 419 | 421 | 98.2 |
| C | 14 | 67 | 2151 | 17.62 | 419 | 421 | 98.2 |
| D | 2 | 16 | 1061318 | 10093.73 | 410 | 398 | 105.1 |
| D | 1 | 20 | 161364 | 1531.45 | 410 | 398 | 105.1 |
| D | 8 | 195 | 160742 | 1525.53 | 410 | 398 | 105.1 |
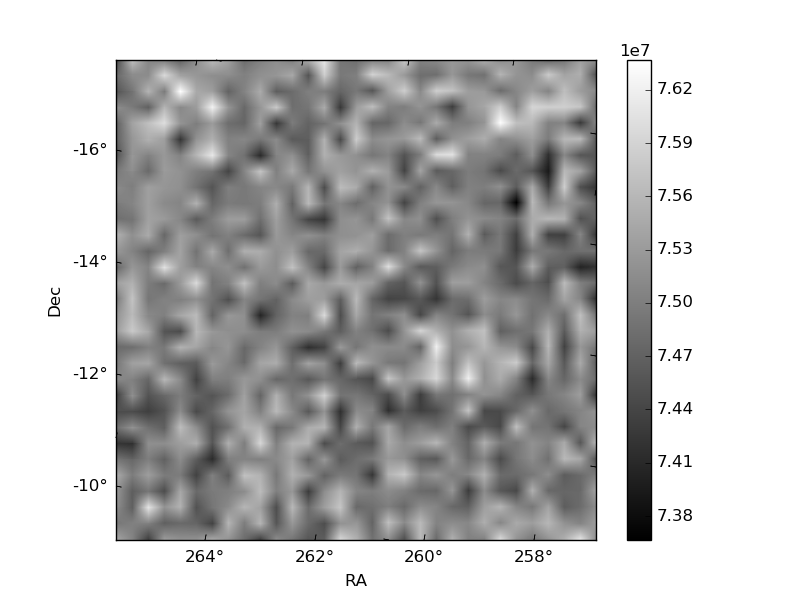
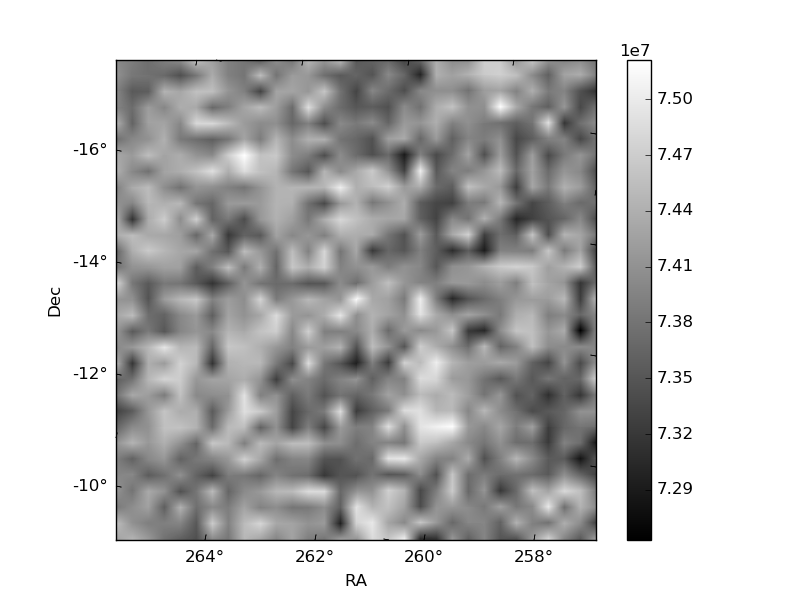
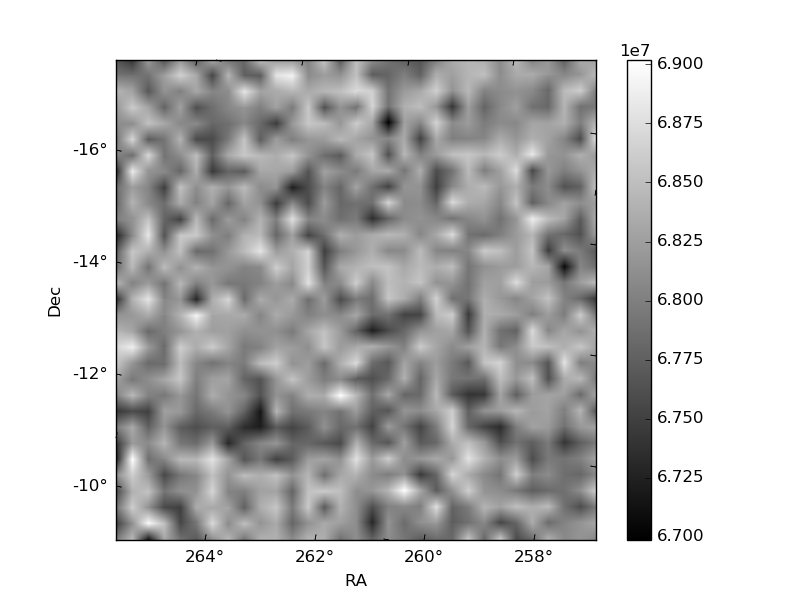
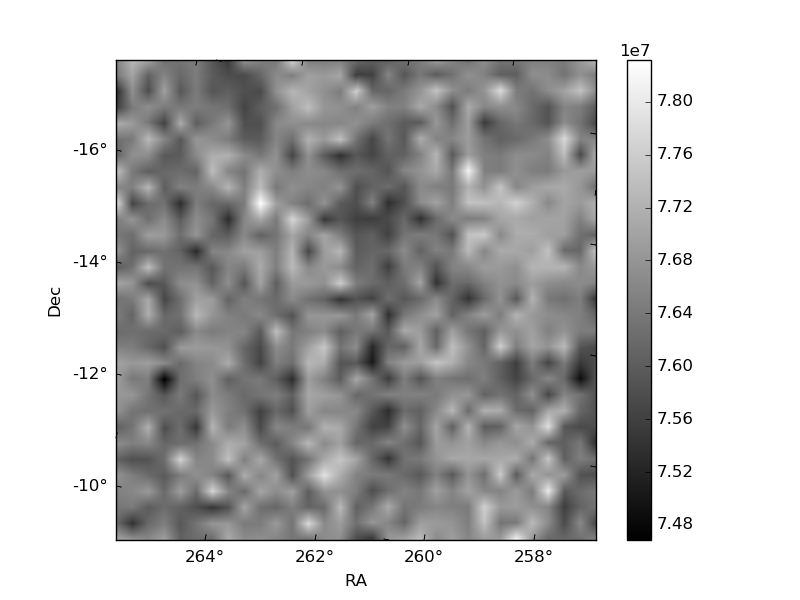
Histogram calculated using DETX and DETY for each event in the final _common_clean file
| Quadrant A |  |
 |
Quadrant B |
|---|---|---|---|
| Quadrant D |  |
 |
Quadrant C |
| Plot type | Count rate plots | Images |
|---|---|---|
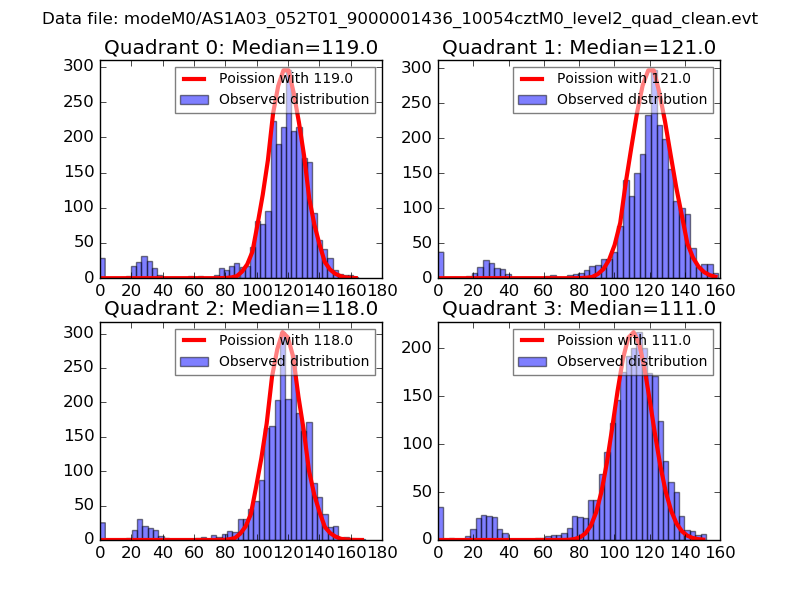
| Comparison with Poisson distribution Blue bars denote a histogram of data divided into 1 sec bins. Red curve is a Poisson curve with rate = median count rate of data. |
 |
 |
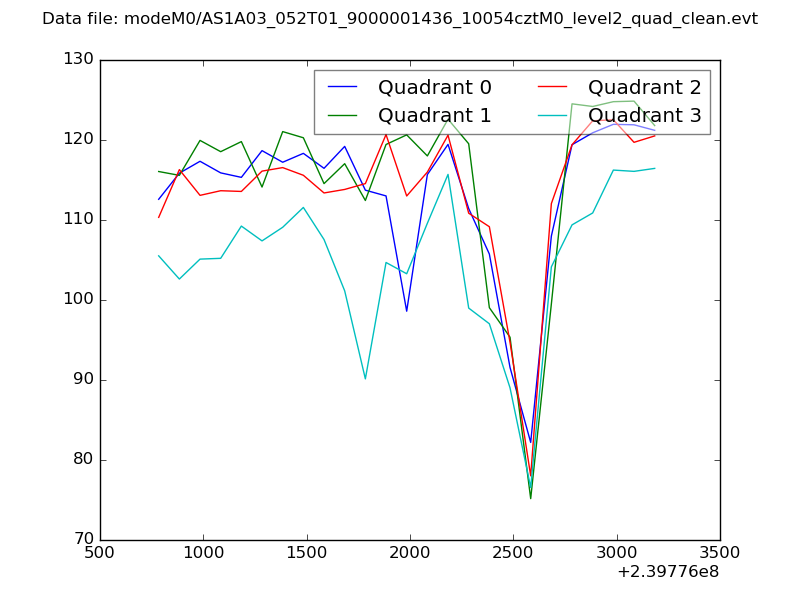
| Quadrant-wise count rates Data is divided into 100 sec bins |
 |
|
| Module-wise count rates for Quadrant A Data is divided into 100 sec bins |
 |
 |
| Module-wise count rates for Quadrant B Data is divided into 100 sec bins |
 |
 |
| Module-wise count rates for Quadrant C Data is divided into 100 sec bins |
 |
 |
| Module-wise count rates for Quadrant D Data is divided into 100 sec bins |
 |
 |
| Parameter | Plot |
|---|---|
| CZT HV Monitor |  |
| D_VDD | 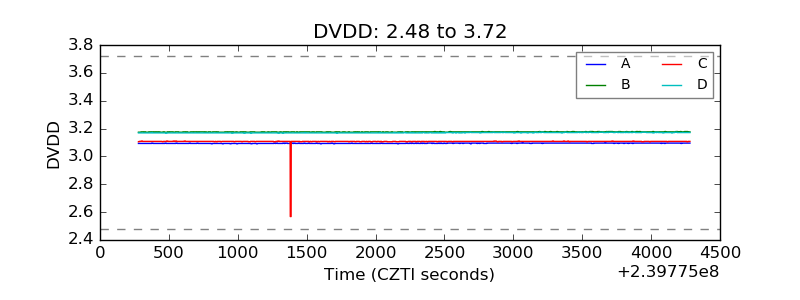 |
| Temperature 1 |  |
| Veto HV Monitor |  |
| Veto LLD |  |
| Alpha Counter | 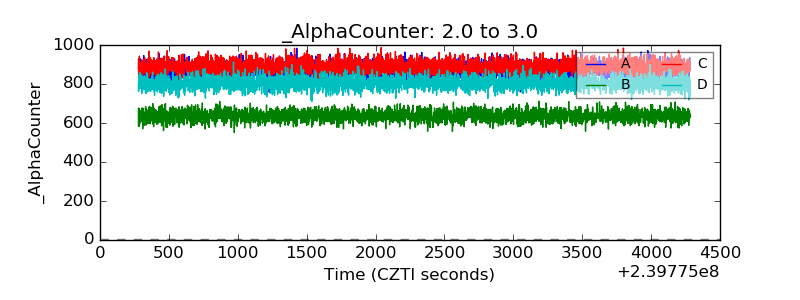 |
| _CPM_Rate | 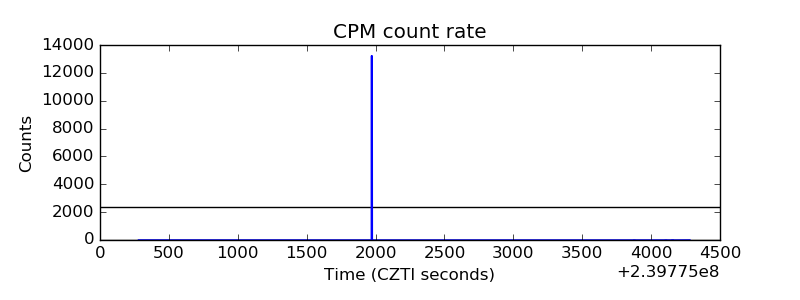 |
| CZT Counter |  |
| +2.5 Volts monitor |  |
| +5 Volts monitor |  |
| _ROLL_ROT |  |
| _Roll_DEC |  |
| _Roll_RA |  |
| Veto Counter |  |