| Param | Original file | Final file |
|---|---|---|
| Filename | modeM0/AS1A03_008T01_9000001442_10064cztM0_level2.evt | modeM0/AS1A03_008T01_9000001442_10064cztM0_level2_quad_clean.evt |
| Size (bytes) | 42,471,360 | 11,975,040 |
| Size | 40.5 MB | 11.4 MB |
| Events in quadrant A | 299,515 | 75,522 |
| Events in quadrant B | 318,318 | 80,390 |
| Events in quadrant C | 314,375 | 80,043 |
| Events in quadrant D | 301,072 | 67,649 |
| Mode M0 | |||
|---|---|---|---|
| Quadrant | BADHDUFLAG | Total packets | Discarded packets |
| A | 0 | 15971 | 14563 |
| B | 0 | 16101 | 14634 |
| C | 0 | 15908 | 14406 |
| D | 0 | 17671 | 16277 |
| Mode SS | |||
|---|---|---|---|
| Quadrant | BADHDUFLAG | Total packets | Discarded packets |
| A | 0 | 161 | 139 |
| B | 0 | 158 | 137 |
| C | 0 | 157 | 144 |
| D | 0 | 158 | 144 |
| Mode M9 | |||
|---|---|---|---|
| Quadrant | BADHDUFLAG | Total packets | Discarded packets |
| A | 0 | 5 | 3 |
| B | 0 | 6 | 5 |
| C | 0 | 5 | 4 |
| D | 0 | 6 | 5 |
| Quadrant | Total seconds | Saturated seconds | Saturation percentage |
|---|---|---|---|
| A | 700 | 1 | 0.142857% |
| B | 731 | 3 | 0.410397% |
| C | 751 | 0 | 0.000000% |
| D | 663 | 7 | 1.055807% |
Noise dominated data is calculated using 1-second bins in cleaned event files. If a bin has >2000 counts, and if more than 50% of those come from <1% of pixels, then it is considered to be noise-dominated and hence unusable.
| Quadrant | # 1 sec bins | Bins with >0 counts | Bins with >2000 counts | High rate bins dominated by noise | Noise dominated (total time) | Noise dominated (detector-on time) | Marked lightcurve |
|---|---|---|---|---|---|---|---|
| A | 8482 | 1144 | 0 | 0 | 0.00% | 0.00% | 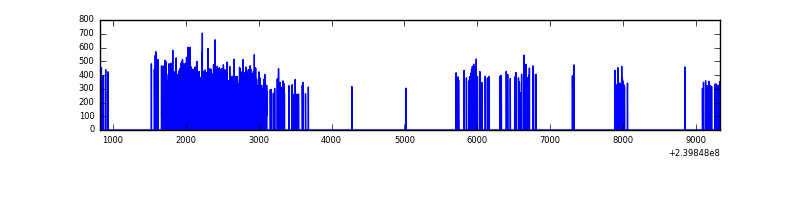 |
| B | 8421 | 1204 | 0 | 0 | 0.00% | 0.00% | 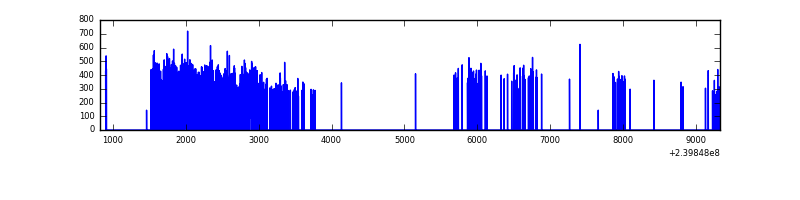 |
| C | 8494 | 1236 | 0 | 0 | 0.00% | 0.00% | 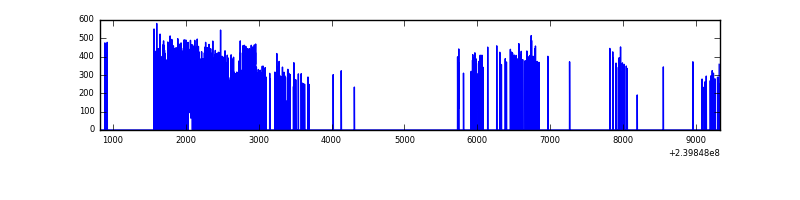 |
| D | 7745 | 1104 | 6 | 6 | 0.08% | 0.54% | 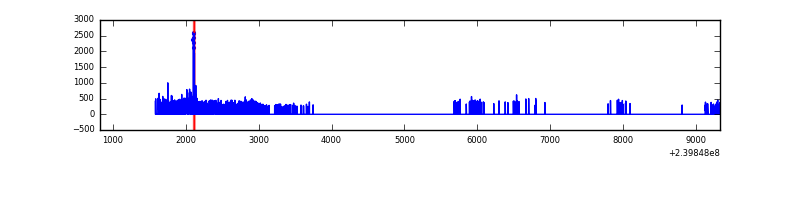 |
Top three noisy pixels from each quadrant. If the there are fewer than three noisy pixels in the level2.evt file, extra rows are filled as -1
| Pixel properties | Quadrant properties | ||||||
|---|---|---|---|---|---|---|---|
| Quadrant | DetID | PixID | Counts | Sigma | Mean | Median | Sigma |
| A | 8 | 5 | 6627 | 368.4 | 75 | 73 | 17.8 |
| A | 0 | 8 | 1397 | 74.42 | 75 | 73 | 17.8 |
| A | 0 | 226 | 654 | 32.66 | 75 | 73 | 17.8 |
| B | 0 | 219 | 2409 | 132.66 | 80 | 78 | 17.6 |
| B | 0 | 214 | 2340 | 128.73 | 80 | 78 | 17.6 |
| B | 12 | 111 | 1745 | 94.87 | 80 | 78 | 17.6 |
| C | 13 | 61 | 619 | 26.23 | 80 | 80 | 20.6 |
| C | 4 | 175 | 558 | 23.26 | 80 | 80 | 20.6 |
| C | 8 | 222 | 430 | 17.03 | 80 | 80 | 20.6 |
| D | 10 | 199 | 24045 | 1196.71 | 68 | 66 | 20.0 |
| D | 8 | 195 | 4416 | 217.09 | 68 | 66 | 20.0 |
| D | 9 | 85 | 3702 | 181.46 | 68 | 66 | 20.0 |
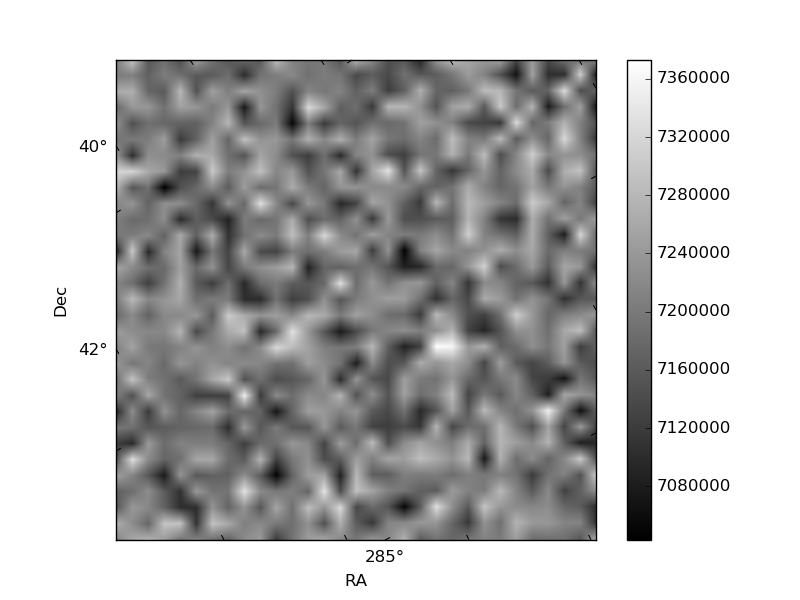
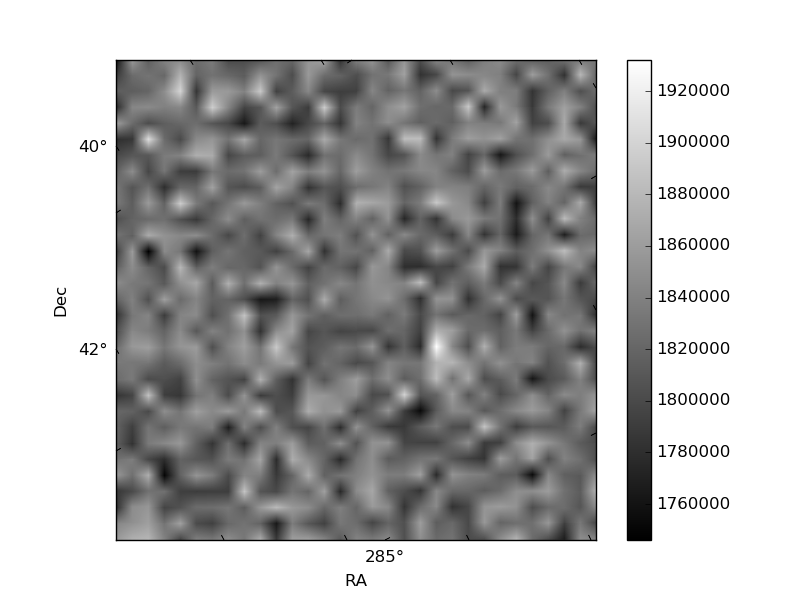
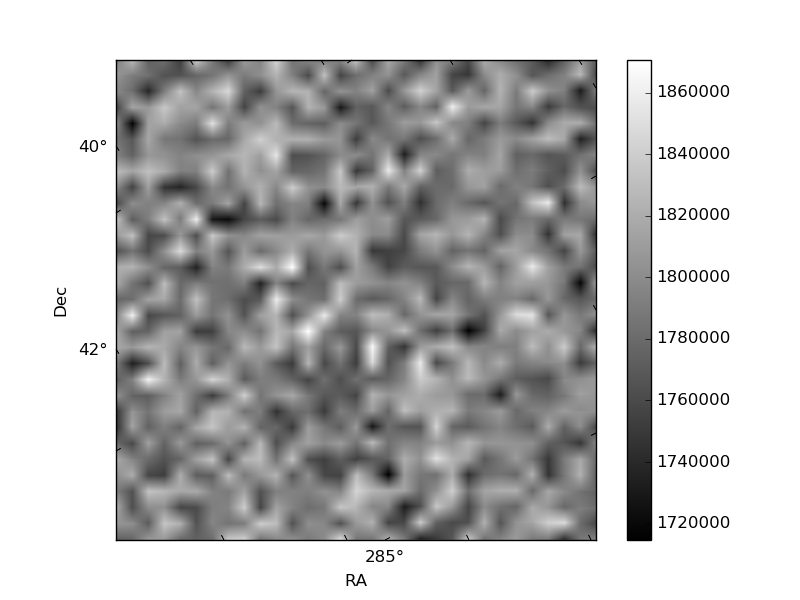
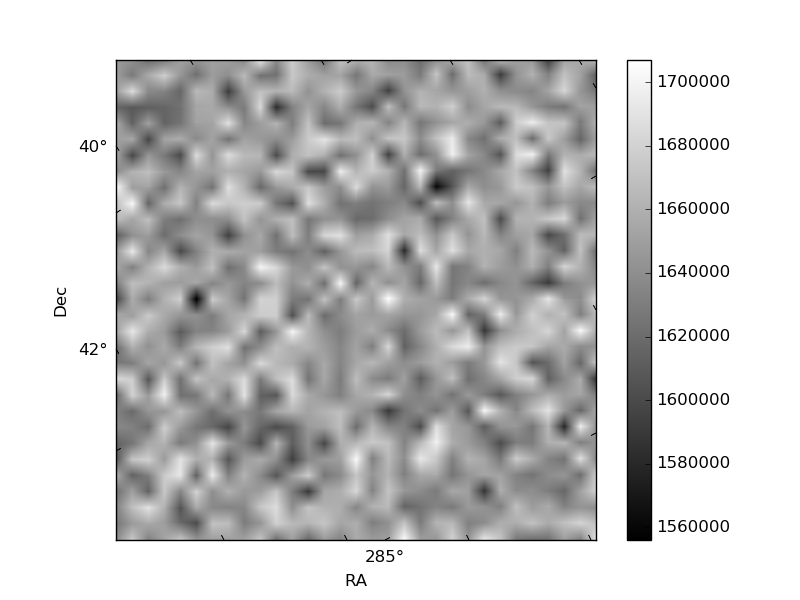
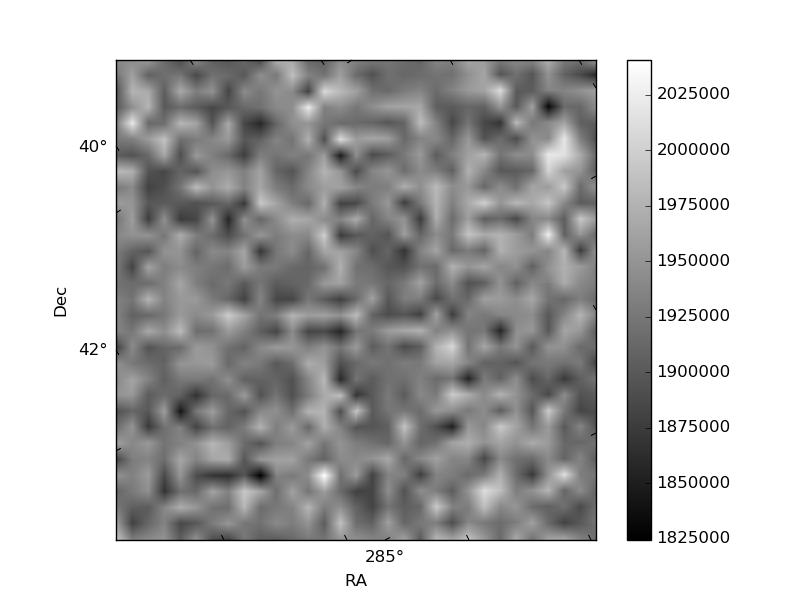
Histogram calculated using DETX and DETY for each event in the final _common_clean file
| Quadrant A | 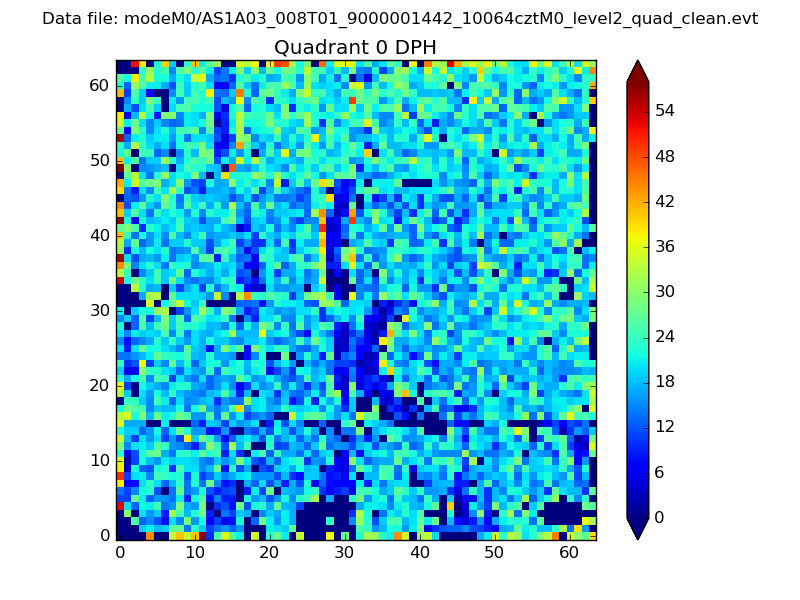 |
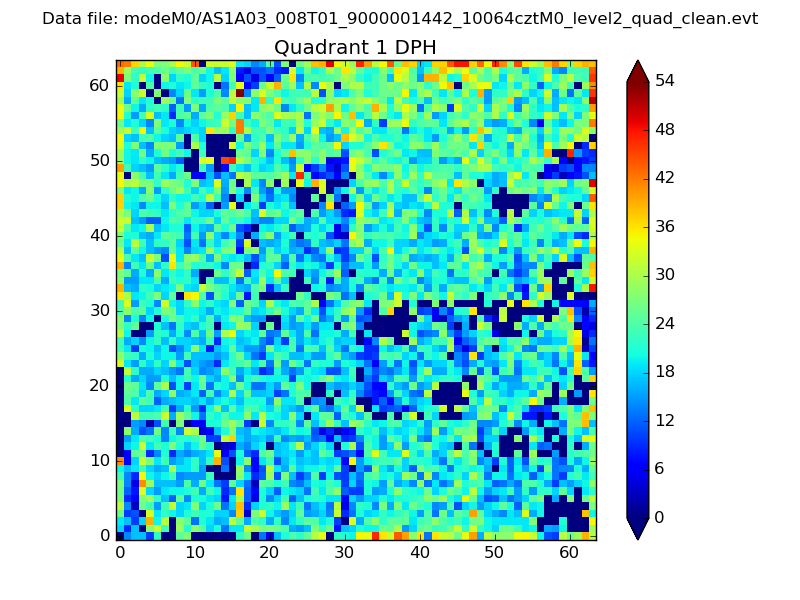 |
Quadrant B |
|---|---|---|---|
| Quadrant D | 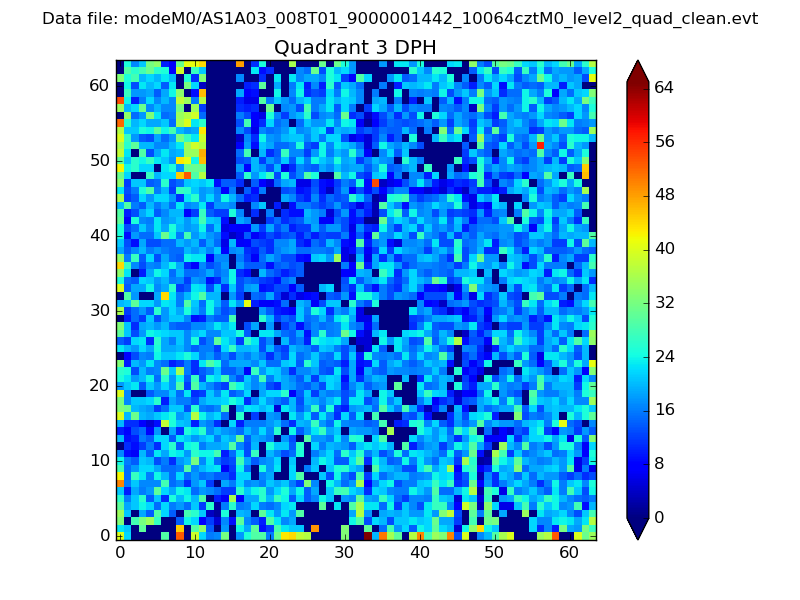 |
 |
Quadrant C |
| Plot type | Count rate plots | Images |
|---|---|---|
| Comparison with Poisson distribution Blue bars denote a histogram of data divided into 1 sec bins. Red curve is a Poisson curve with rate = median count rate of data. |
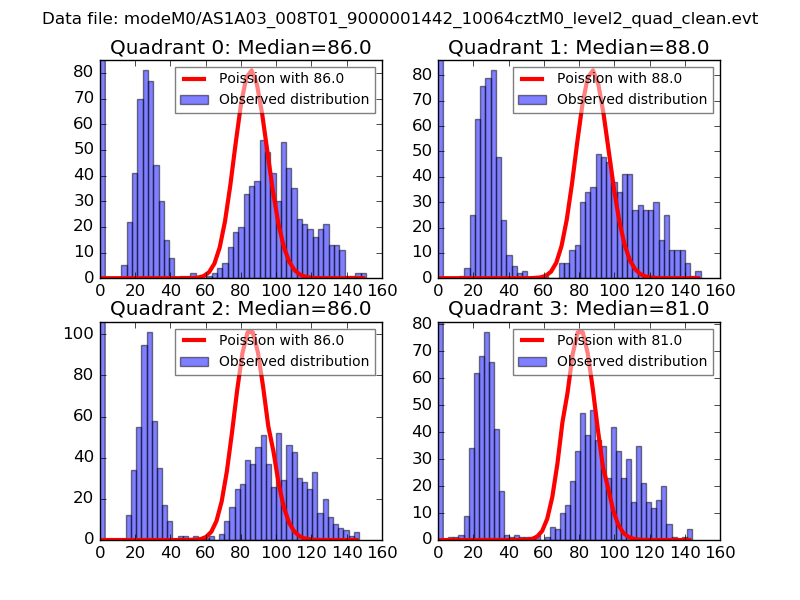 |
 |
| Quadrant-wise count rates Data is divided into 100 sec bins |
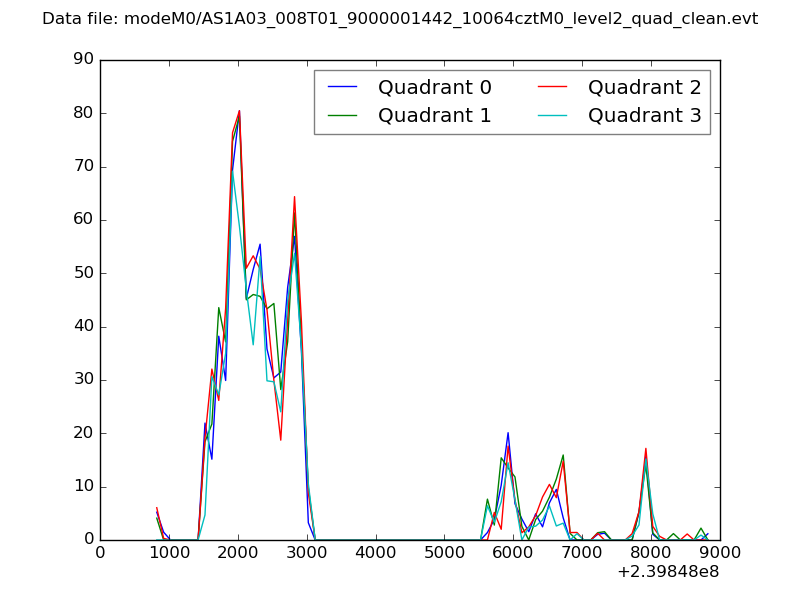 |
|
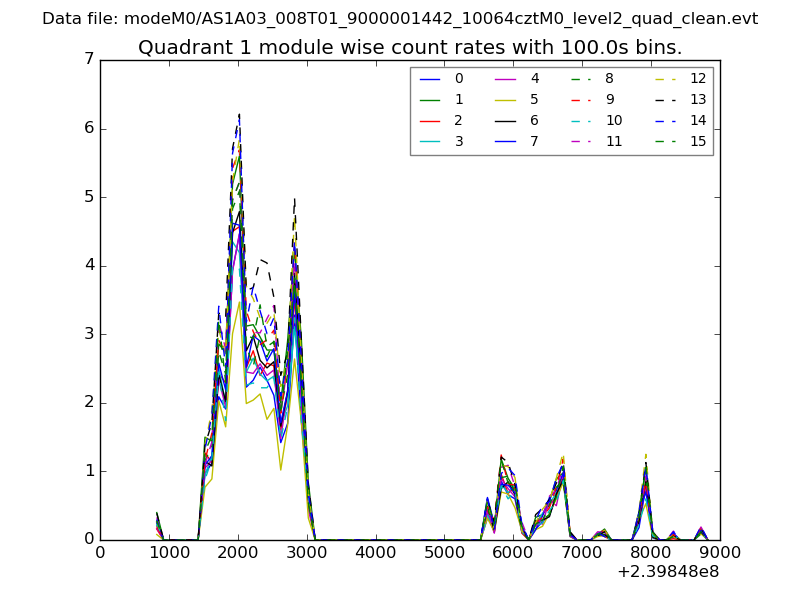
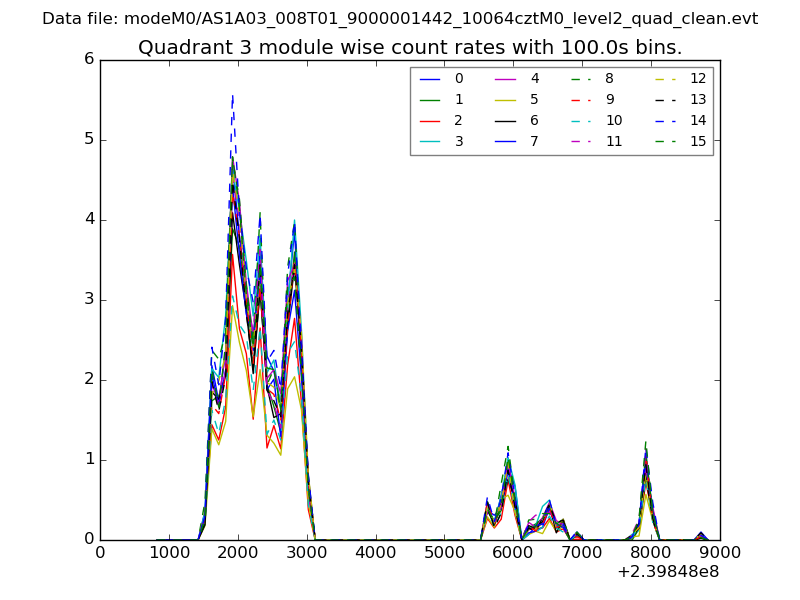
| Module-wise count rates for Quadrant A Data is divided into 100 sec bins |
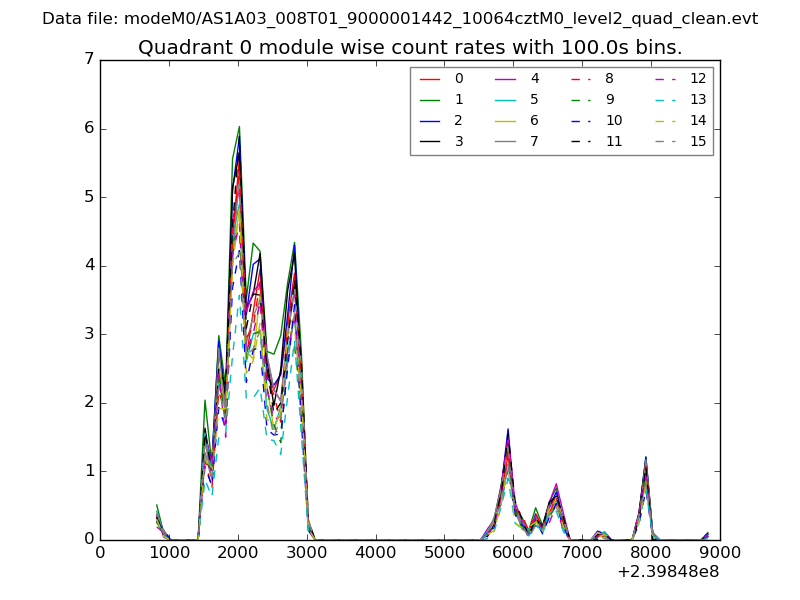 |
 |
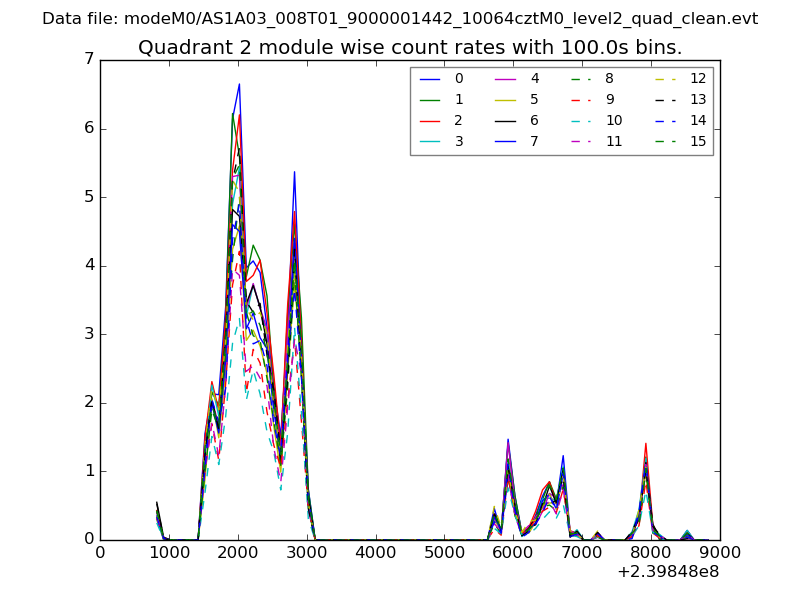
| Module-wise count rates for Quadrant B Data is divided into 100 sec bins |
 |
 |
| Module-wise count rates for Quadrant C Data is divided into 100 sec bins |
 |
 |
| Module-wise count rates for Quadrant D Data is divided into 100 sec bins |
 |
 |
| Parameter | Plot |
|---|---|
| CZT HV Monitor | 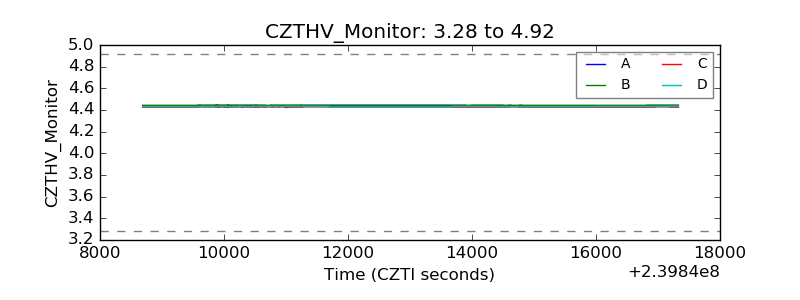 |
| D_VDD | 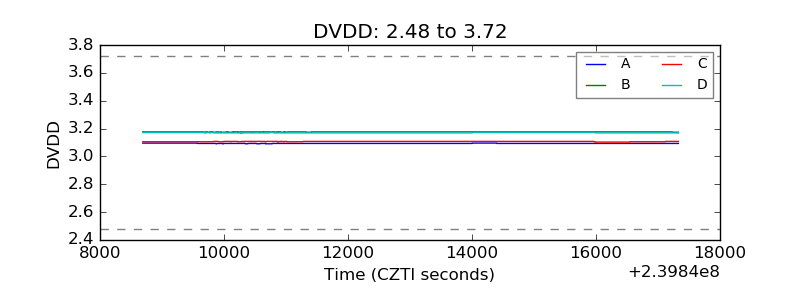 |
| Temperature 1 | 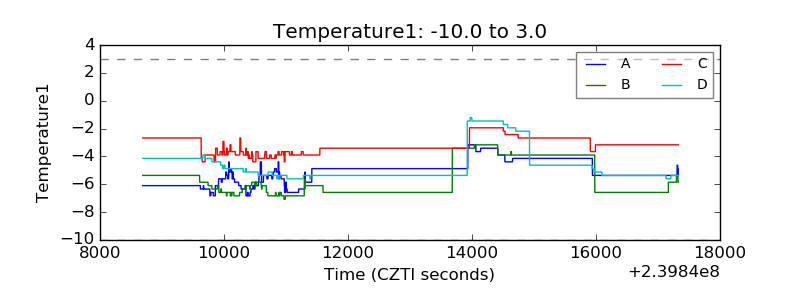 |
| Veto HV Monitor | 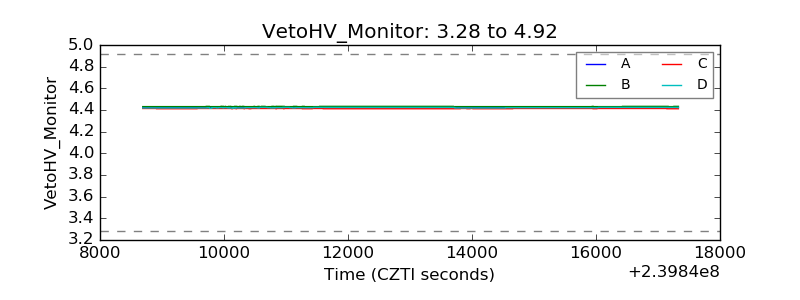 |
| Veto LLD | 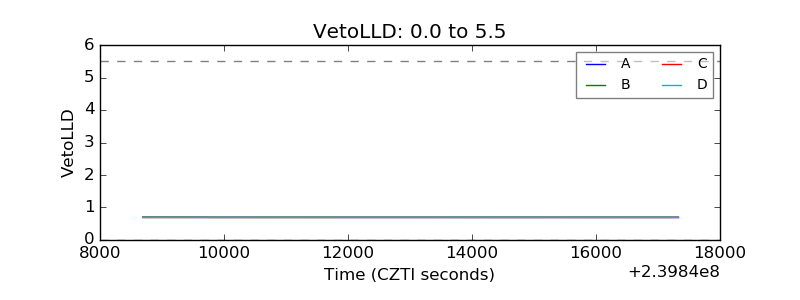 |
| Alpha Counter | 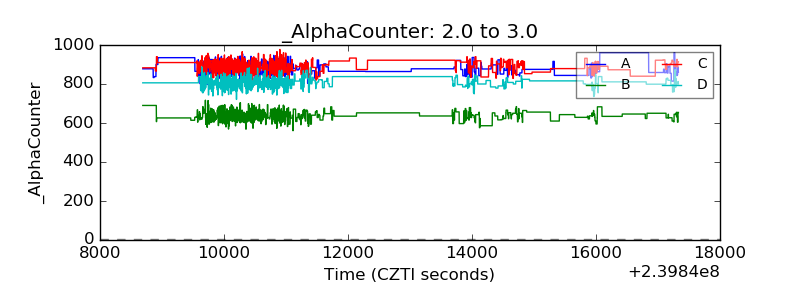 |
| _CPM_Rate | 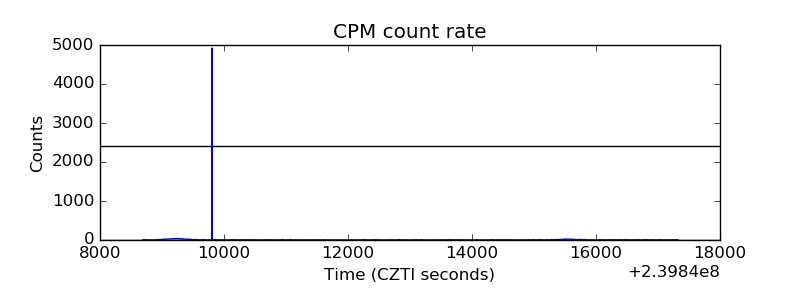 |
| CZT Counter |  |
| +2.5 Volts monitor |  |
| +5 Volts monitor |  |
| _ROLL_ROT | 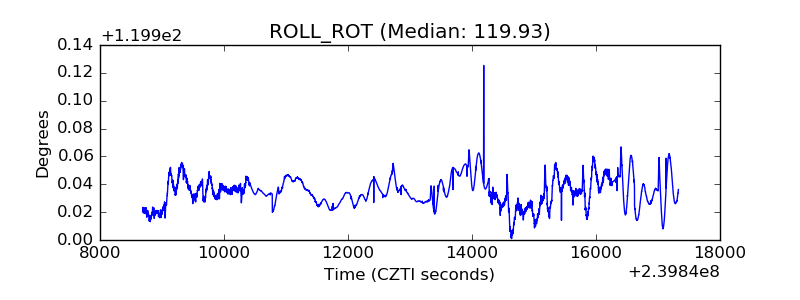 |
| _Roll_DEC | 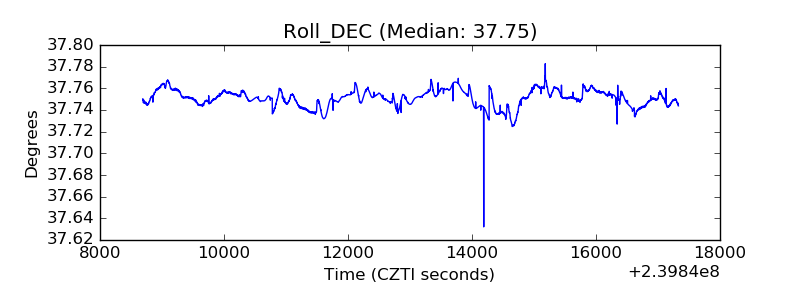 |
| _Roll_RA |  |
| Veto Counter | 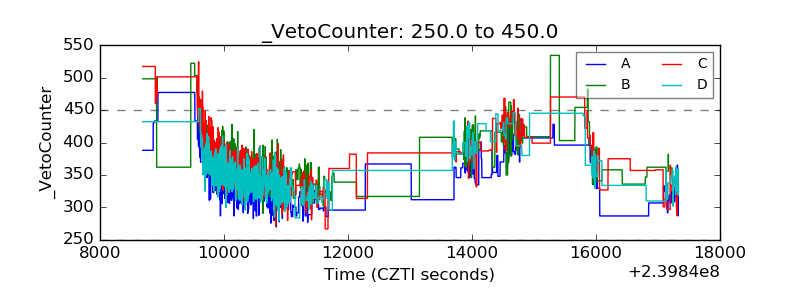 |