| Param | Original file | Final file |
|---|---|---|
| Filename | modeM0/AS1A03_008T01_9000001442_10067cztM0_level2.evt | modeM0/AS1A03_008T01_9000001442_10067cztM0_level2_quad_clean.evt |
| Size (bytes) | 314,579,520 | 64,105,920 |
| Size | 300.0 MB | 61.1 MB |
| Events in quadrant A | 2,297,546 | 397,545 |
| Events in quadrant B | 2,322,968 | 408,671 |
| Events in quadrant C | 2,214,296 | 400,447 |
| Events in quadrant D | 2,346,876 | 381,321 |
| Mode M0 | |||
|---|---|---|---|
| Quadrant | BADHDUFLAG | Total packets | Discarded packets |
| A | 0 | 21402 | 11175 |
| B | 0 | 21323 | 11043 |
| C | 0 | 21053 | 10847 |
| D | 0 | 22817 | 12400 |
| Mode SS | |||
|---|---|---|---|
| Quadrant | BADHDUFLAG | Total packets | Discarded packets |
| A | 0 | 210 | 99 |
| B | 0 | 211 | 99 |
| C | 0 | 211 | 111 |
| D | 0 | 209 | 113 |
| Mode M9 | |||
|---|---|---|---|
| Quadrant | BADHDUFLAG | Total packets | Discarded packets |
| A | 0 | 5 | 1 |
| B | 0 | 5 | 1 |
| C | 0 | 5 | 1 |
| D | 0 | 5 | 1 |
| Quadrant | Total seconds | Saturated seconds | Saturation percentage |
|---|---|---|---|
| A | 4979 | 43 | 0.863627% |
| B | 5022 | 52 | 1.035444% |
| C | 5046 | 24 | 0.475624% |
| D | 4959 | 36 | 0.725953% |
Noise dominated data is calculated using 1-second bins in cleaned event files. If a bin has >2000 counts, and if more than 50% of those come from <1% of pixels, then it is considered to be noise-dominated and hence unusable.
| Quadrant | # 1 sec bins | Bins with >0 counts | Bins with >2000 counts | High rate bins dominated by noise | Noise dominated (total time) | Noise dominated (detector-on time) | Marked lightcurve |
|---|---|---|---|---|---|---|---|
| A | 10999 | 6607 | 1 | 1 | 0.01% | 0.02% | 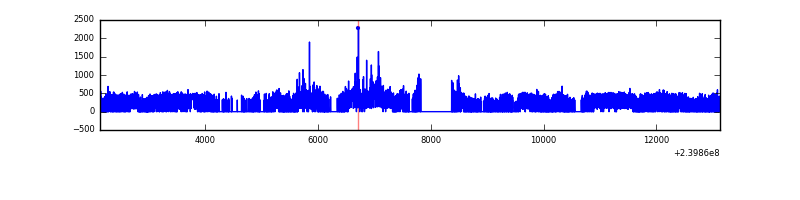 |
| B | 10988 | 6655 | 1 | 1 | 0.01% | 0.02% | 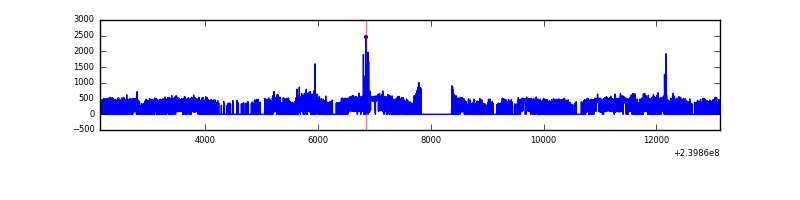 |
| C | 10986 | 6689 | 0 | 0 | 0.00% | 0.00% | 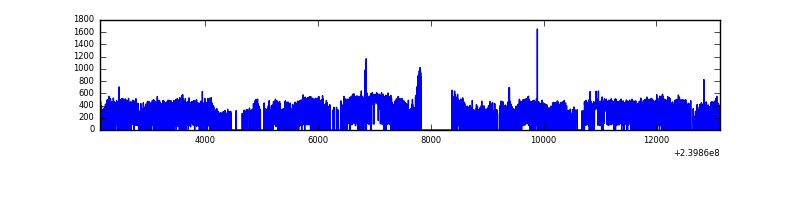 |
| D | 10933 | 6481 | 7 | 7 | 0.06% | 0.11% | 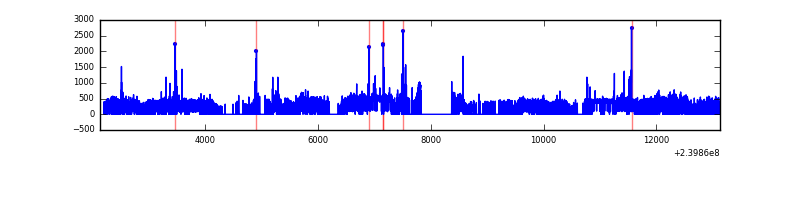 |
Top three noisy pixels from each quadrant. If the there are fewer than three noisy pixels in the level2.evt file, extra rows are filled as -1
| Pixel properties | Quadrant properties | ||||||
|---|---|---|---|---|---|---|---|
| Quadrant | DetID | PixID | Counts | Sigma | Mean | Median | Sigma |
| A | 8 | 5 | 90648 | 759.54 | 567 | 553 | 118.6 |
| A | 0 | 8 | 11545 | 92.67 | 567 | 553 | 118.6 |
| A | 8 | 15 | 7244 | 56.41 | 567 | 553 | 118.6 |
| B | 0 | 214 | 41091 | 360.7 | 577 | 563 | 112.4 |
| B | 4 | 239 | 24003 | 208.61 | 577 | 563 | 112.4 |
| B | 12 | 111 | 12659 | 107.65 | 577 | 563 | 112.4 |
| C | 14 | 234 | 13410 | 97.99 | 560 | 561 | 131.1 |
| C | 8 | 128 | 6874 | 48.15 | 560 | 561 | 131.1 |
| C | 13 | 61 | 4095 | 26.95 | 560 | 561 | 131.1 |
| D | 1 | 52 | 86677 | 617.97 | 548 | 532 | 139.4 |
| D | 2 | 152 | 45729 | 324.23 | 548 | 532 | 139.4 |
| D | 8 | 195 | 32627 | 230.24 | 548 | 532 | 139.4 |
Histogram calculated using DETX and DETY for each event in the final _common_clean file
| Quadrant A | 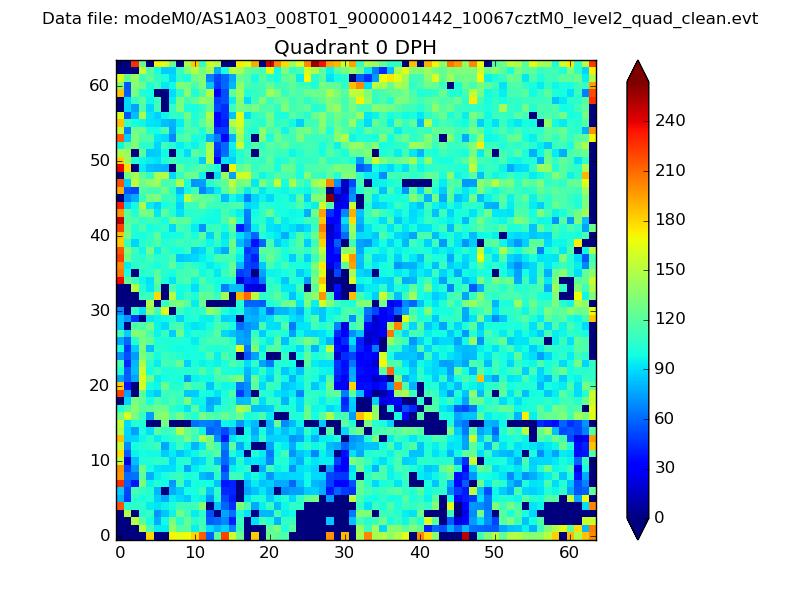 |
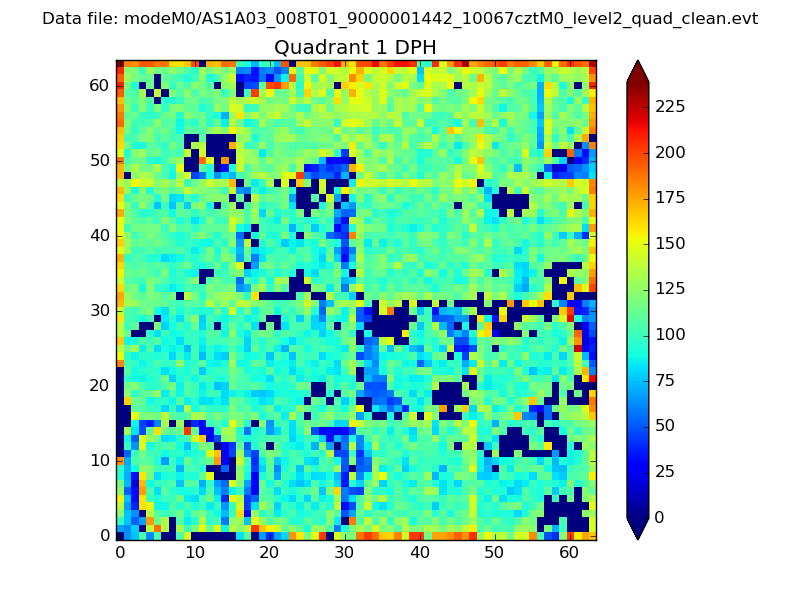 |
Quadrant B |
|---|---|---|---|
| Quadrant D | 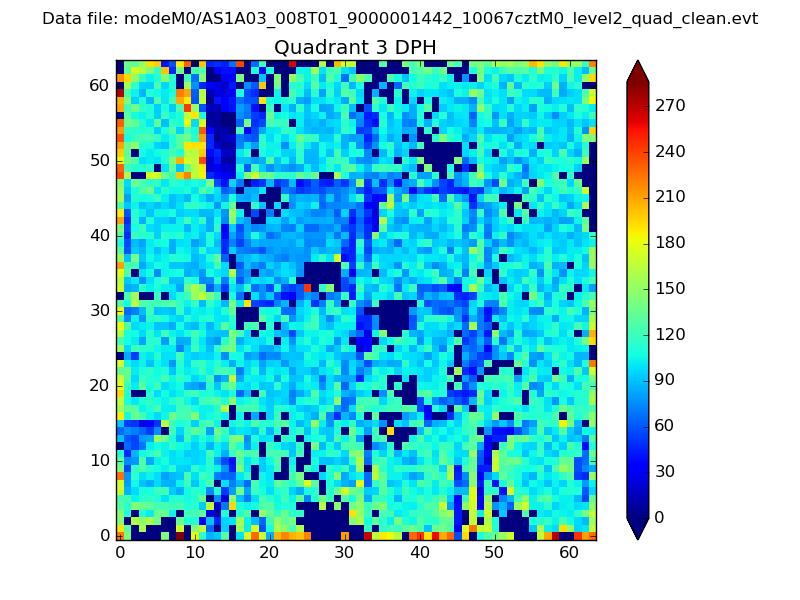 |
 |
Quadrant C |
| Plot type | Count rate plots | Images |
|---|---|---|
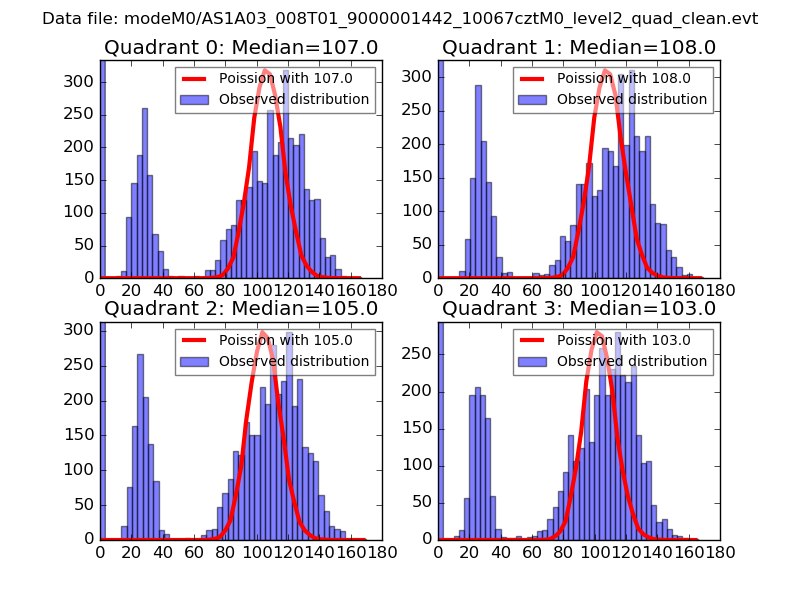
| Comparison with Poisson distribution Blue bars denote a histogram of data divided into 1 sec bins. Red curve is a Poisson curve with rate = median count rate of data. |
 |
 |
| Quadrant-wise count rates Data is divided into 100 sec bins |
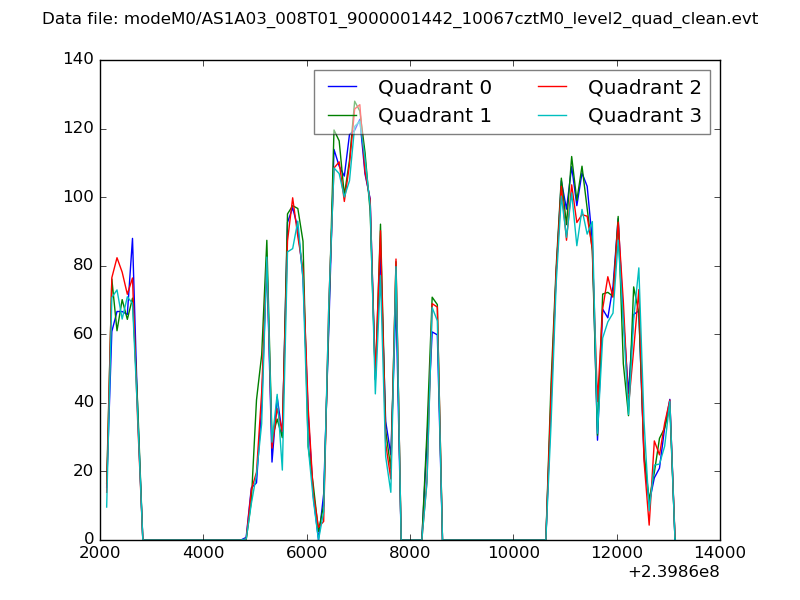 |
|
| Module-wise count rates for Quadrant A Data is divided into 100 sec bins |
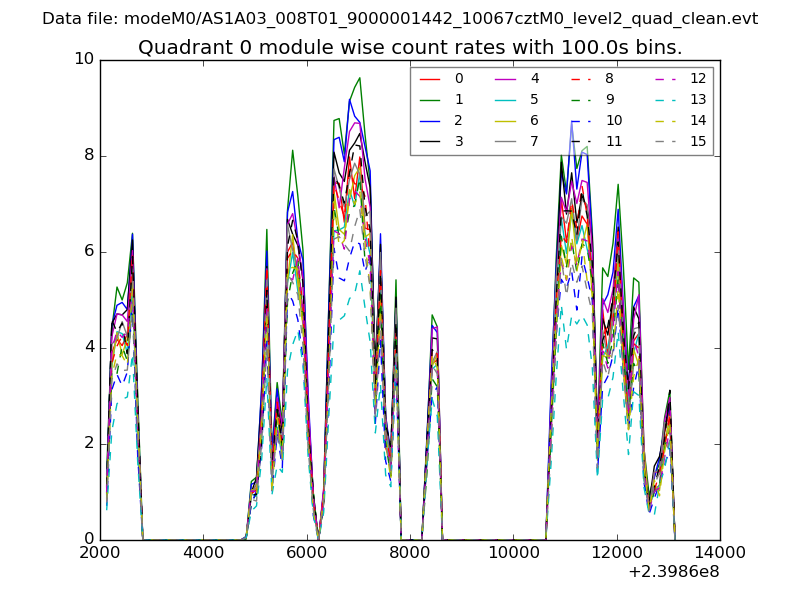 |
 |
| Module-wise count rates for Quadrant B Data is divided into 100 sec bins |
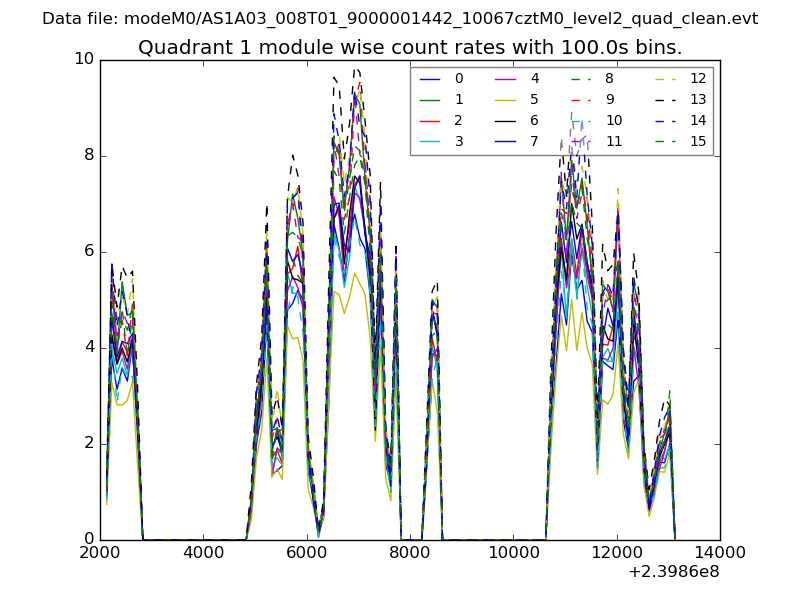 |
 |
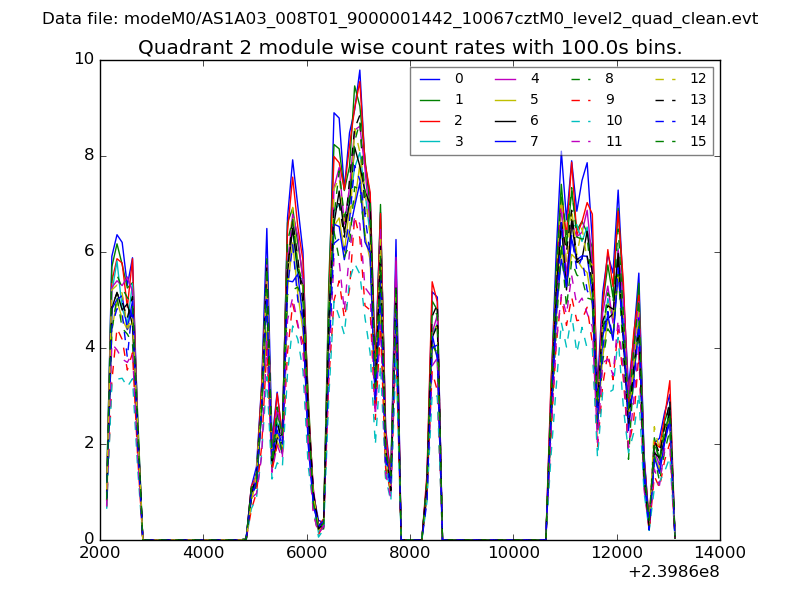
| Module-wise count rates for Quadrant C Data is divided into 100 sec bins |
 |
 |
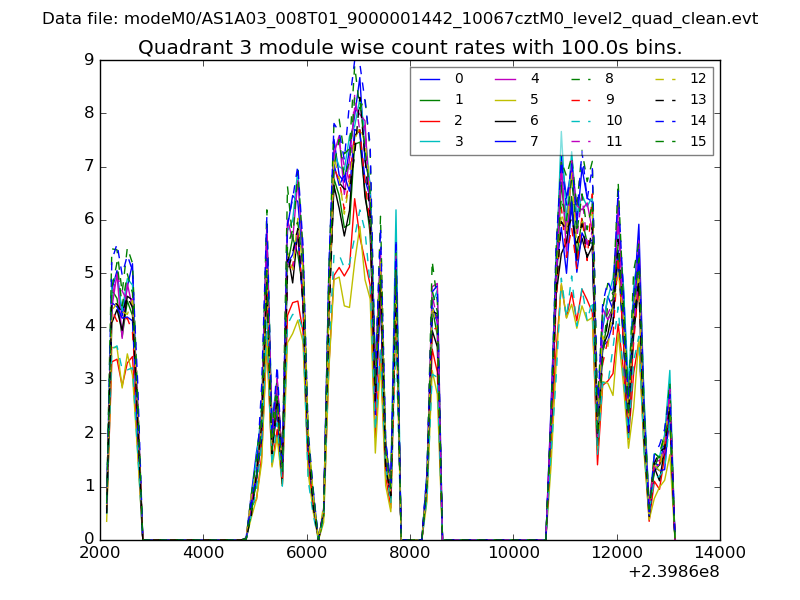
| Module-wise count rates for Quadrant D Data is divided into 100 sec bins |
 |
 |
| Parameter | Plot |
|---|---|
| CZT HV Monitor | 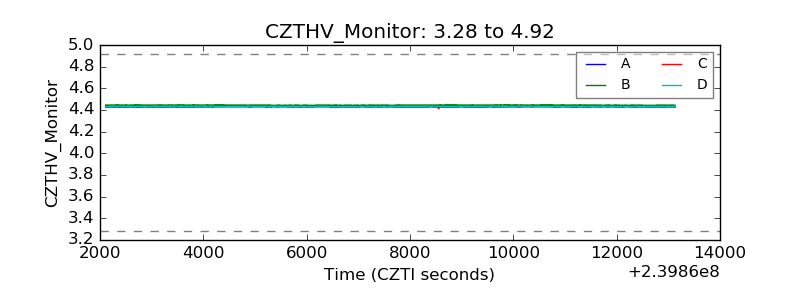 |
| D_VDD |  |
| Temperature 1 | 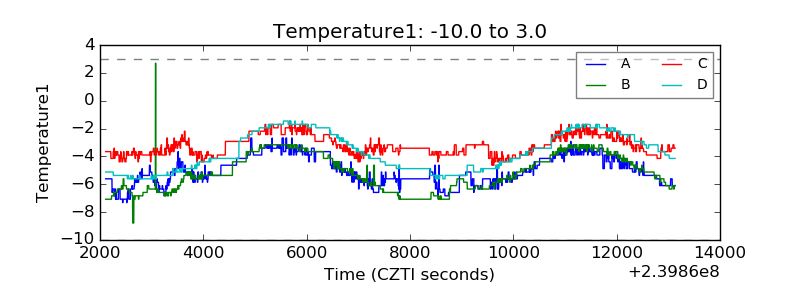 |
| Veto HV Monitor | 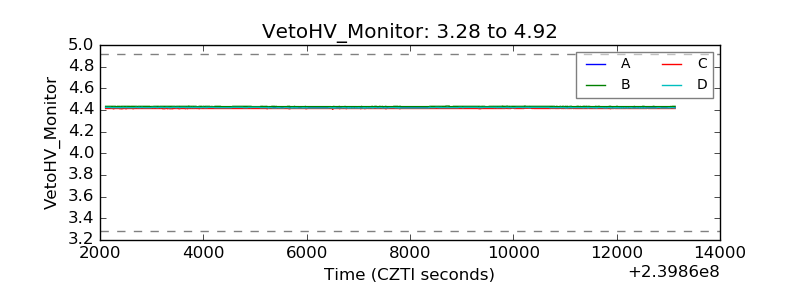 |
| Veto LLD | 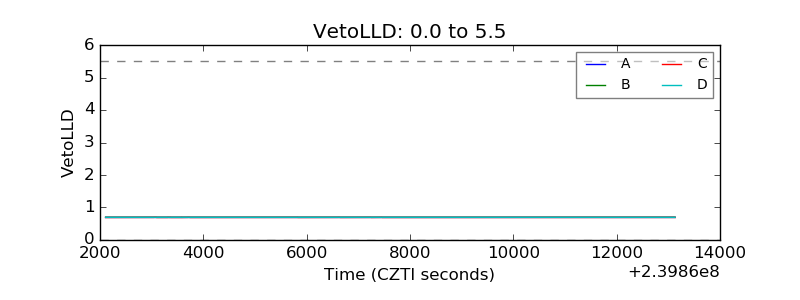 |
| Alpha Counter | 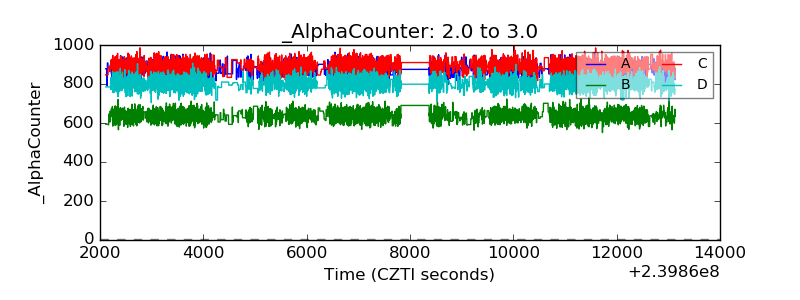 |
| _CPM_Rate | 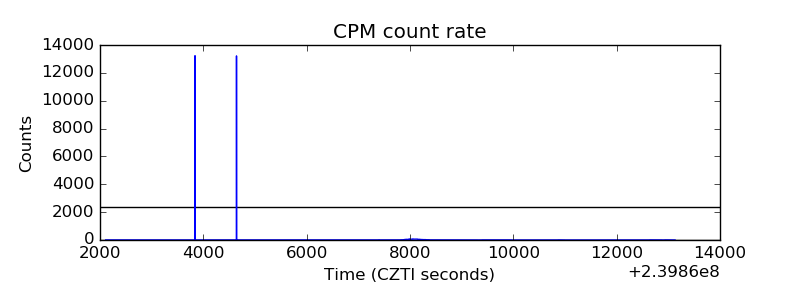 |
| CZT Counter |  |
| +2.5 Volts monitor |  |
| +5 Volts monitor |  |
| _ROLL_ROT | 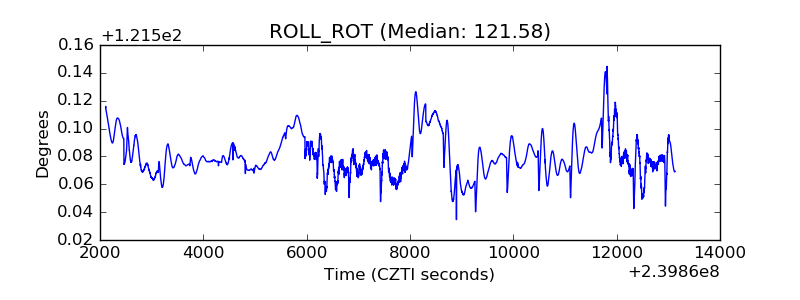 |
| _Roll_DEC | 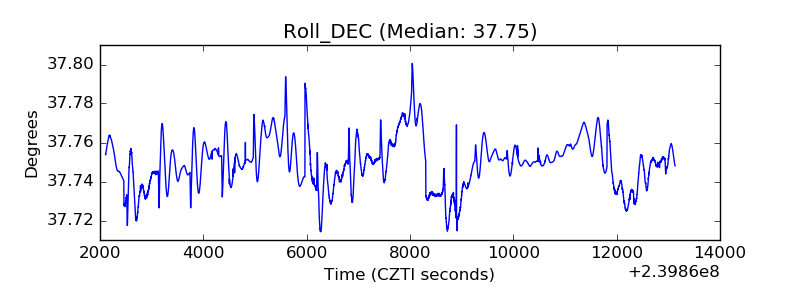 |
| _Roll_RA | 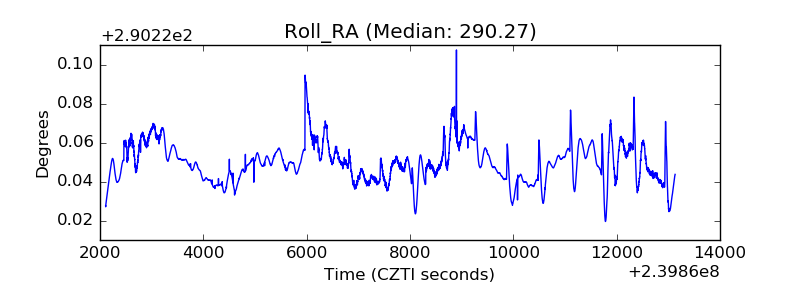 |
| Veto Counter | 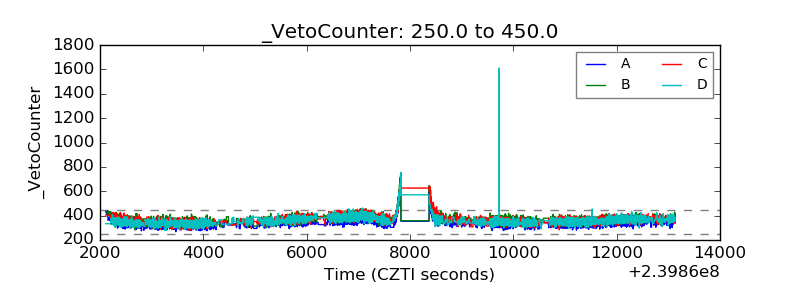 |