| Param | Original file | Final file |
|---|---|---|
| Filename | modeM0/AS1A03_033T01_9000001438cztM0_level2.fits | modeM0/AS1A03_033T01_9000001438cztM0_level2_quad_clean.evt |
| Size (bytes) | 209,275,200 | 188,953,920 |
| Size | 199.6 MB | 180.2 MB |
| Events in quadrant A | 1,254,214 | 1,086,742 |
| Events in quadrant B | 1,215,058 | 1,090,827 |
| Events in quadrant C | 1,240,818 | 1,027,180 |
| Events in quadrant D | 1,049,988 | 940,976 |
| Mode M0 | |||
|---|---|---|---|
| Quadrant | BADHDUFLAG | Total packets | Discarded packets |
| A | 0 | 48039 | 0 |
| B | 0 | 47971 | 0 |
| C | 0 | 46523 | 0 |
| D | 0 | 56977 | 0 |
| Mode M9 | |||
|---|---|---|---|
| Quadrant | BADHDUFLAG | Total packets | Discarded packets |
| A | 0 | 35 | 0 |
| B | 0 | 34 | 0 |
| C | 0 | 35 | 0 |
| D | 0 | 35 | 0 |
| Mode SS | |||
|---|---|---|---|
| Quadrant | BADHDUFLAG | Total packets | Discarded packets |
| A | 0 | 466 | 0 |
| B | 0 | 470 | 0 |
| C | 0 | 469 | 0 |
| D | 0 | 464 | 0 |
| Quadrant | Total seconds | Saturated seconds | Saturation percentage |
|---|---|---|---|
| A | 22944 | 275 | 1.198570% |
| B | 22957 | 316 | 1.376486% |
| C | 22978 | 171 | 0.744190% |
| D | 22658 | 542 | 2.392091% |
Noise dominated data is calculated using 1-second bins in cleaned event files. If a bin has >2000 counts, and if more than 50% of those come from <1% of pixels, then it is considered to be noise-dominated and hence unusable.
| Quadrant | # 1 sec bins | Bins with >0 counts | Bins with >2000 counts | High rate bins dominated by noise | Noise dominated (total time) | Noise dominated (detector-on time) | Marked lightcurve |
|---|---|---|---|---|---|---|---|
| A | 28201 | 24114 | 0 | 0 | 0.00% | 0.00% | 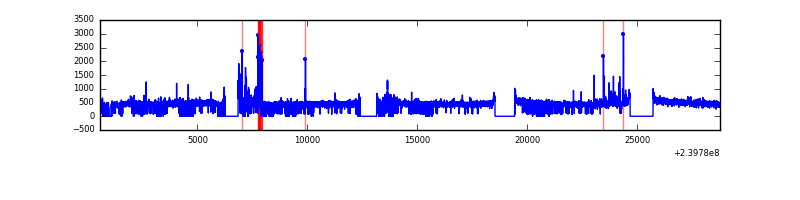 |
| B | 28201 | 24114 | 0 | 0 | 0.00% | 0.00% |  |
| C | 28201 | 24136 | 0 | 0 | 0.00% | 0.00% |  |
| D | 28199 | 23912 | 0 | 0 | 0.00% | 0.00% |  |
Top three noisy pixels from each quadrant. If the there are fewer than three noisy pixels in the level2.evt file, extra rows are filled as -1
| Pixel properties | Quadrant properties | ||||||
|---|---|---|---|---|---|---|---|
| Quadrant | DetID | PixID | Counts | Sigma | Mean | Median | Sigma |
| A | 0 | 29 | 1153 | 10.21 | 325 | 304 | 83.1 |
| A | 7 | 110 | 1029 | 8.72 | 325 | 304 | 83.1 |
| A | 9 | 19 | 934 | 7.58 | 325 | 304 | 83.1 |
| B | 2 | 9 | 1009 | 10.75 | 319 | 303 | 65.7 |
| B | 14 | 254 | 836 | 8.11 | 319 | 303 | 65.7 |
| B | 5 | 232 | 832 | 8.05 | 319 | 303 | 65.7 |
| C | 12 | 241 | 932 | 7.14 | 327 | 303 | 88.1 |
| C | 1 | 81 | 883 | 6.58 | 327 | 303 | 88.1 |
| C | 1 | 80 | 875 | 6.49 | 327 | 303 | 88.1 |
| D | 3 | 14 | 802 | 6.45 | 299 | 271 | 82.3 |
| D | 6 | 231 | 778 | 6.16 | 299 | 271 | 82.3 |
| D | 10 | 189 | 745 | 5.76 | 299 | 271 | 82.3 |
Histogram calculated using DETX and DETY for each event in the final _common_clean file
| Quadrant A | 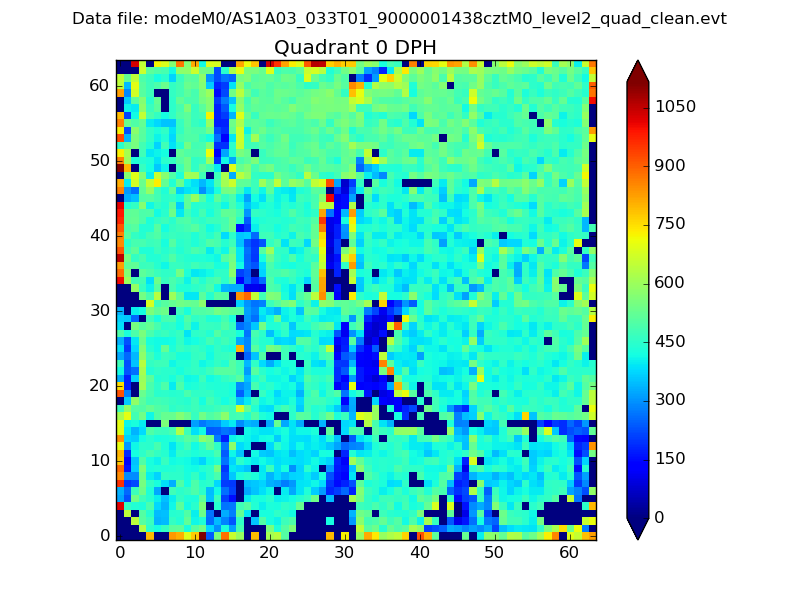 |
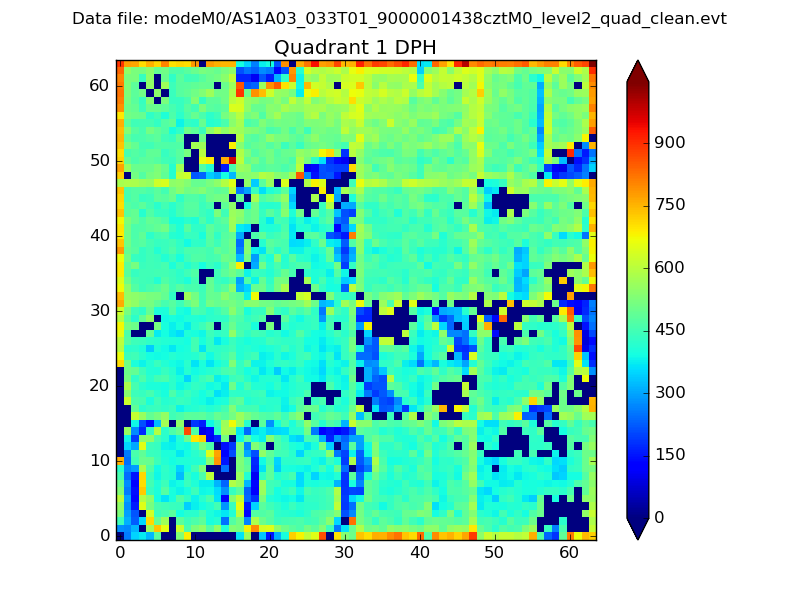 |
Quadrant B |
|---|---|---|---|
| Quadrant D |  |
 |
Quadrant C |
| Plot type | Count rate plots | Images |
|---|---|---|
| Comparison with Poisson distribution Blue bars denote a histogram of data divided into 1 sec bins. Red curve is a Poisson curve with rate = median count rate of data. |
 |
 |
| Quadrant-wise count rates Data is divided into 100 sec bins |
 |
|
| Module-wise count rates for Quadrant A Data is divided into 100 sec bins |
 |
 |
| Module-wise count rates for Quadrant B Data is divided into 100 sec bins |
 |
 |
| Module-wise count rates for Quadrant C Data is divided into 100 sec bins |
 |
 |
| Module-wise count rates for Quadrant D Data is divided into 100 sec bins |
 |
 |
| Parameter | Plot |
|---|---|
| CZT HV Monitor |  |
| D_VDD | 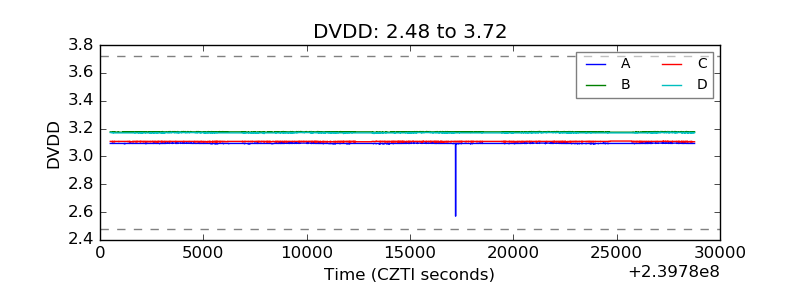 |
| Temperature 1 | 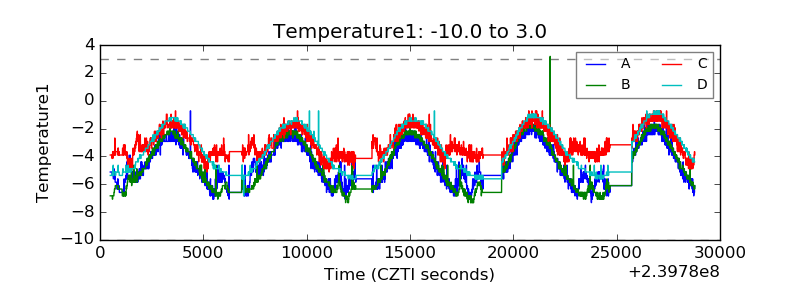 |
| Veto HV Monitor |  |
| Veto LLD |  |
| Alpha Counter |  |
| _CPM_Rate |  |
| CZT Counter |  |
| +2.5 Volts monitor |  |
| +5 Volts monitor | 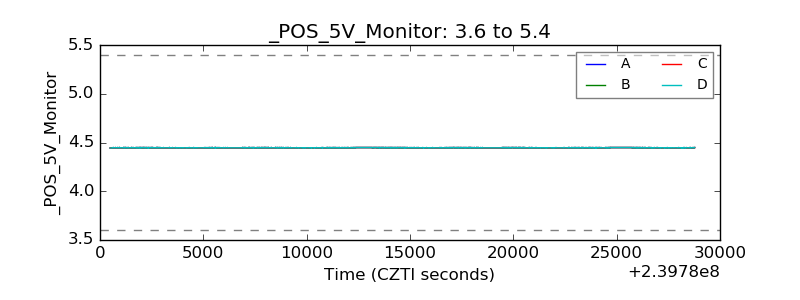 |
| _ROLL_ROT |  |
| _Roll_DEC |  |
| _Roll_RA |  |
| Veto Counter |  |