| Param | Original file | Final file |
|---|---|---|
| Filename | modeM0/AS1A03_033T01_9000001438_10054cztM0_level2.evt | modeM0/AS1A03_033T01_9000001438_10054cztM0_level2_quad_clean.evt |
| Size (bytes) | 1,191,432,960 | 208,088,640 |
| Size | 1.1 GB | 198.4 MB |
| Events in quadrant A | 8,342,085 | 1,281,637 |
| Events in quadrant B | 8,252,717 | 1,305,866 |
| Events in quadrant C | 7,683,271 | 1,278,344 |
| Events in quadrant D | 10,616,445 | 1,226,451 |
| Mode M0 | |||
|---|---|---|---|
| Quadrant | BADHDUFLAG | Total packets | Discarded packets |
| A | 0 | 37987 | 1203 |
| B | 0 | 37264 | 1061 |
| C | 0 | 36540 | 998 |
| D | 0 | 44468 | 1625 |
| Mode M9 | |||
|---|---|---|---|
| Quadrant | BADHDUFLAG | Total packets | Discarded packets |
| A | 0 | 24 | 0 |
| B | 0 | 24 | 0 |
| C | 0 | 24 | 0 |
| D | 0 | 24 | 0 |
| Mode SS | |||
|---|---|---|---|
| Quadrant | BADHDUFLAG | Total packets | Discarded packets |
| A | 0 | 368 | 14 |
| B | 0 | 368 | 8 |
| C | 0 | 368 | 12 |
| D | 0 | 368 | 12 |
| Quadrant | Total seconds | Saturated seconds | Saturation percentage |
|---|---|---|---|
| A | 17549 | 230 | 1.310616% |
| B | 17575 | 216 | 1.229018% |
| C | 17592 | 128 | 0.727603% |
| D | 17481 | 421 | 2.408329% |
Noise dominated data is calculated using 1-second bins in cleaned event files. If a bin has >2000 counts, and if more than 50% of those come from <1% of pixels, then it is considered to be noise-dominated and hence unusable.
| Quadrant | # 1 sec bins | Bins with >0 counts | Bins with >2000 counts | High rate bins dominated by noise | Noise dominated (total time) | Noise dominated (detector-on time) | Marked lightcurve |
|---|---|---|---|---|---|---|---|
| A | 20342 | 17980 | 27 | 27 | 0.13% | 0.15% | 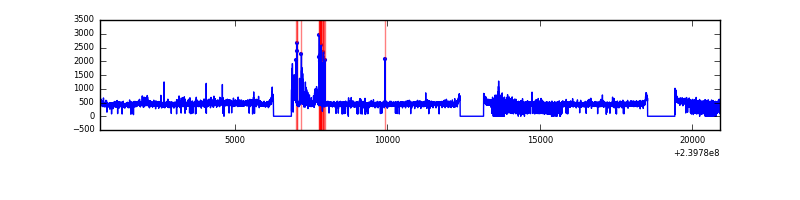 |
| B | 20342 | 17991 | 21 | 21 | 0.10% | 0.12% | 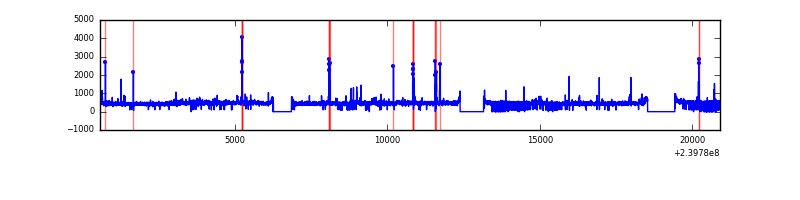 |
| C | 20342 | 18009 | 0 | 0 | 0.00% | 0.00% | 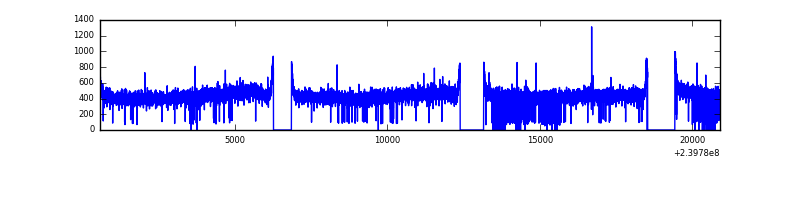 |
| D | 20342 | 17958 | 264 | 264 | 1.30% | 1.47% | 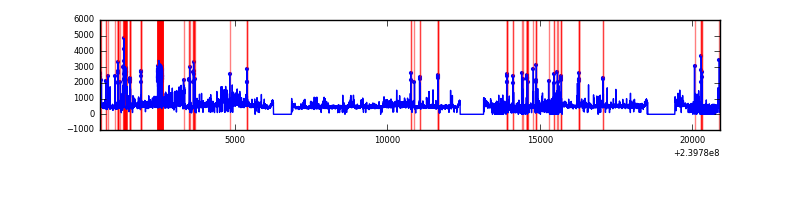 |
Top three noisy pixels from each quadrant. If the there are fewer than three noisy pixels in the level2.evt file, extra rows are filled as -1
| Pixel properties | Quadrant properties | ||||||
|---|---|---|---|---|---|---|---|
| Quadrant | DetID | PixID | Counts | Sigma | Mean | Median | Sigma |
| A | 15 | 239 | 449272 | 1099.72 | 2021 | 1977 | 406.7 |
| A | 8 | 15 | 100926 | 243.28 | 2021 | 1977 | 406.7 |
| A | 0 | 226 | 18339 | 40.23 | 2021 | 1977 | 406.7 |
| B | 10 | 247 | 149833 | 381.39 | 2031 | 1979 | 387.7 |
| B | 0 | 214 | 120560 | 305.88 | 2031 | 1979 | 387.7 |
| B | 12 | 111 | 43868 | 108.05 | 2031 | 1979 | 387.7 |
| C | 14 | 67 | 16187 | 31.42 | 1963 | 1970 | 452.5 |
| C | 13 | 61 | 14423 | 27.52 | 1963 | 1970 | 452.5 |
| C | 8 | 222 | 11005 | 19.97 | 1963 | 1970 | 452.5 |
| D | 2 | 16 | 1809251 | 3700.45 | 1933 | 1881 | 488.4 |
| D | 8 | 195 | 448052 | 913.5 | 1933 | 1881 | 488.4 |
| D | 1 | 52 | 419290 | 854.61 | 1933 | 1881 | 488.4 |
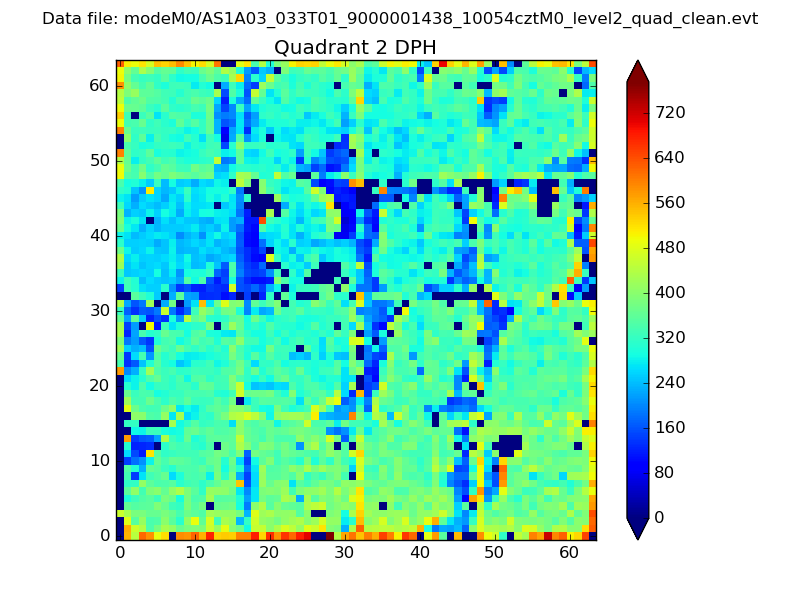
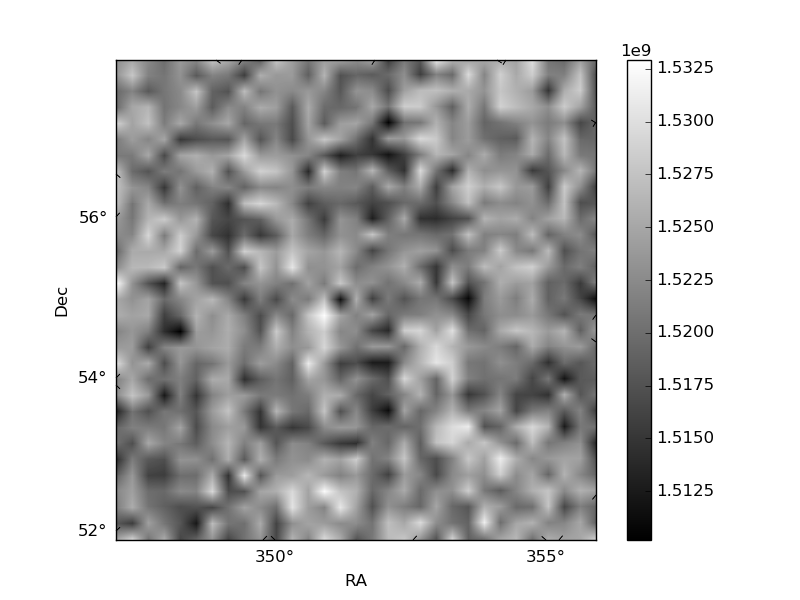
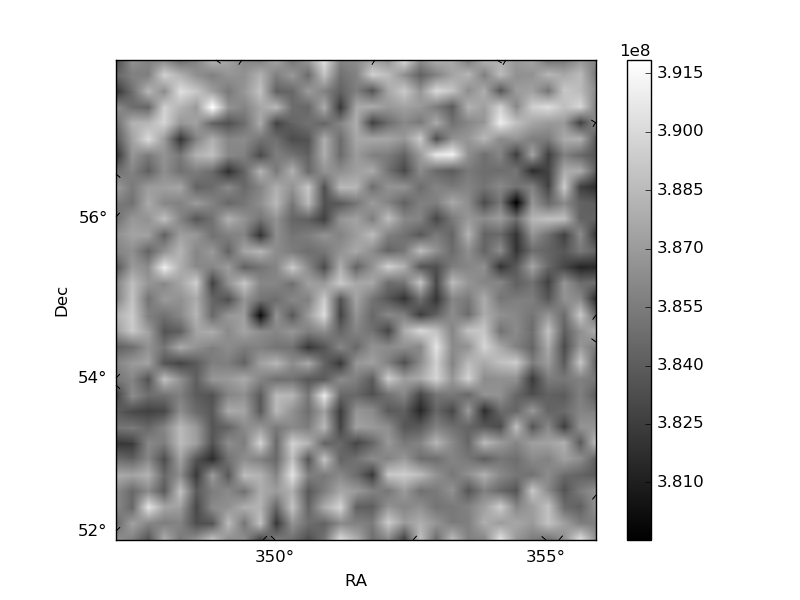
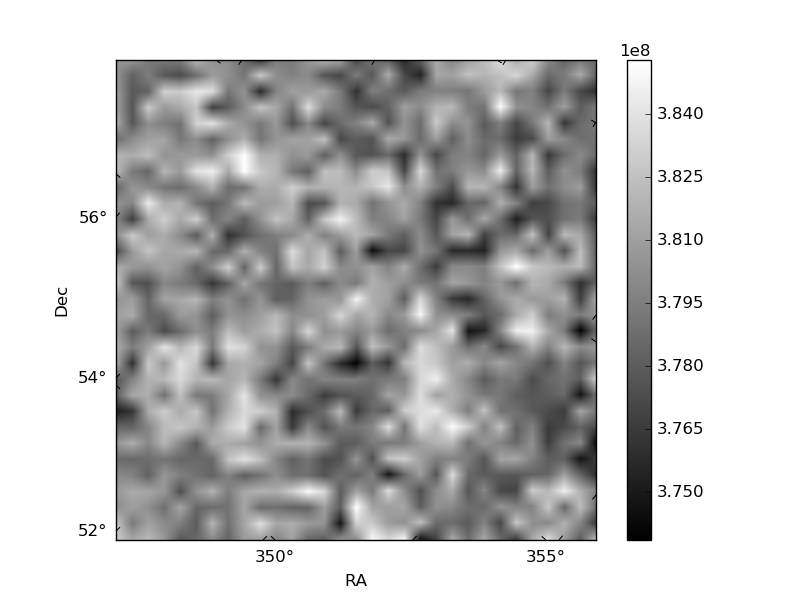
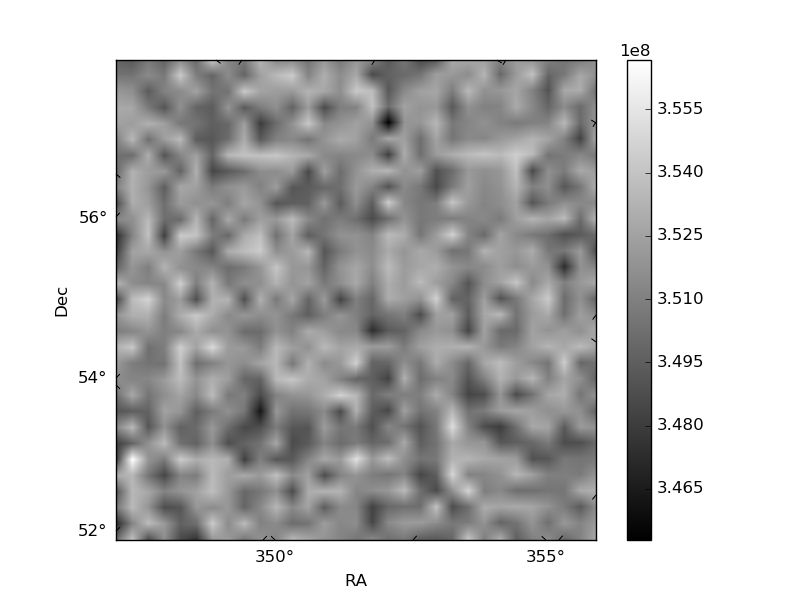
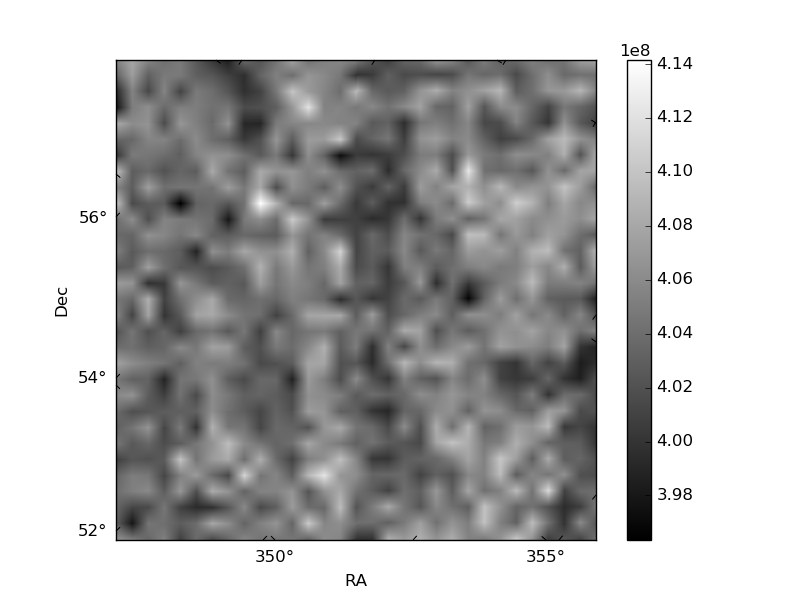
Histogram calculated using DETX and DETY for each event in the final _common_clean file
| Quadrant A | 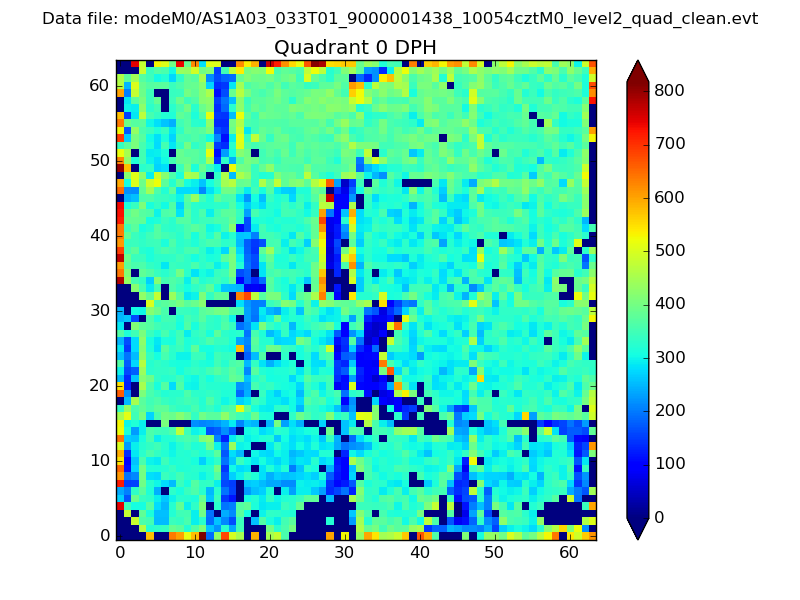 |
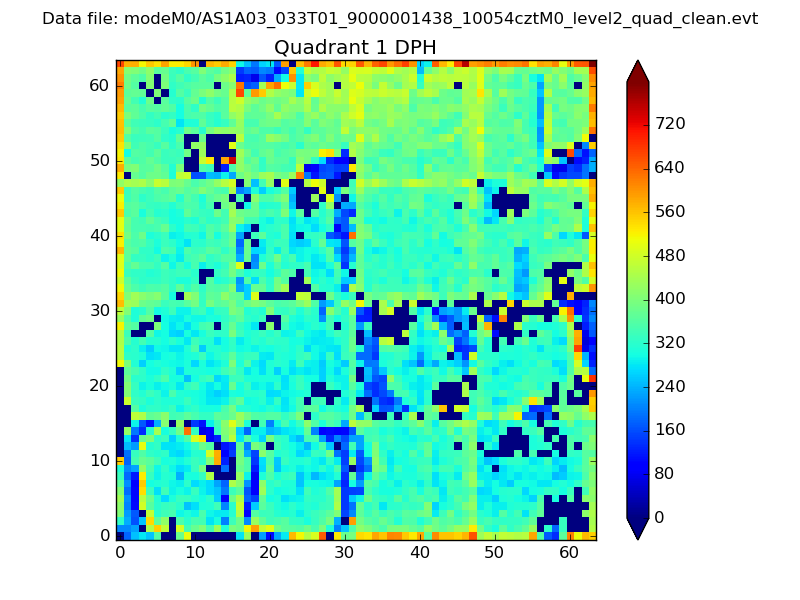 |
Quadrant B |
|---|---|---|---|
| Quadrant D | 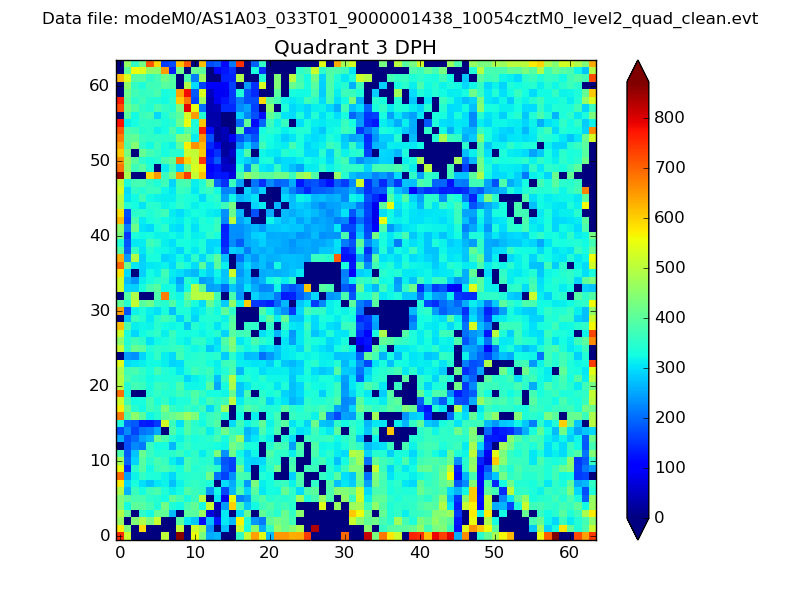 |
 |
Quadrant C |
| Plot type | Count rate plots | Images |
|---|---|---|
| Comparison with Poisson distribution Blue bars denote a histogram of data divided into 1 sec bins. Red curve is a Poisson curve with rate = median count rate of data. |
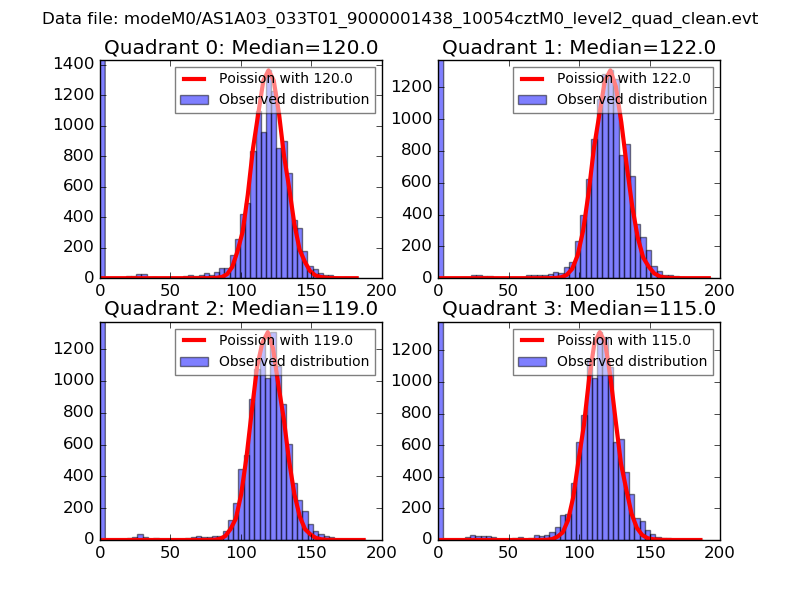 |
 |
| Quadrant-wise count rates Data is divided into 100 sec bins |
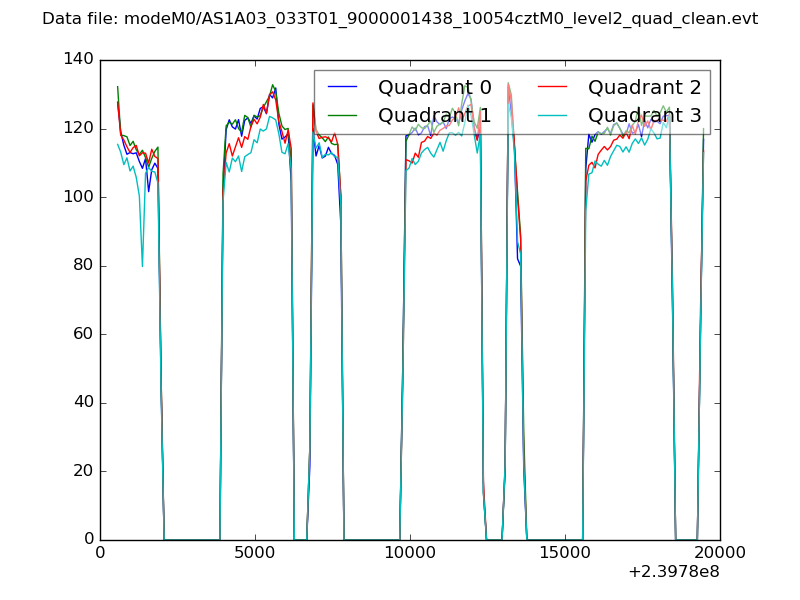 |
|
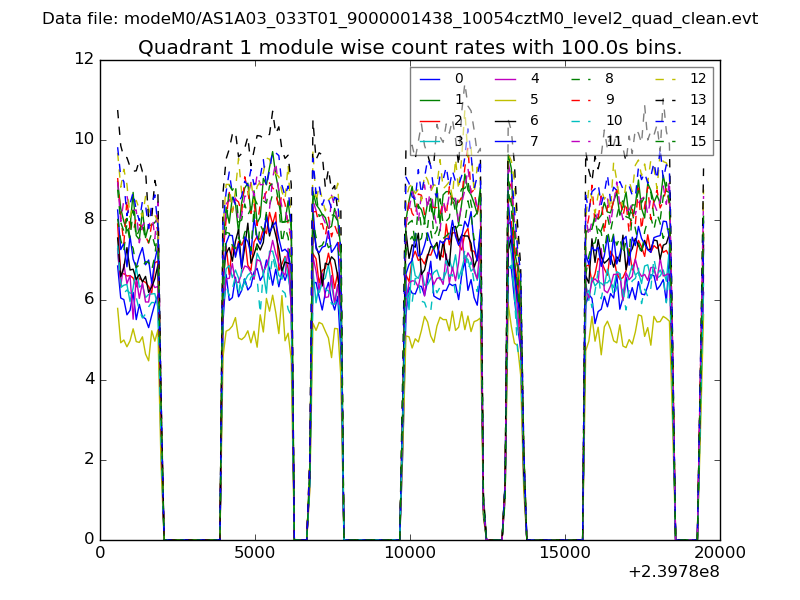
| Module-wise count rates for Quadrant A Data is divided into 100 sec bins |
 |
 |
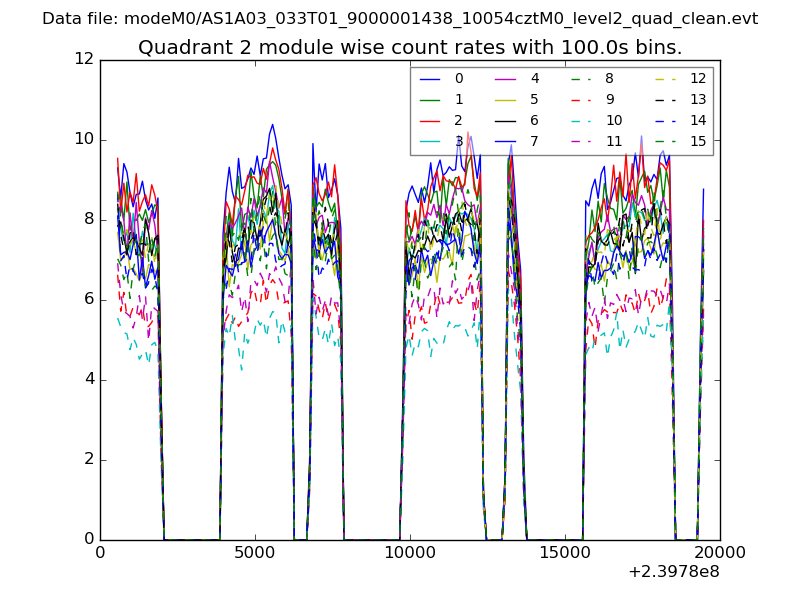
| Module-wise count rates for Quadrant B Data is divided into 100 sec bins |
 |
 |
| Module-wise count rates for Quadrant C Data is divided into 100 sec bins |
 |
 |
| Module-wise count rates for Quadrant D Data is divided into 100 sec bins |
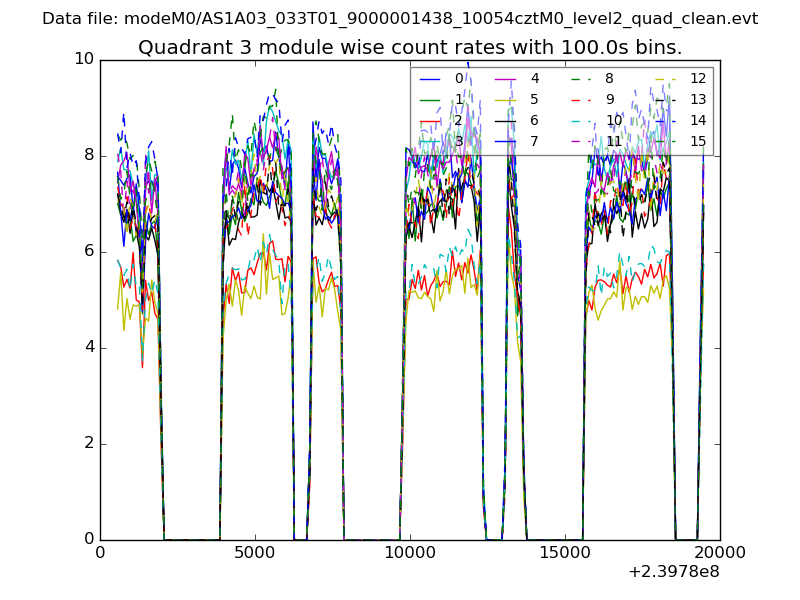 |
 |
| Parameter | Plot |
|---|---|
| CZT HV Monitor | 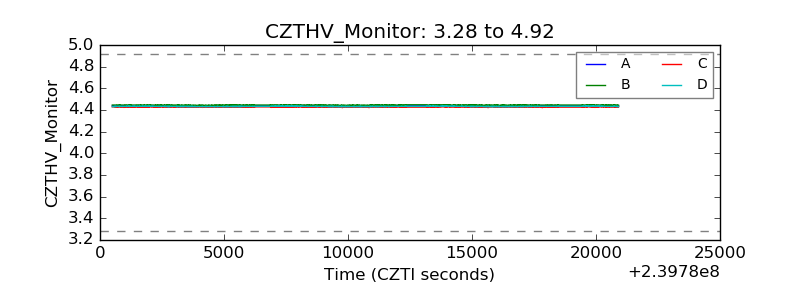 |
| D_VDD | 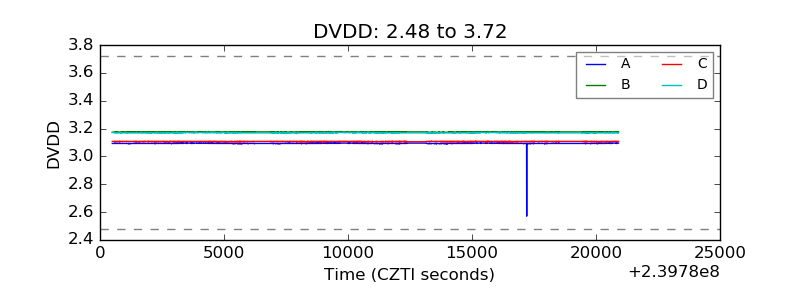 |
| Temperature 1 | 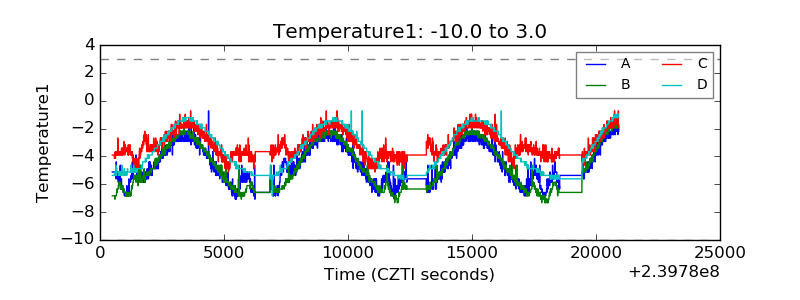 |
| Veto HV Monitor | 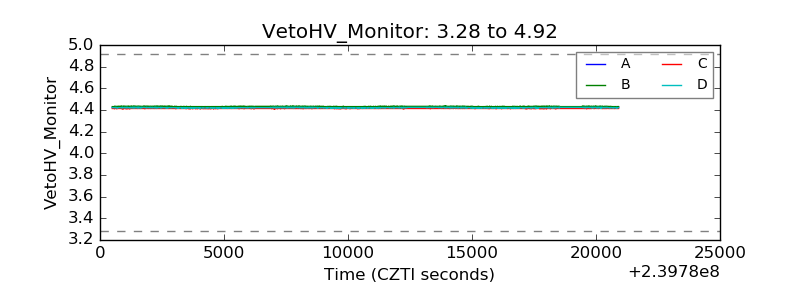 |
| Veto LLD | 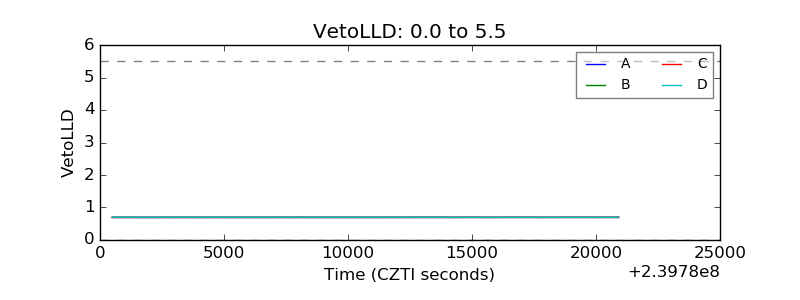 |
| Alpha Counter | 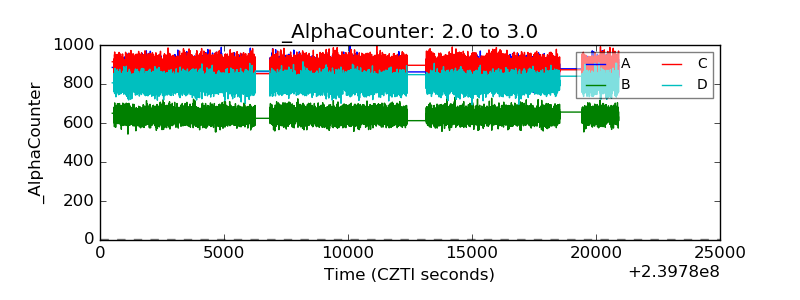 |
| _CPM_Rate | 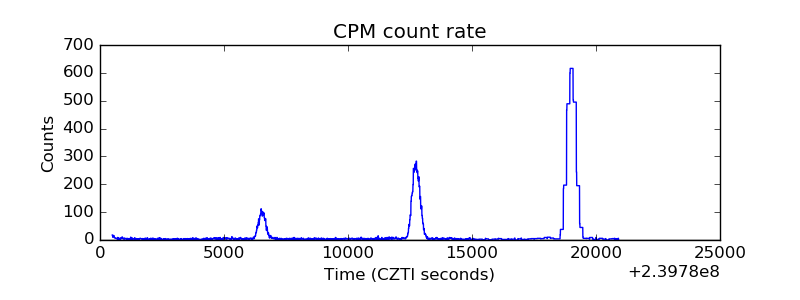 |
| CZT Counter | 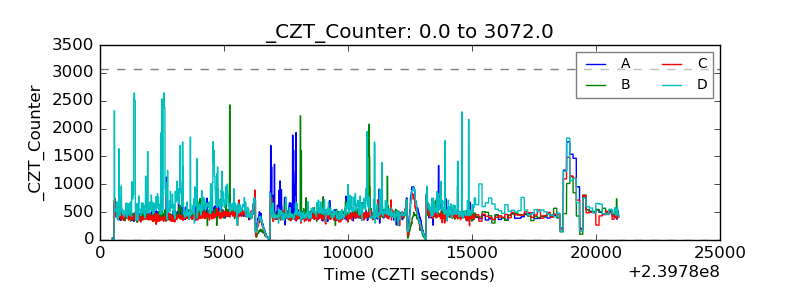 |
| +2.5 Volts monitor |  |
| +5 Volts monitor |  |
| _ROLL_ROT |  |
| _Roll_DEC | 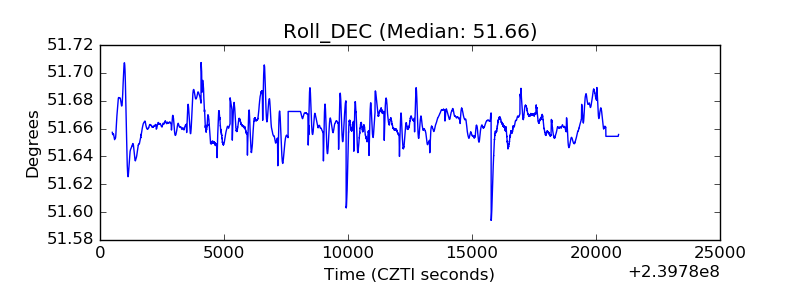 |
| _Roll_RA | 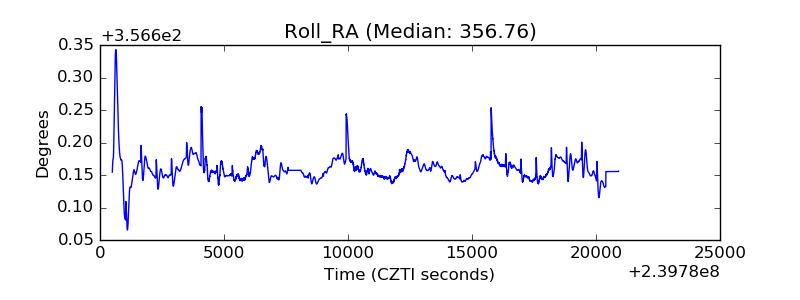 |
| Veto Counter |  |