| Param | Original file | Final file |
|---|---|---|
| Filename | modeM0/AS1A03_033T01_9000001438_10057cztM0_level2.evt | modeM0/AS1A03_033T01_9000001438_10057cztM0_level2_quad_clean.evt |
| Size (bytes) | 243,993,600 | 32,417,280 |
| Size | 232.7 MB | 30.9 MB |
| Events in quadrant A | 1,601,219 | 193,580 |
| Events in quadrant B | 1,641,452 | 194,453 |
| Events in quadrant C | 1,531,275 | 186,939 |
| Events in quadrant D | 2,398,342 | 180,518 |
| Mode M0 | |||
|---|---|---|---|
| Quadrant | BADHDUFLAG | Total packets | Discarded packets |
| A | 0 | 6730 | 1 |
| B | 0 | 6868 | 1 |
| C | 0 | 6561 | 1 |
| D | 0 | 9250 | 1 |
| Mode M9 | |||
|---|---|---|---|
| Quadrant | BADHDUFLAG | Total packets | Discarded packets |
| A | 0 | 11 | 0 |
| B | 0 | 11 | 0 |
| C | 0 | 11 | 0 |
| D | 0 | 11 | 0 |
| Mode SS | |||
|---|---|---|---|
| Quadrant | BADHDUFLAG | Total packets | Discarded packets |
| A | 0 | 64 | 0 |
| B | 0 | 64 | 0 |
| C | 0 | 64 | 0 |
| D | 0 | 64 | 0 |
| Quadrant | Total seconds | Saturated seconds | Saturation percentage |
|---|---|---|---|
| A | 3174 | 65 | 2.047889% |
| B | 3174 | 77 | 2.425961% |
| C | 3174 | 56 | 1.764335% |
| D | 3174 | 135 | 4.253308% |
Noise dominated data is calculated using 1-second bins in cleaned event files. If a bin has >2000 counts, and if more than 50% of those come from <1% of pixels, then it is considered to be noise-dominated and hence unusable.
| Quadrant | # 1 sec bins | Bins with >0 counts | Bins with >2000 counts | High rate bins dominated by noise | Noise dominated (total time) | Noise dominated (detector-on time) | Marked lightcurve |
|---|---|---|---|---|---|---|---|
| A | 4219 | 3174 | 0 | 0 | 0.00% | 0.00% | 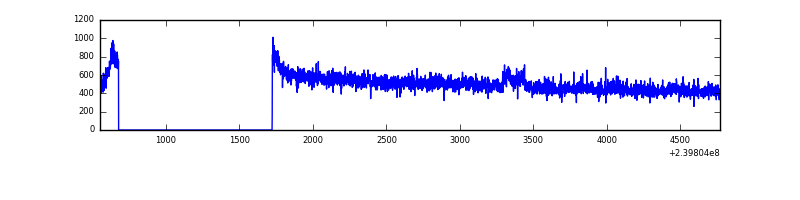 |
| B | 4219 | 3174 | 10 | 10 | 0.24% | 0.32% | 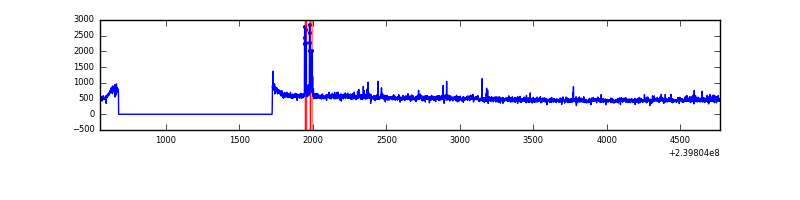 |
| C | 4219 | 3174 | 0 | 0 | 0.00% | 0.00% | 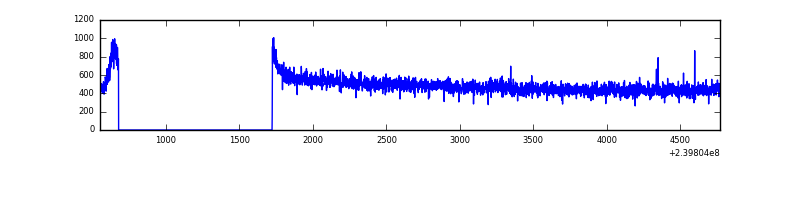 |
| D | 4219 | 3174 | 51 | 51 | 1.21% | 1.61% | 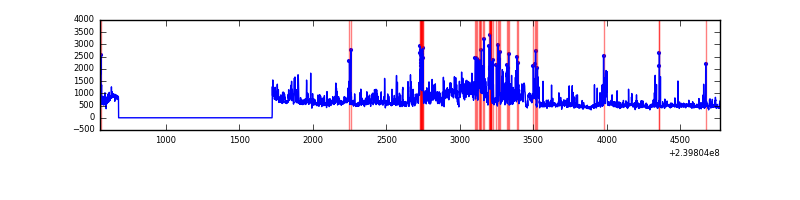 |
Top three noisy pixels from each quadrant. If the there are fewer than three noisy pixels in the level2.evt file, extra rows are filled as -1
| Pixel properties | Quadrant properties | ||||||
|---|---|---|---|---|---|---|---|
| Quadrant | DetID | PixID | Counts | Sigma | Mean | Median | Sigma |
| A | 8 | 15 | 44787 | 541.21 | 404 | 396 | 82.0 |
| A | 0 | 226 | 3789 | 41.37 | 404 | 396 | 82.0 |
| A | 12 | 194 | 3521 | 38.1 | 404 | 396 | 82.0 |
| B | 10 | 247 | 48306 | 617.7 | 401 | 391 | 77.6 |
| B | 0 | 214 | 20248 | 255.99 | 401 | 391 | 77.6 |
| B | 12 | 111 | 7803 | 95.55 | 401 | 391 | 77.6 |
| C | 14 | 67 | 7979 | 83.62 | 389 | 391 | 90.7 |
| C | 13 | 61 | 2879 | 27.42 | 389 | 391 | 90.7 |
| C | 8 | 222 | 2109 | 18.93 | 389 | 391 | 90.7 |
| D | 1 | 52 | 413789 | 4082.35 | 389 | 379 | 101.3 |
| D | 2 | 16 | 369571 | 3645.71 | 389 | 379 | 101.3 |
| D | 8 | 195 | 71814 | 705.41 | 389 | 379 | 101.3 |
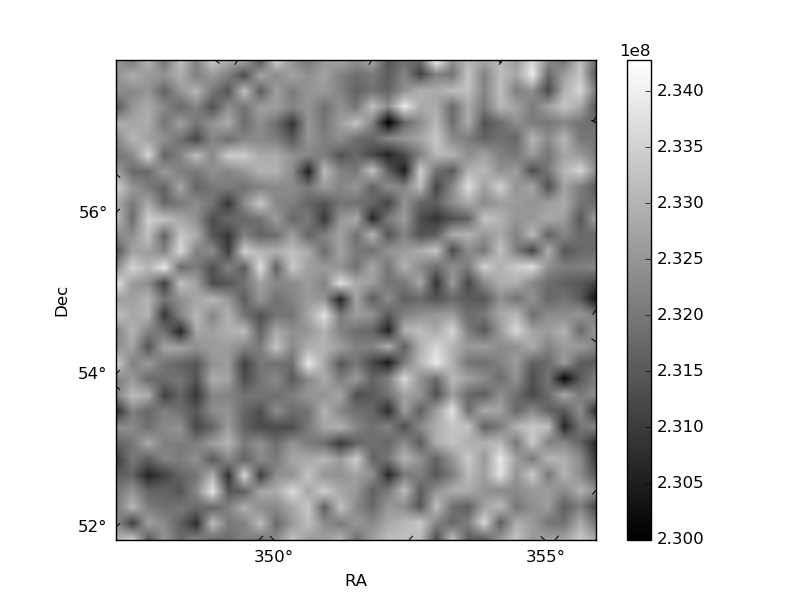
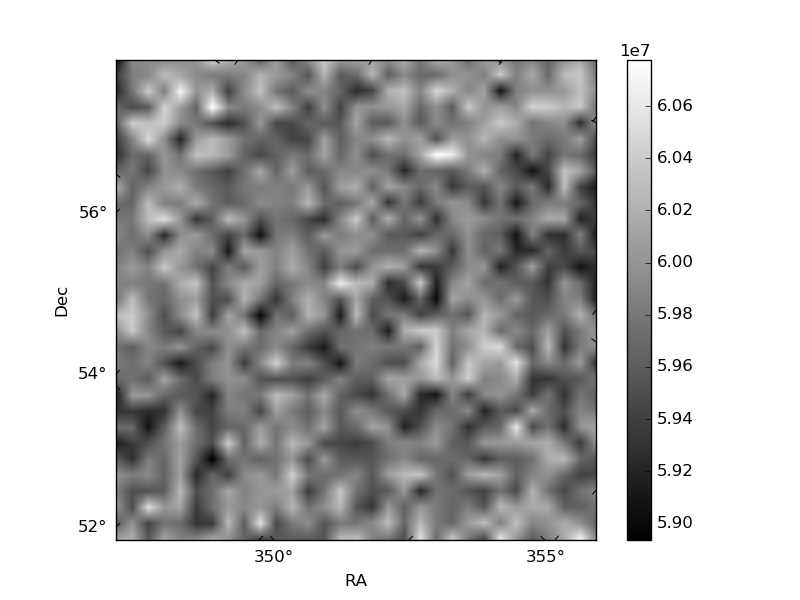
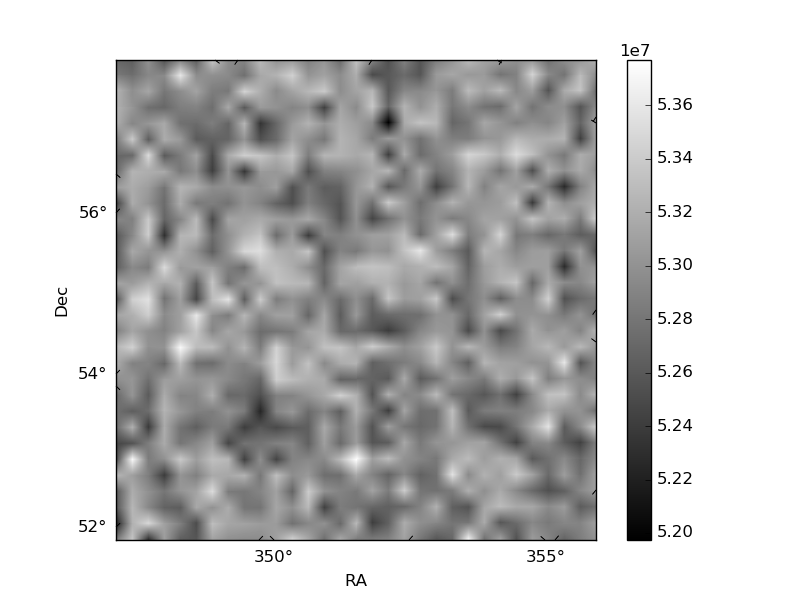
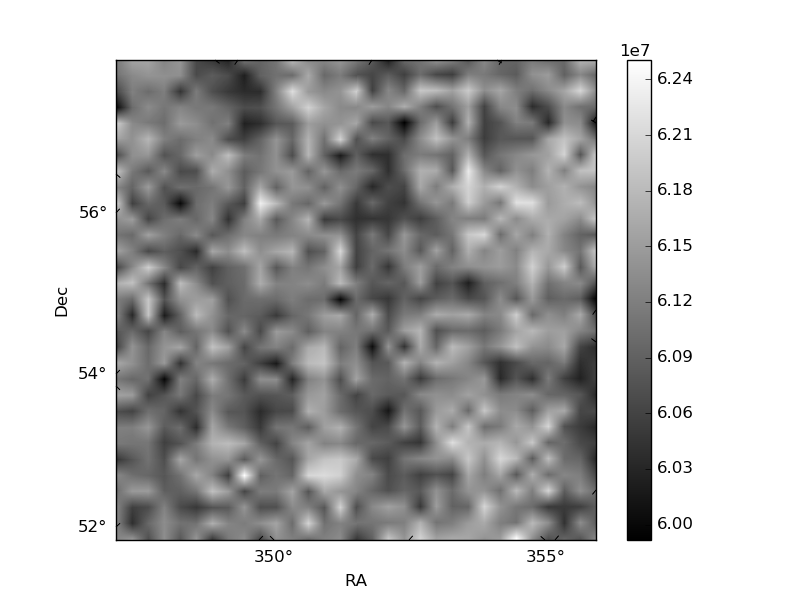
Histogram calculated using DETX and DETY for each event in the final _common_clean file
| Quadrant A | 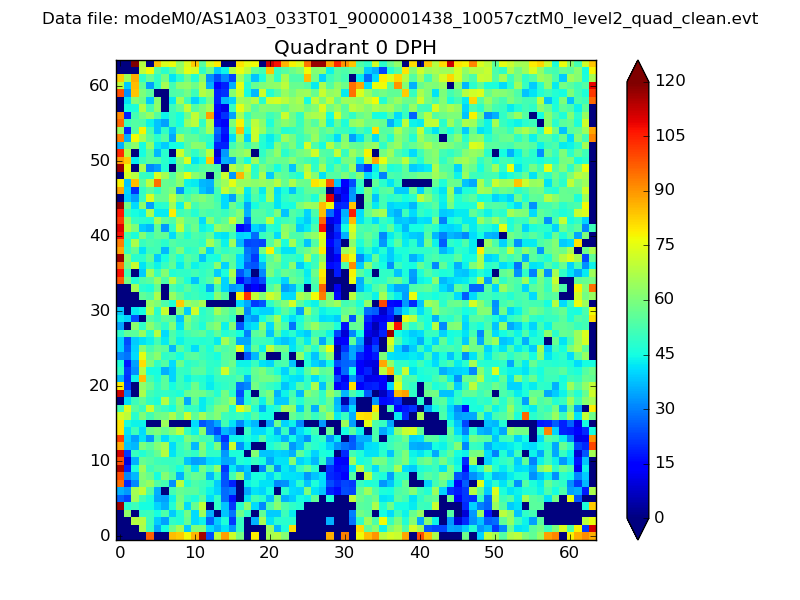 |
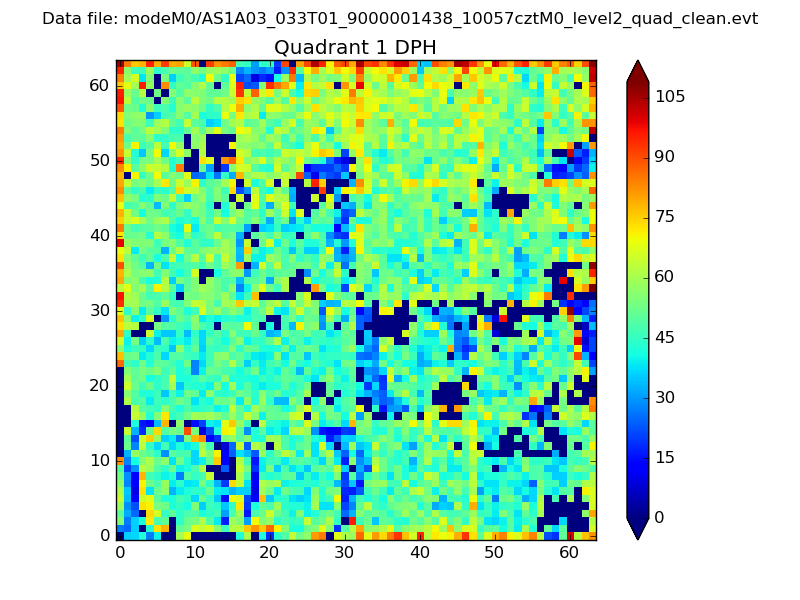 |
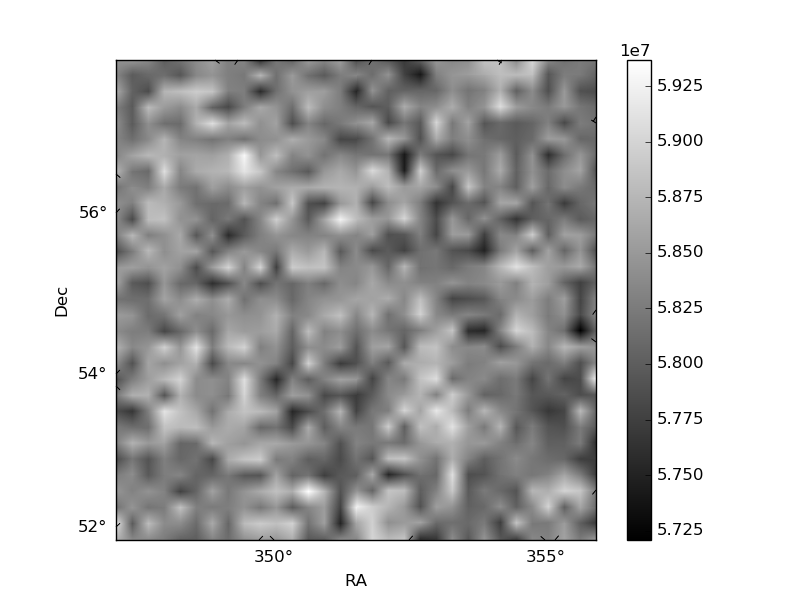
Quadrant B |
|---|---|---|---|
| Quadrant D | 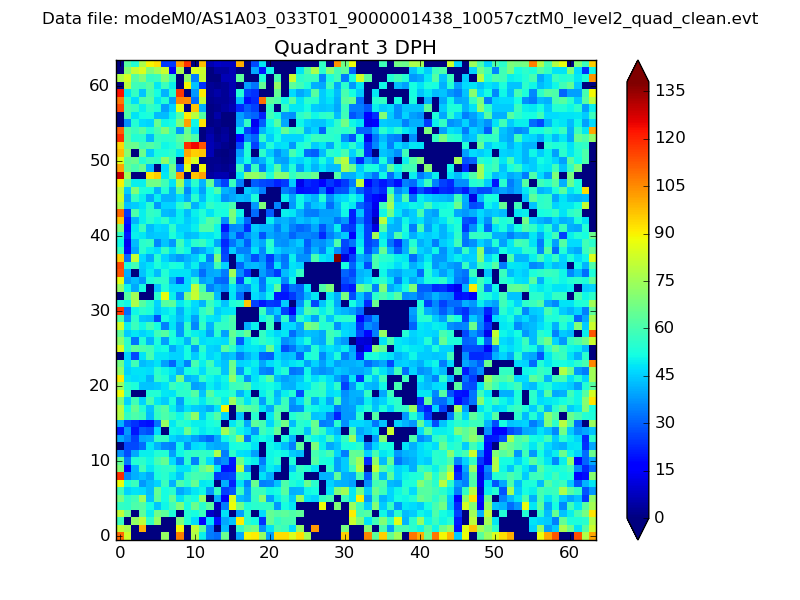 |
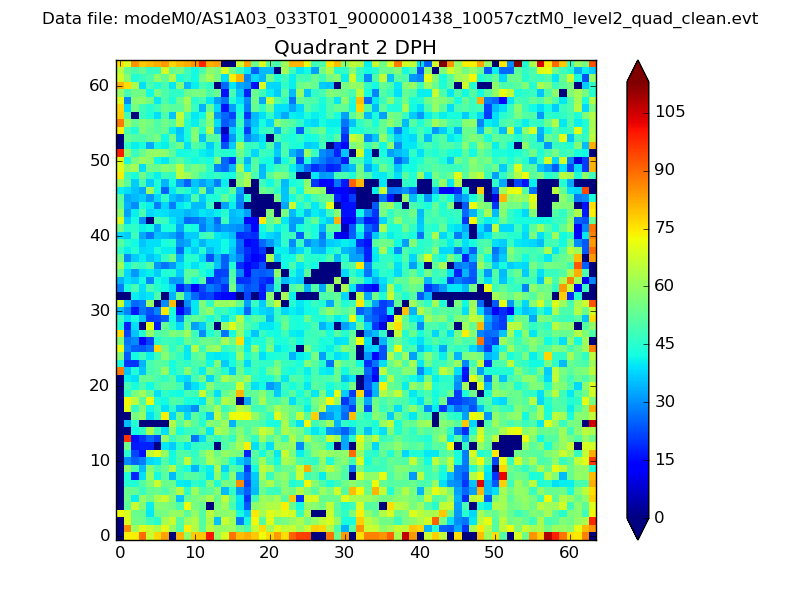 |
Quadrant C |
| Plot type | Count rate plots | Images |
|---|---|---|
| Comparison with Poisson distribution Blue bars denote a histogram of data divided into 1 sec bins. Red curve is a Poisson curve with rate = median count rate of data. |
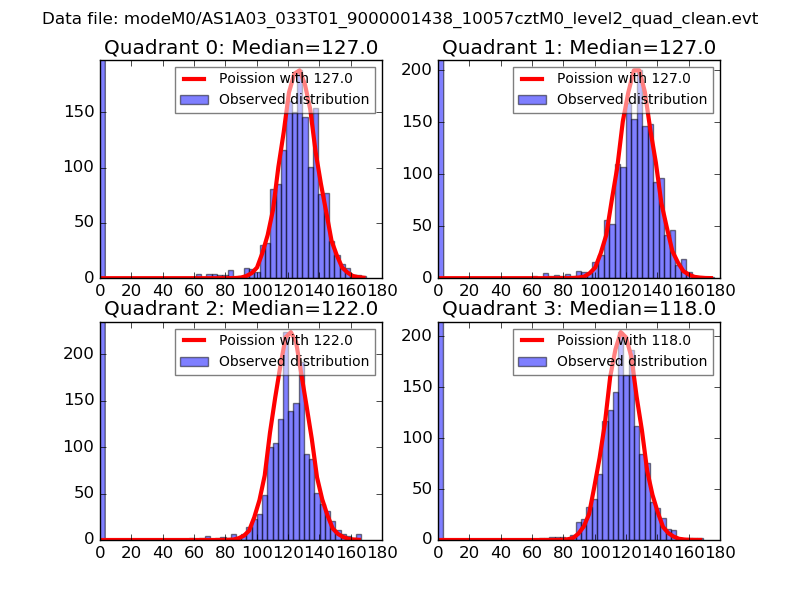 |
 |
| Quadrant-wise count rates Data is divided into 100 sec bins |
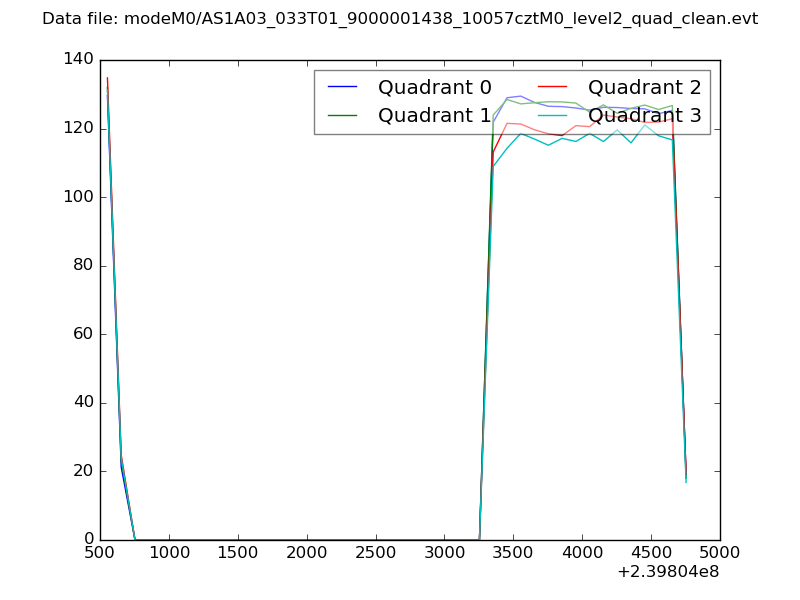 |
|
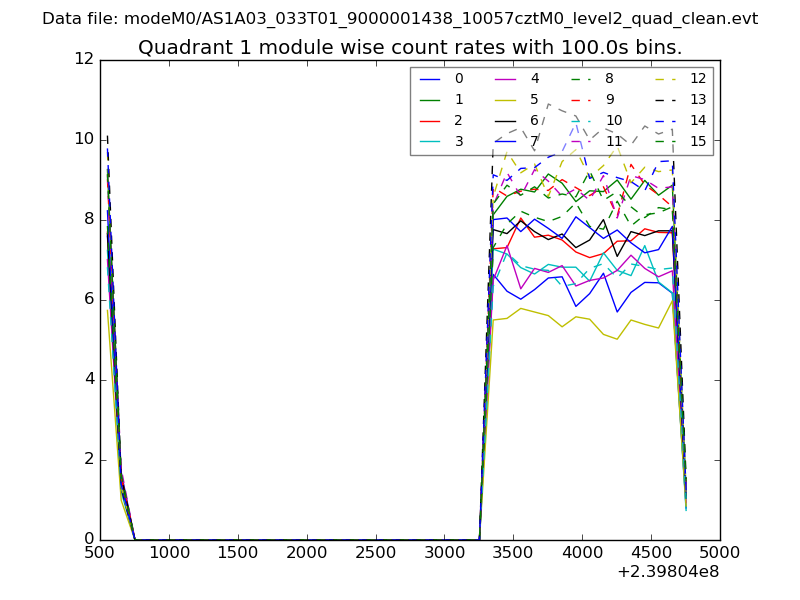
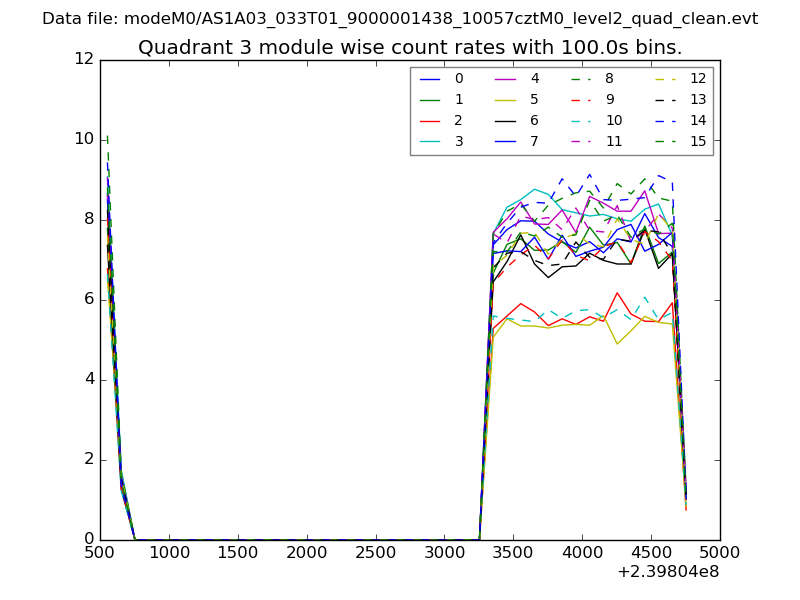
| Module-wise count rates for Quadrant A Data is divided into 100 sec bins |
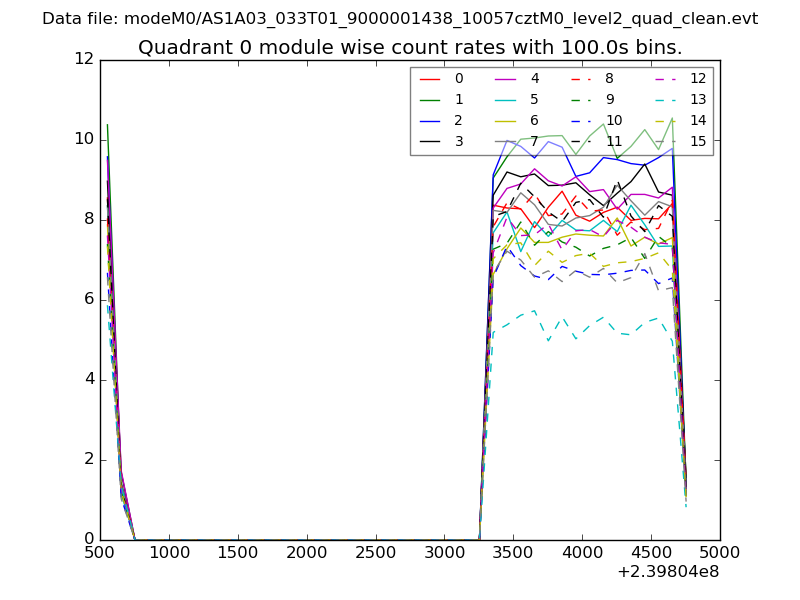 |
 |
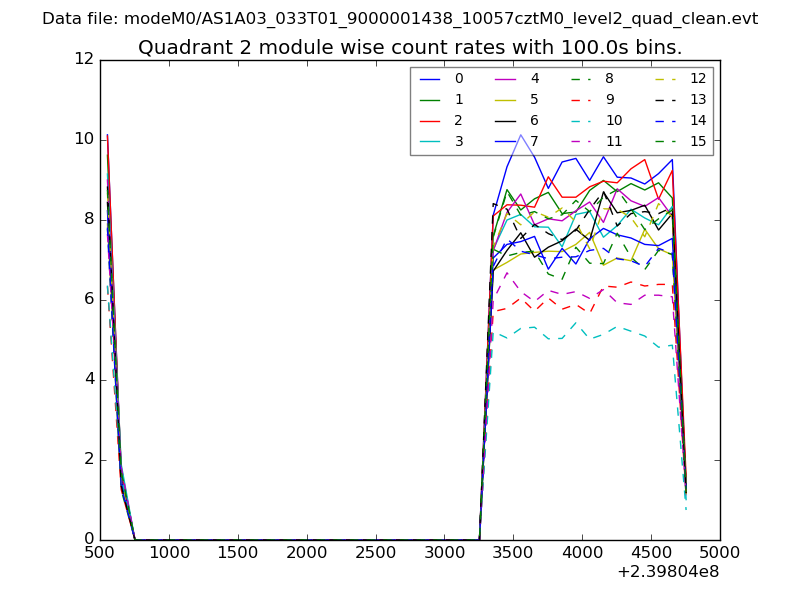
| Module-wise count rates for Quadrant B Data is divided into 100 sec bins |
 |
 |
| Module-wise count rates for Quadrant C Data is divided into 100 sec bins |
 |
 |
| Module-wise count rates for Quadrant D Data is divided into 100 sec bins |
 |
 |
| Parameter | Plot |
|---|---|
| CZT HV Monitor | 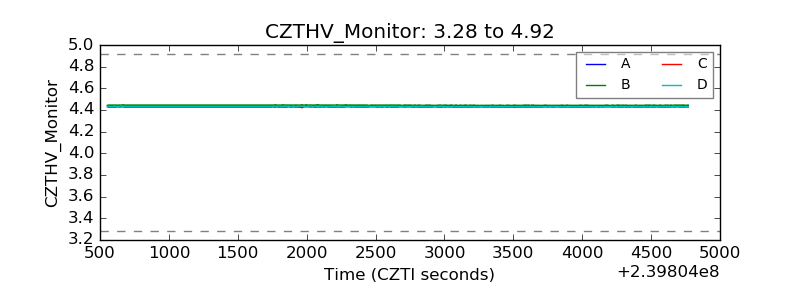 |
| D_VDD | 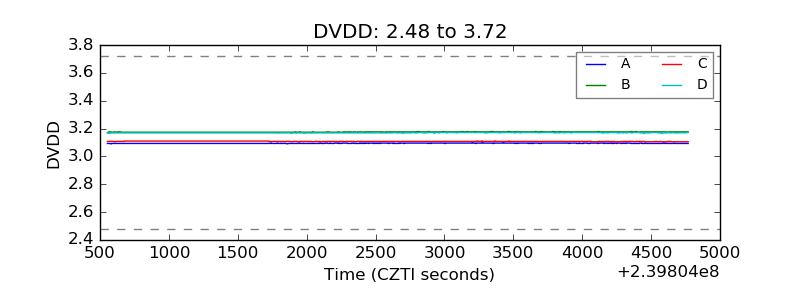 |
| Temperature 1 |  |
| Veto HV Monitor | 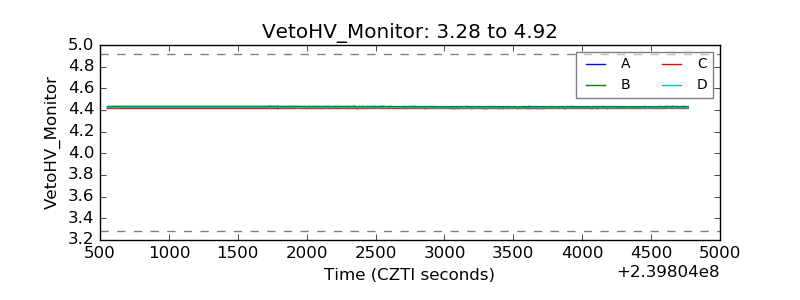 |
| Veto LLD |  |
| Alpha Counter | 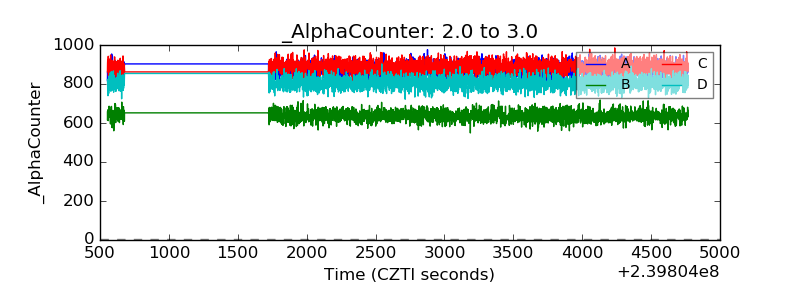 |
| _CPM_Rate | 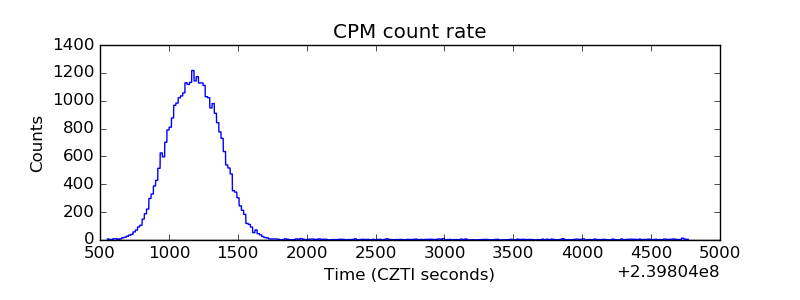 |
| CZT Counter | 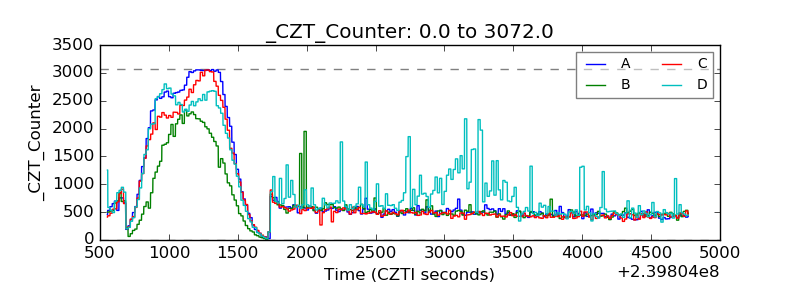 |
| +2.5 Volts monitor |  |
| +5 Volts monitor |  |
| _ROLL_ROT | 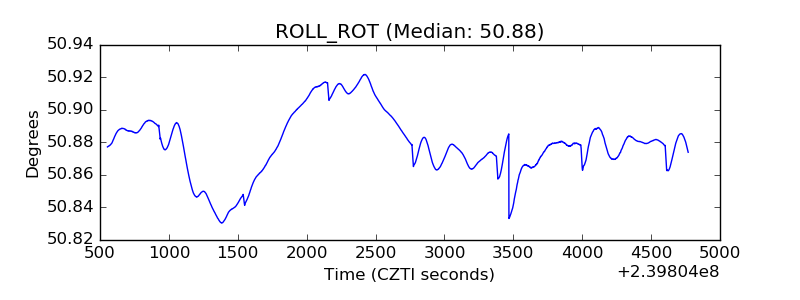 |
| _Roll_DEC | 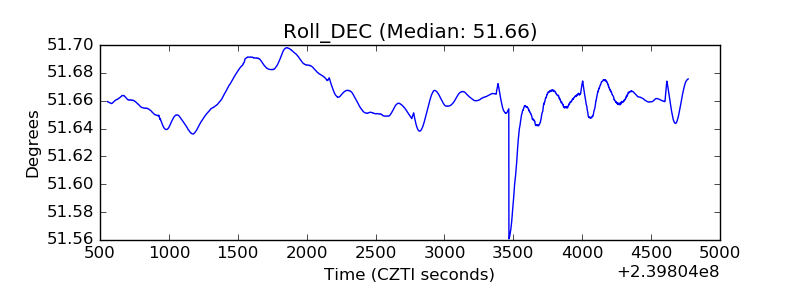 |
| _Roll_RA | 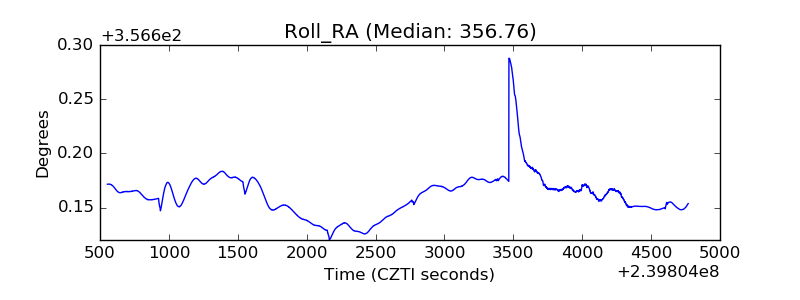 |
| Veto Counter | 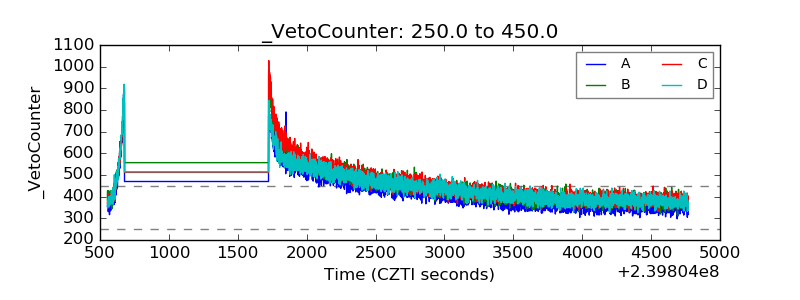 |