| Param | Original file | Final file |
|---|---|---|
| Filename | modeM0/AS1A03_084T01_9000001440cztM0_level2.fits | modeM0/AS1A03_084T01_9000001440cztM0_level2_quad_clean.evt |
| Size (bytes) | 256,057,920 | 173,891,520 |
| Size | 244.2 MB | 165.8 MB |
| Events in quadrant A | 1,583,050 | 908,674 |
| Events in quadrant B | 1,519,030 | 913,796 |
| Events in quadrant C | 1,545,706 | 862,000 |
| Events in quadrant D | 1,277,192 | 751,115 |
| Mode M0 | |||
|---|---|---|---|
| Quadrant | BADHDUFLAG | Total packets | Discarded packets |
| A | 0 | 57863 | 0 |
| B | 0 | 57798 | 0 |
| C | 0 | 54927 | 0 |
| D | 0 | 85662 | 0 |
| Mode SS | |||
|---|---|---|---|
| Quadrant | BADHDUFLAG | Total packets | Discarded packets |
| A | 0 | 550 | 0 |
| B | 0 | 550 | 0 |
| C | 0 | 550 | 0 |
| D | 0 | 550 | 0 |
| Mode M9 | |||
|---|---|---|---|
| Quadrant | BADHDUFLAG | Total packets | Discarded packets |
| A | 0 | 69 | 0 |
| B | 0 | 69 | 0 |
| C | 0 | 69 | 0 |
| D | 0 | 69 | 0 |
| Quadrant | Total seconds | Saturated seconds | Saturation percentage |
|---|---|---|---|
| A | 26570 | 333 | 1.253293% |
| B | 26578 | 316 | 1.188953% |
| C | 26586 | 146 | 0.549161% |
| D | 26556 | 2218 | 8.352161% |
Noise dominated data is calculated using 1-second bins in cleaned event files. If a bin has >2000 counts, and if more than 50% of those come from <1% of pixels, then it is considered to be noise-dominated and hence unusable.
| Quadrant | # 1 sec bins | Bins with >0 counts | Bins with >2000 counts | High rate bins dominated by noise | Noise dominated (total time) | Noise dominated (detector-on time) | Marked lightcurve |
|---|---|---|---|---|---|---|---|
| A | 33748 | 26689 | 0 | 0 | 0.00% | 0.00% |  |
| B | 33748 | 26691 | 0 | 0 | 0.00% | 0.00% | 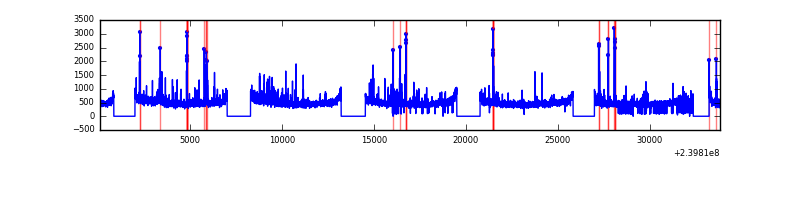 |
| C | 33748 | 26696 | 0 | 0 | 0.00% | 0.00% |  |
| D | 33748 | 26642 | 0 | 0 | 0.00% | 0.00% |  |
Top three noisy pixels from each quadrant. If the there are fewer than three noisy pixels in the level2.evt file, extra rows are filled as -1
| Pixel properties | Quadrant properties | ||||||
|---|---|---|---|---|---|---|---|
| Quadrant | DetID | PixID | Counts | Sigma | Mean | Median | Sigma |
| A | 0 | 29 | 1536 | 10.9 | 412 | 388 | 105.3 |
| A | 7 | 110 | 1280 | 8.47 | 412 | 388 | 105.3 |
| A | 0 | 30 | 1188 | 7.6 | 412 | 388 | 105.3 |
| B | 2 | 9 | 1321 | 11.41 | 402 | 384 | 82.1 |
| B | 3 | 80 | 1028 | 7.84 | 402 | 384 | 82.1 |
| B | 12 | 226 | 1013 | 7.66 | 402 | 384 | 82.1 |
| C | 1 | 80 | 1092 | 6.53 | 408 | 379 | 109.2 |
| C | 1 | 81 | 1091 | 6.52 | 408 | 379 | 109.2 |
| C | 12 | 241 | 1067 | 6.3 | 408 | 379 | 109.2 |
| D | 3 | 14 | 983 | 6.65 | 363 | 330 | 98.2 |
| D | 6 | 231 | 951 | 6.32 | 363 | 330 | 98.2 |
| D | 6 | 67 | 912 | 5.92 | 363 | 330 | 98.2 |
Histogram calculated using DETX and DETY for each event in the final _common_clean file
| Quadrant A |  |
 |
Quadrant B |
|---|---|---|---|
| Quadrant D |  |
 |
Quadrant C |
| Plot type | Count rate plots | Images |
|---|---|---|
| Comparison with Poisson distribution Blue bars denote a histogram of data divided into 1 sec bins. Red curve is a Poisson curve with rate = median count rate of data. |
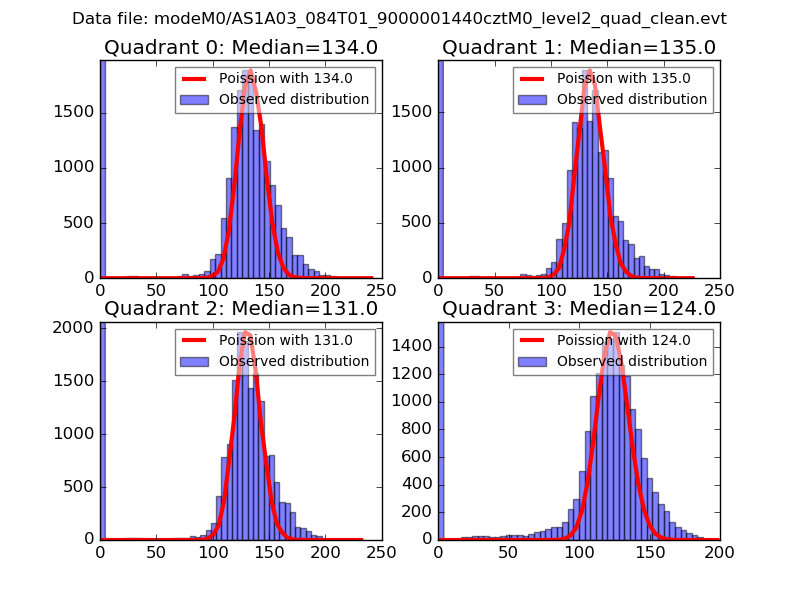 |
 |
| Quadrant-wise count rates Data is divided into 100 sec bins |
 |
|
| Module-wise count rates for Quadrant A Data is divided into 100 sec bins |
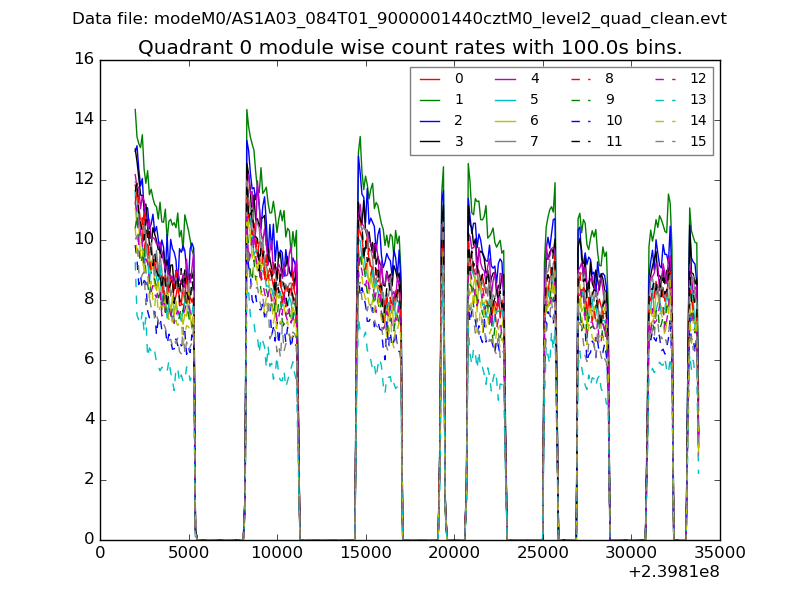 |
 |
| Module-wise count rates for Quadrant B Data is divided into 100 sec bins |
 |
 |
| Module-wise count rates for Quadrant C Data is divided into 100 sec bins |
 |
 |
| Module-wise count rates for Quadrant D Data is divided into 100 sec bins |
 |
 |
| Parameter | Plot |
|---|---|
| CZT HV Monitor |  |
| D_VDD | 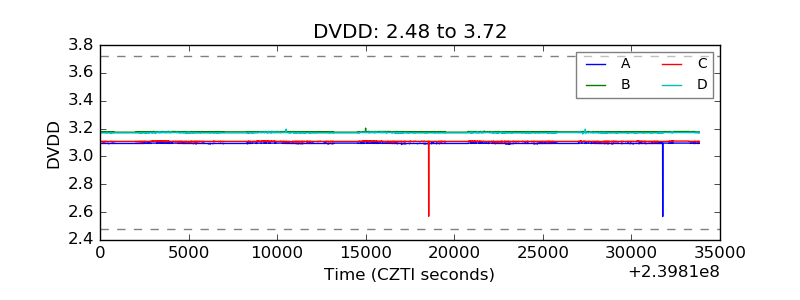 |
| Temperature 1 |  |
| Veto HV Monitor | 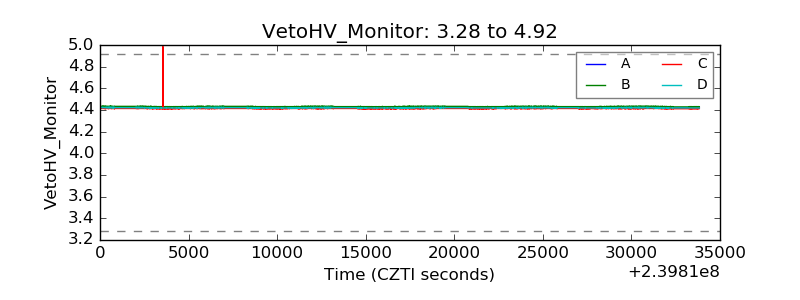 |
| Veto LLD |  |
| Alpha Counter |  |
| _CPM_Rate |  |
| CZT Counter | 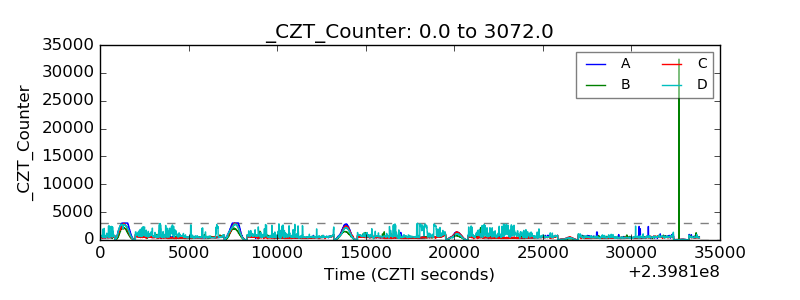 |
| +2.5 Volts monitor |  |
| +5 Volts monitor |  |
| _ROLL_ROT |  |
| _Roll_DEC | 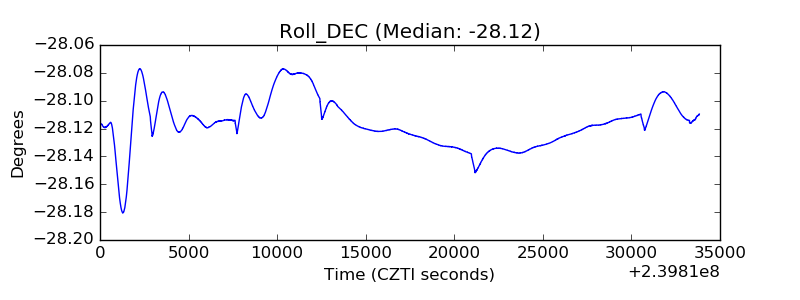 |
| _Roll_RA |  |
| Veto Counter |  |