| Param | Original file | Final file |
|---|---|---|
| Filename | modeM0/AS1A03_084T01_9000001440_10057cztM0_level2.evt | modeM0/AS1A03_084T01_9000001440_10057cztM0_level2_quad_clean.evt |
| Size (bytes) | 207,302,400 | 34,865,280 |
| Size | 197.7 MB | 33.3 MB |
| Events in quadrant A | 1,220,501 | 232,225 |
| Events in quadrant B | 1,306,591 | 233,829 |
| Events in quadrant C | 1,169,461 | 224,626 |
| Events in quadrant D | 2,426,515 | 201,915 |
| Mode M0 | |||
|---|---|---|---|
| Quadrant | BADHDUFLAG | Total packets | Discarded packets |
| A | 0 | 5042 | 2 |
| B | 0 | 5351 | 1 |
| C | 0 | 4845 | 1 |
| D | 0 | 8784 | 1 |
| Mode SS | |||
|---|---|---|---|
| Quadrant | BADHDUFLAG | Total packets | Discarded packets |
| A | 0 | 48 | 0 |
| B | 0 | 48 | 0 |
| C | 0 | 48 | 0 |
| D | 0 | 48 | 0 |
| Mode M9 | |||
|---|---|---|---|
| Quadrant | BADHDUFLAG | Total packets | Discarded packets |
| A | 0 | 11 | 0 |
| B | 0 | 11 | 0 |
| C | 0 | 11 | 0 |
| D | 0 | 11 | 0 |
| Quadrant | Total seconds | Saturated seconds | Saturation percentage |
|---|---|---|---|
| A | 2251 | 56 | 2.487783% |
| B | 2251 | 67 | 2.976455% |
| C | 2251 | 36 | 1.599289% |
| D | 2251 | 436 | 19.369169% |
Noise dominated data is calculated using 1-second bins in cleaned event files. If a bin has >2000 counts, and if more than 50% of those come from <1% of pixels, then it is considered to be noise-dominated and hence unusable.
| Quadrant | # 1 sec bins | Bins with >0 counts | Bins with >2000 counts | High rate bins dominated by noise | Noise dominated (total time) | Noise dominated (detector-on time) | Marked lightcurve |
|---|---|---|---|---|---|---|---|
| A | 3406 | 2251 | 0 | 0 | 0.00% | 0.00% | 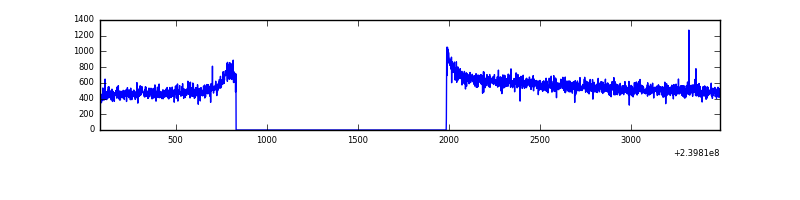 |
| B | 3406 | 2251 | 3 | 3 | 0.09% | 0.13% | 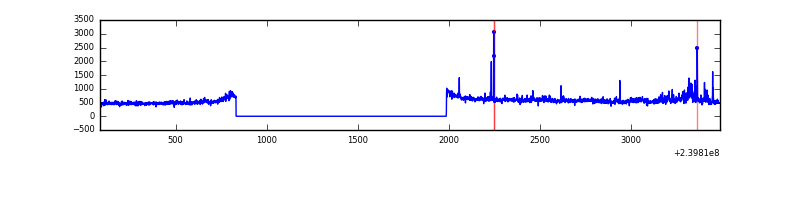 |
| C | 3406 | 2251 | 0 | 0 | 0.00% | 0.00% | 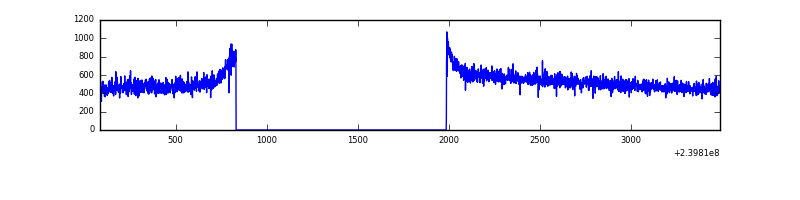 |
| D | 3406 | 2251 | 325 | 325 | 9.54% | 14.44% | 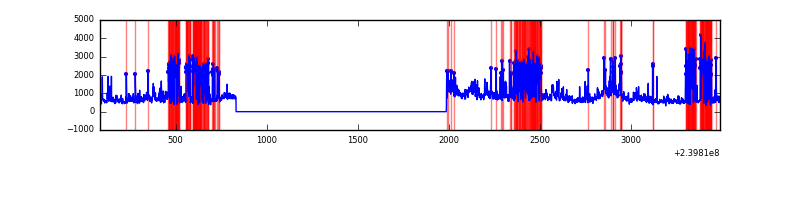 |
Top three noisy pixels from each quadrant. If the there are fewer than three noisy pixels in the level2.evt file, extra rows are filled as -1
| Pixel properties | Quadrant properties | ||||||
|---|---|---|---|---|---|---|---|
| Quadrant | DetID | PixID | Counts | Sigma | Mean | Median | Sigma |
| A | 8 | 15 | 15359 | 233.23 | 313 | 306 | 64.5 |
| A | 0 | 226 | 2897 | 40.14 | 313 | 306 | 64.5 |
| A | 12 | 194 | 2702 | 37.12 | 313 | 306 | 64.5 |
| B | 4 | 81 | 30807 | 503.8 | 309 | 303 | 60.5 |
| B | 0 | 219 | 23885 | 389.48 | 309 | 303 | 60.5 |
| B | 0 | 214 | 23236 | 378.76 | 309 | 303 | 60.5 |
| C | 14 | 67 | 4060 | 53.32 | 298 | 300 | 70.5 |
| C | 13 | 61 | 2253 | 27.69 | 298 | 300 | 70.5 |
| C | 8 | 222 | 828 | 7.49 | 298 | 300 | 70.5 |
| D | 1 | 52 | 764429 | 10757.09 | 286 | 278 | 71.0 |
| D | 2 | 16 | 447679 | 6298.15 | 286 | 278 | 71.0 |
| D | 12 | 233 | 40544 | 566.83 | 286 | 278 | 71.0 |
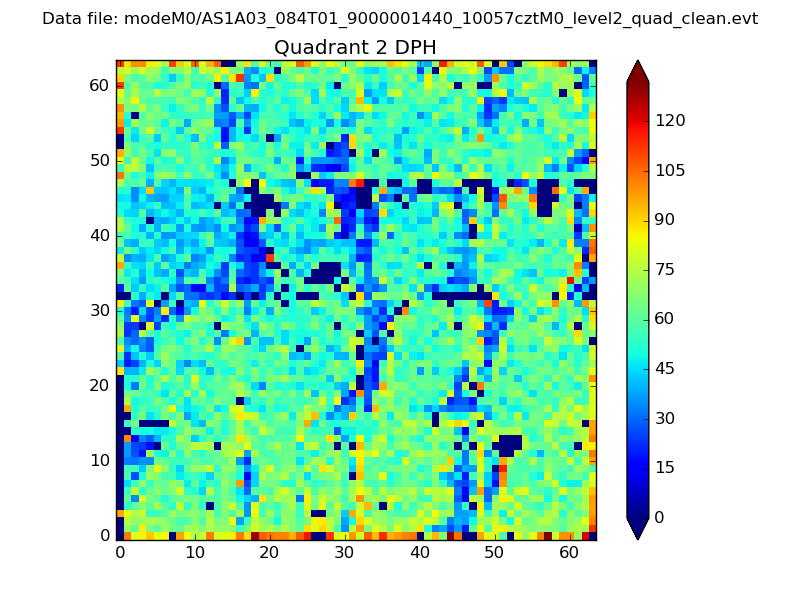
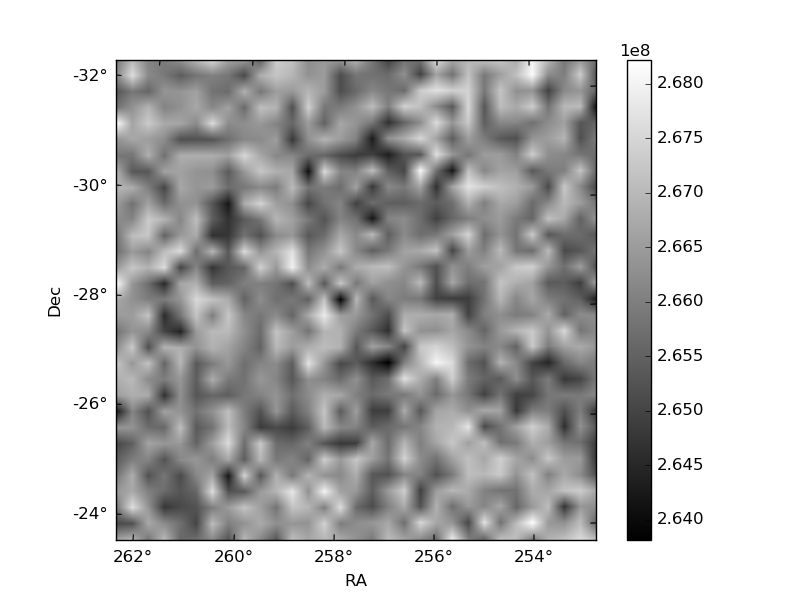
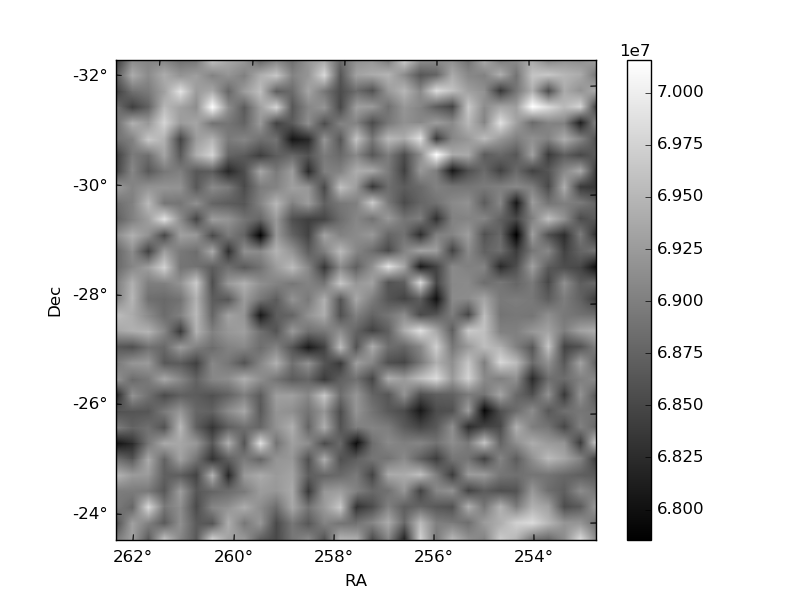
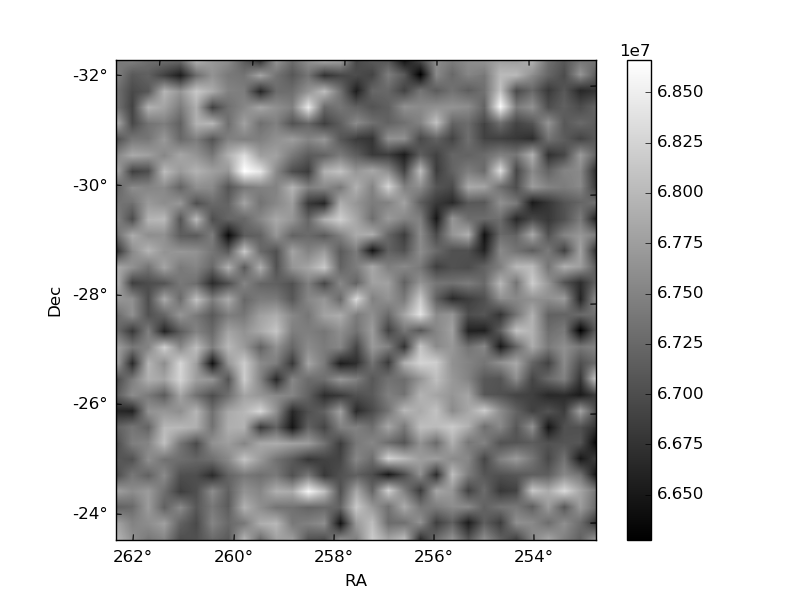
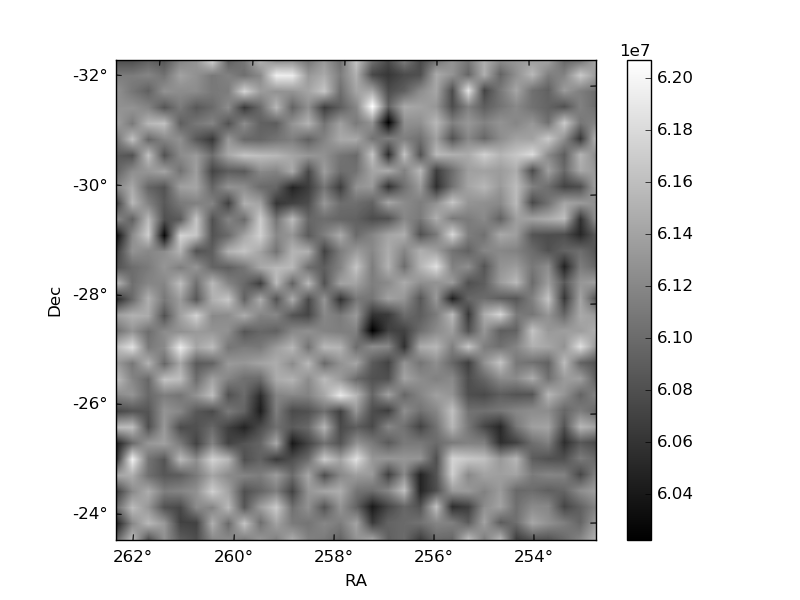
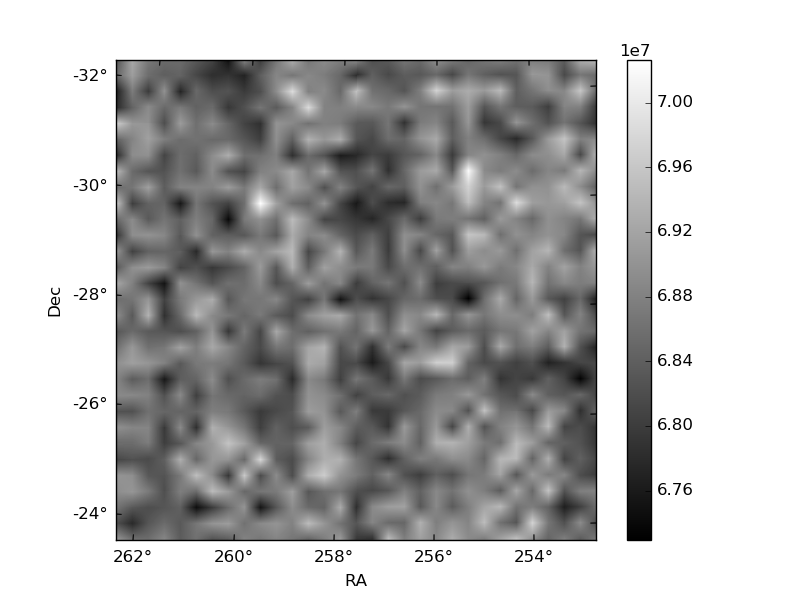
Histogram calculated using DETX and DETY for each event in the final _common_clean file
| Quadrant A | 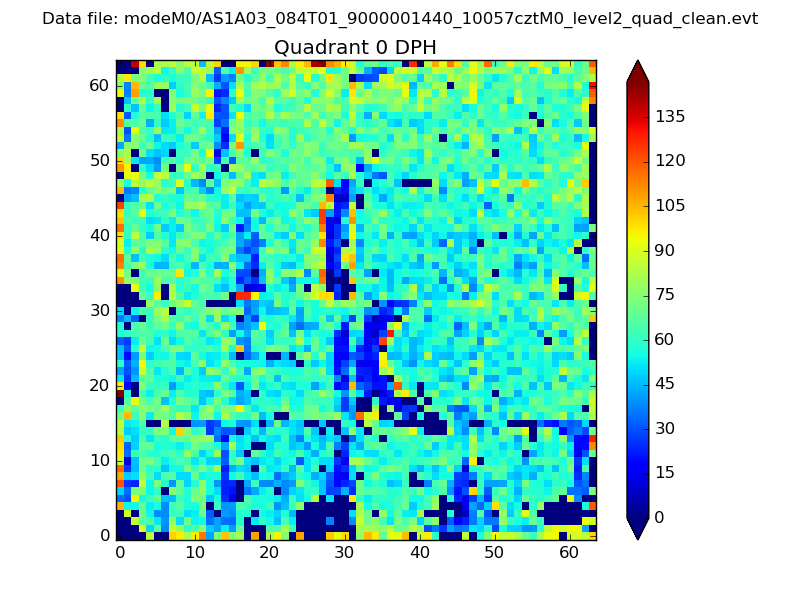 |
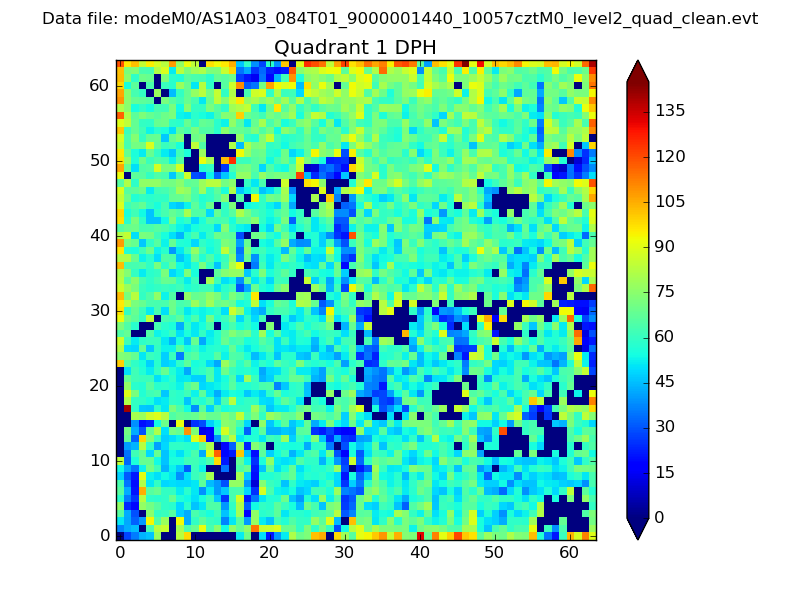 |
Quadrant B |
|---|---|---|---|
| Quadrant D | 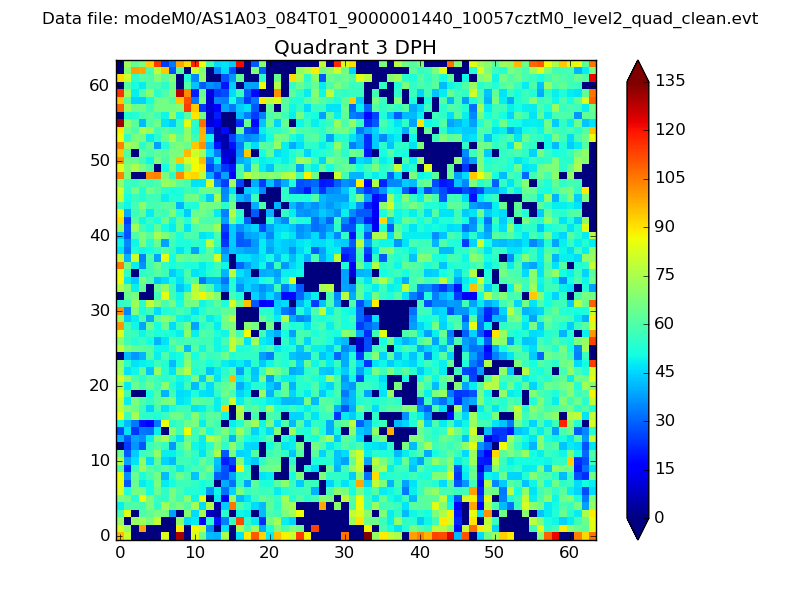 |
 |
Quadrant C |
| Plot type | Count rate plots | Images |
|---|---|---|
| Comparison with Poisson distribution Blue bars denote a histogram of data divided into 1 sec bins. Red curve is a Poisson curve with rate = median count rate of data. |
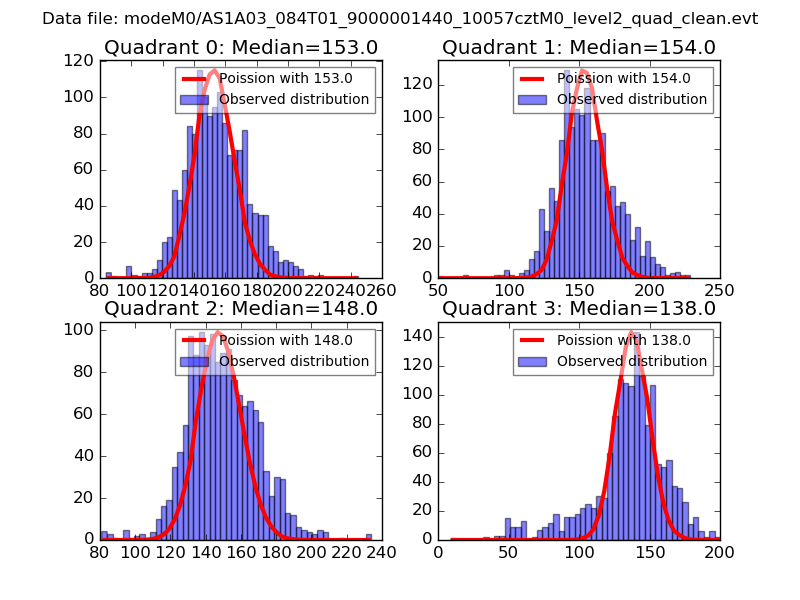 |
 |
| Quadrant-wise count rates Data is divided into 100 sec bins |
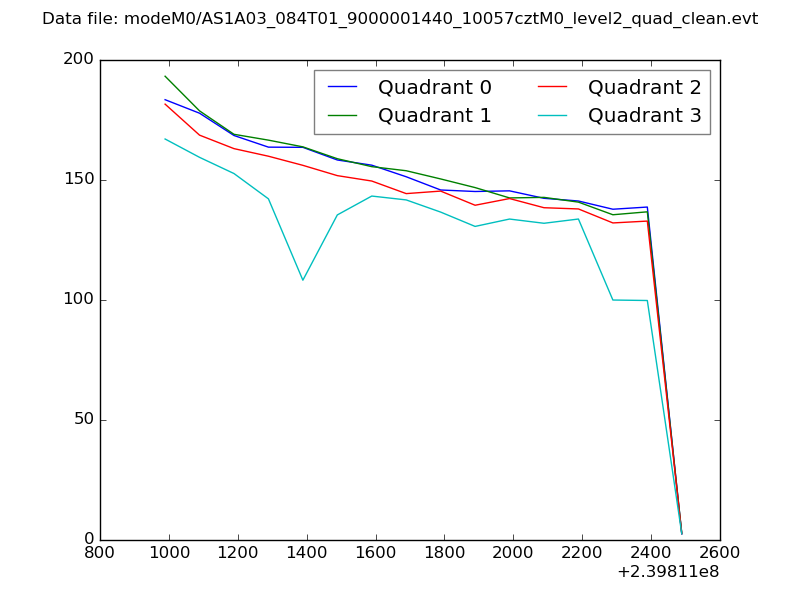 |
|
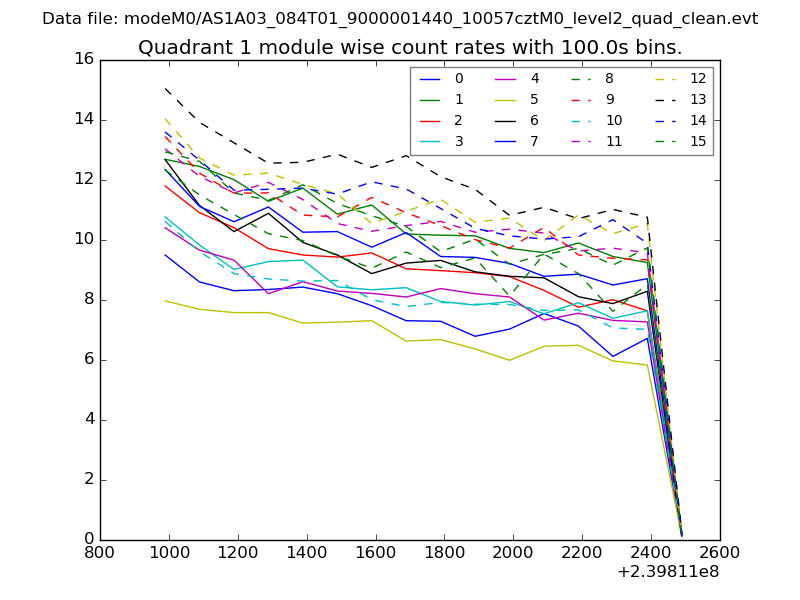
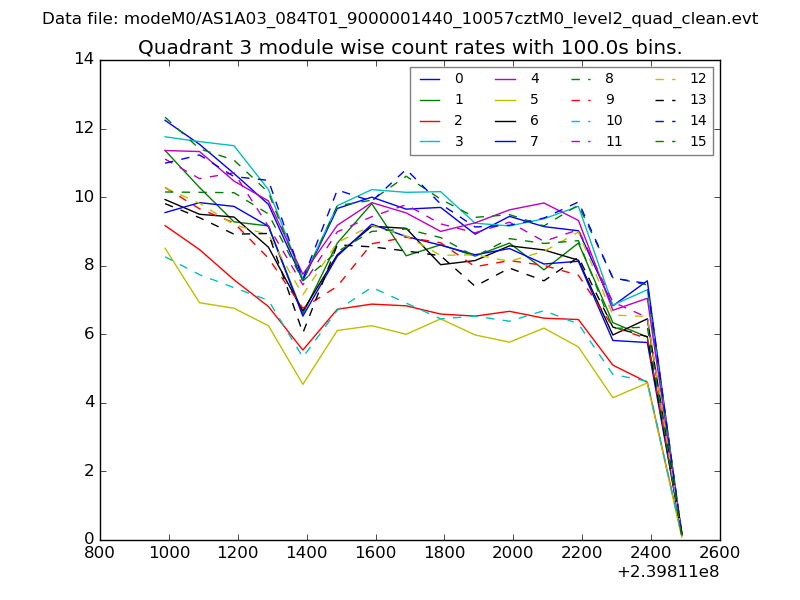
| Module-wise count rates for Quadrant A Data is divided into 100 sec bins |
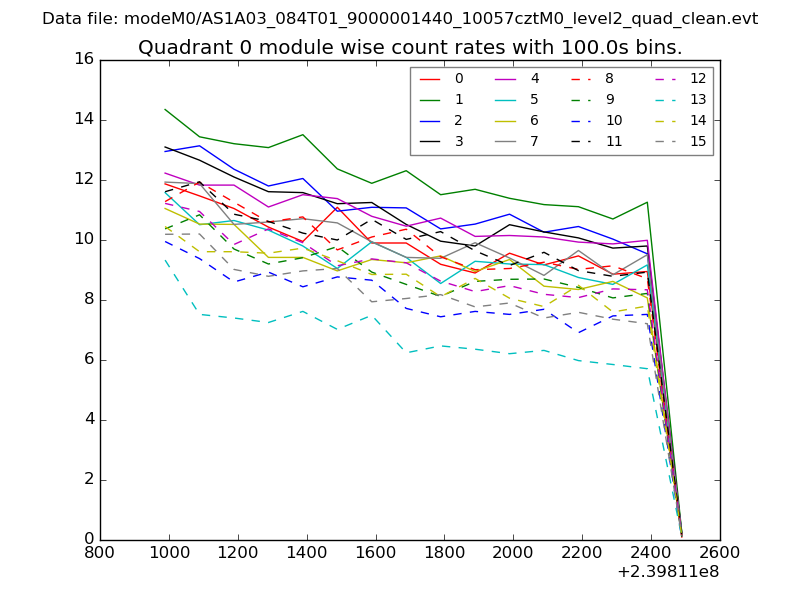 |
 |
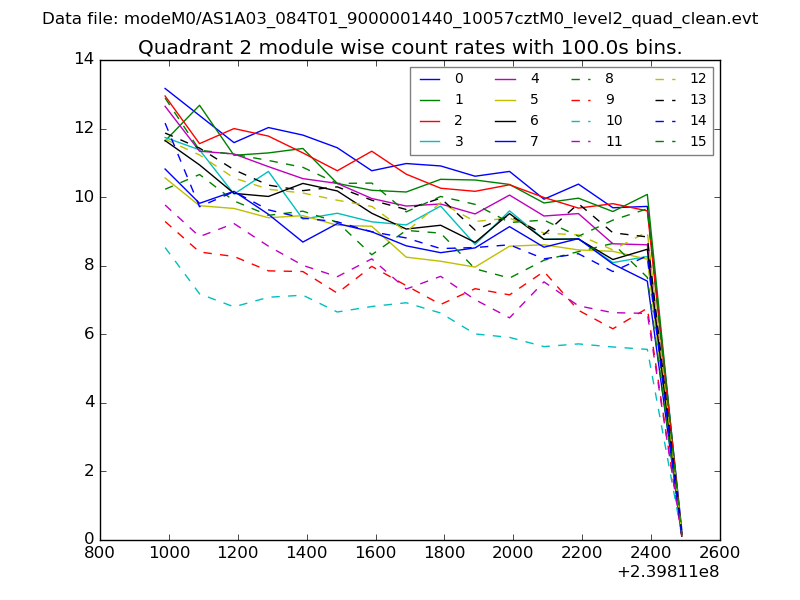
| Module-wise count rates for Quadrant B Data is divided into 100 sec bins |
 |
 |
| Module-wise count rates for Quadrant C Data is divided into 100 sec bins |
 |
 |
| Module-wise count rates for Quadrant D Data is divided into 100 sec bins |
 |
 |
| Parameter | Plot |
|---|---|
| CZT HV Monitor | 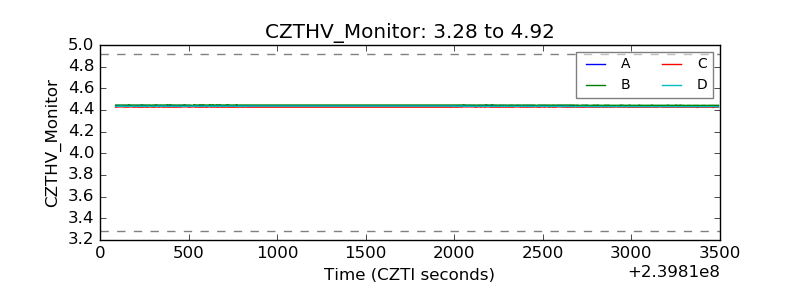 |
| D_VDD | 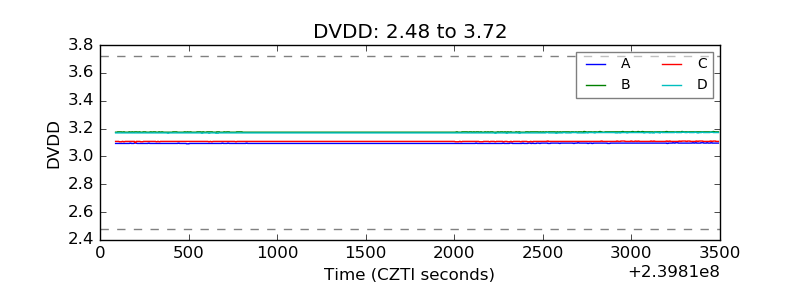 |
| Temperature 1 | 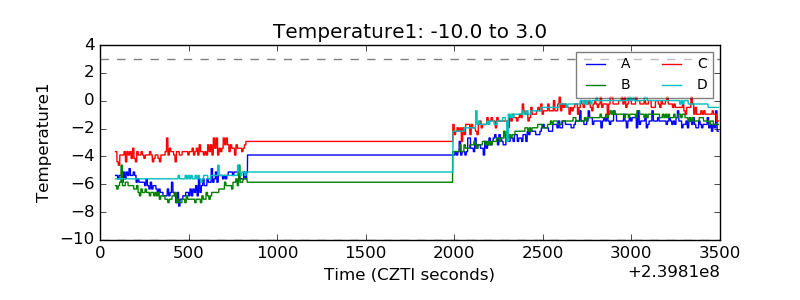 |
| Veto HV Monitor | 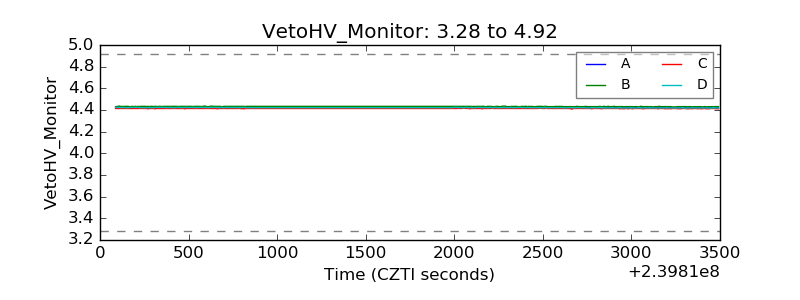 |
| Veto LLD | 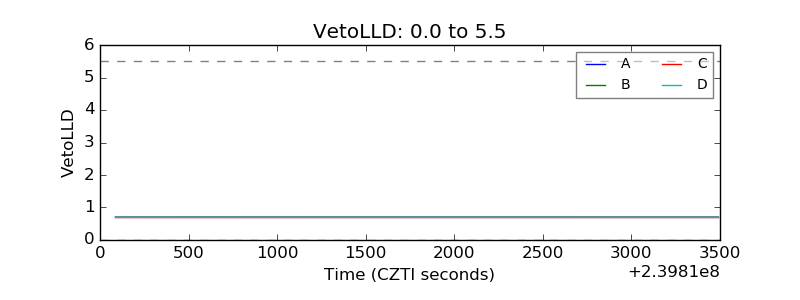 |
| Alpha Counter | 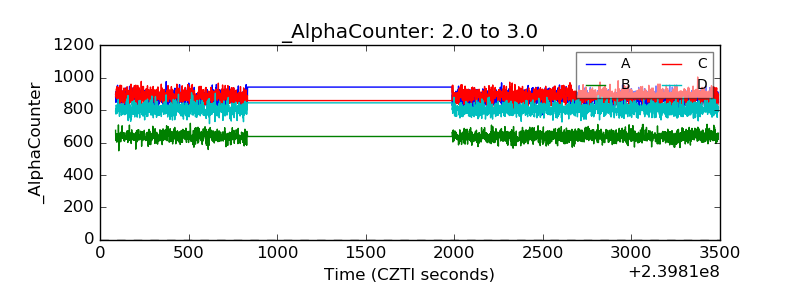 |
| _CPM_Rate | 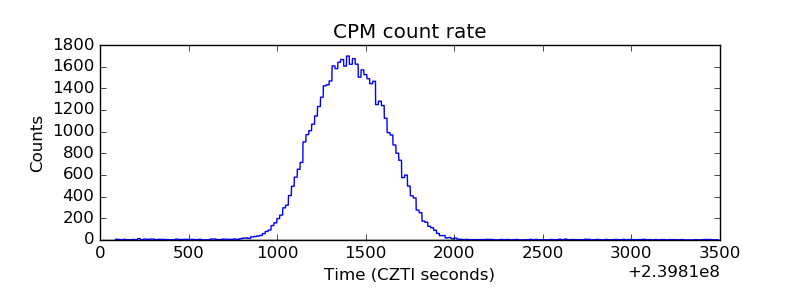 |
| CZT Counter | 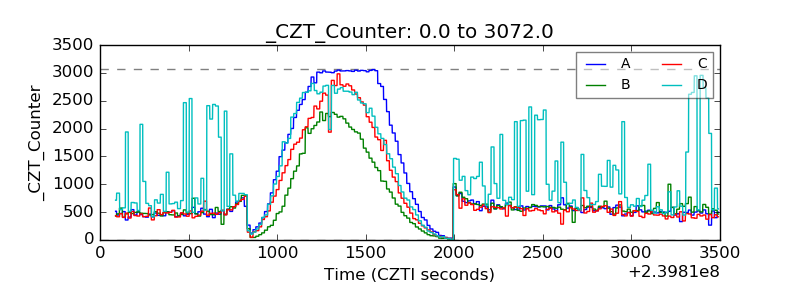 |
| +2.5 Volts monitor | 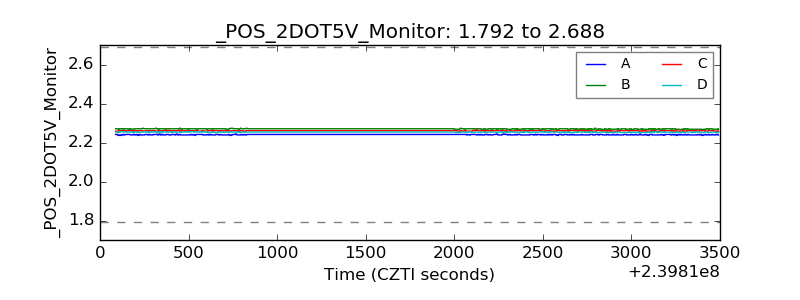 |
| +5 Volts monitor | 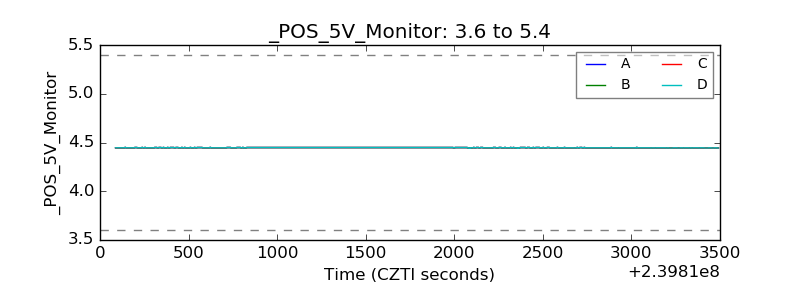 |
| _ROLL_ROT | 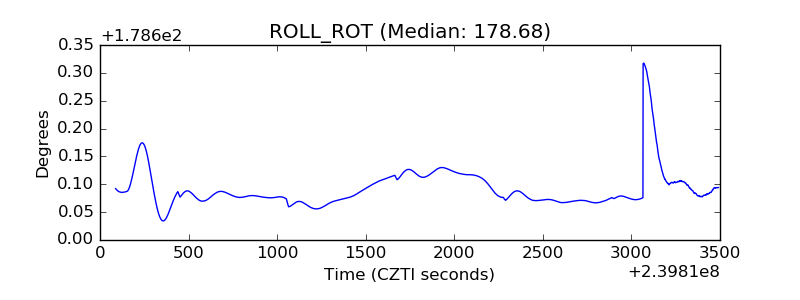 |
| _Roll_DEC | 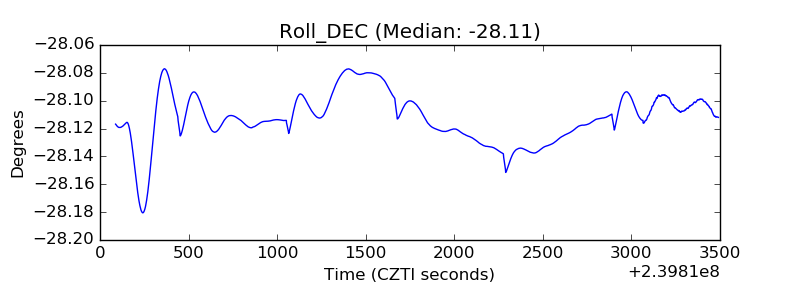 |
| _Roll_RA | 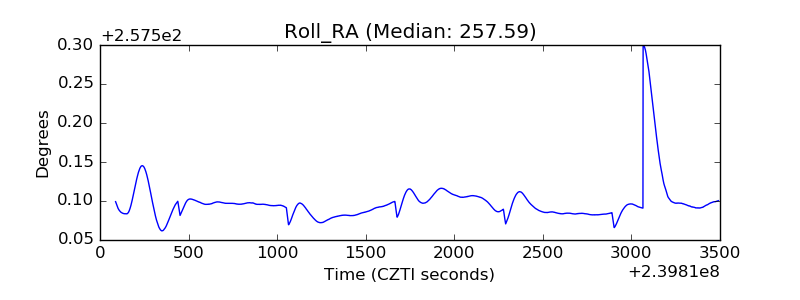 |
| Veto Counter | 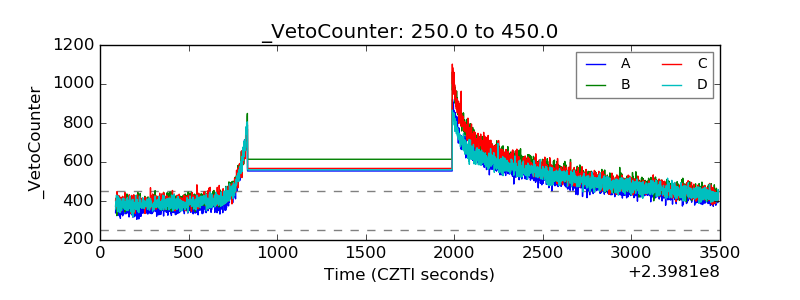 |