| Param | Original file | Final file |
|---|---|---|
| Filename | modeM0/AS1A03_084T01_9000001440_10061cztM0_level2.evt | modeM0/AS1A03_084T01_9000001440_10061cztM0_level2_quad_clean.evt |
| Size (bytes) | 511,430,400 | 84,522,240 |
| Size | 487.7 MB | 80.6 MB |
| Events in quadrant A | 3,233,757 | 539,544 |
| Events in quadrant B | 3,092,066 | 553,094 |
| Events in quadrant C | 2,841,747 | 535,850 |
| Events in quadrant D | 5,894,948 | 492,326 |
| Mode M0 | |||
|---|---|---|---|
| Quadrant | BADHDUFLAG | Total packets | Discarded packets |
| A | 0 | 13909 | 25 |
| B | 0 | 13394 | 15 |
| C | 0 | 12927 | 23 |
| D | 0 | 21891 | 62 |
| Mode SS | |||
|---|---|---|---|
| Quadrant | BADHDUFLAG | Total packets | Discarded packets |
| A | 0 | 128 | 0 |
| B | 0 | 128 | 0 |
| C | 0 | 128 | 0 |
| D | 0 | 128 | 0 |
| Mode M9 | |||
|---|---|---|---|
| Quadrant | BADHDUFLAG | Total packets | Discarded packets |
| A | 0 | 15 | 0 |
| B | 0 | 15 | 0 |
| C | 0 | 15 | 0 |
| D | 0 | 16 | 0 |
| Quadrant | Total seconds | Saturated seconds | Saturation percentage |
|---|---|---|---|
| A | 6283 | 24 | 0.381983% |
| B | 6288 | 31 | 0.493003% |
| C | 6284 | 7 | 0.111394% |
| D | 6281 | 429 | 6.830123% |
Noise dominated data is calculated using 1-second bins in cleaned event files. If a bin has >2000 counts, and if more than 50% of those come from <1% of pixels, then it is considered to be noise-dominated and hence unusable.
| Quadrant | # 1 sec bins | Bins with >0 counts | Bins with >2000 counts | High rate bins dominated by noise | Noise dominated (total time) | Noise dominated (detector-on time) | Marked lightcurve |
|---|---|---|---|---|---|---|---|
| A | 7459 | 6295 | 6 | 6 | 0.08% | 0.10% | 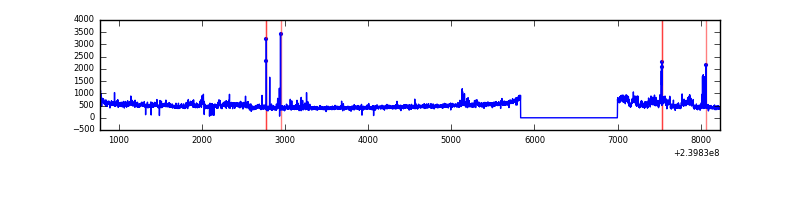 |
| B | 7459 | 6295 | 13 | 13 | 0.17% | 0.21% | 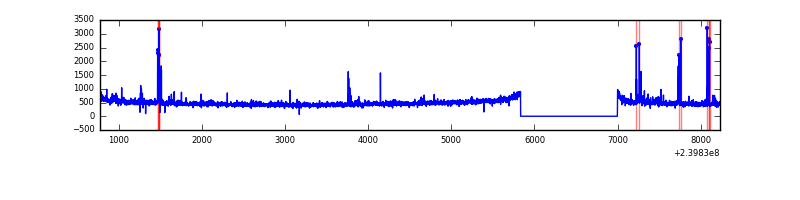 |
| C | 7459 | 6295 | 1 | 1 | 0.01% | 0.02% | 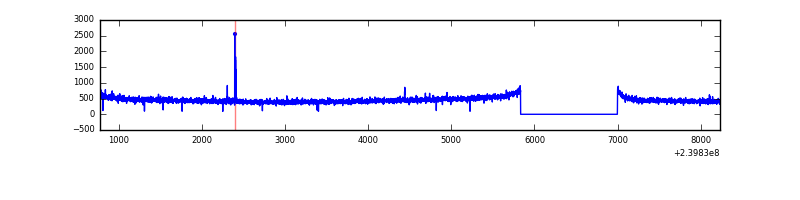 |
| D | 7459 | 6294 | 450 | 450 | 6.03% | 7.15% | 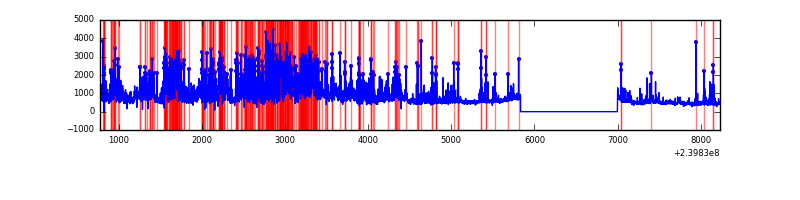 |
Top three noisy pixels from each quadrant. If the there are fewer than three noisy pixels in the level2.evt file, extra rows are filled as -1
| Pixel properties | Quadrant properties | ||||||
|---|---|---|---|---|---|---|---|
| Quadrant | DetID | PixID | Counts | Sigma | Mean | Median | Sigma |
| A | 0 | 8 | 245176 | 1603.31 | 748 | 732 | 152.5 |
| A | 15 | 239 | 63052 | 408.76 | 748 | 732 | 152.5 |
| A | 13 | 251 | 28784 | 183.99 | 748 | 732 | 152.5 |
| B | 4 | 239 | 76621 | 528.67 | 755 | 739 | 143.5 |
| B | 0 | 214 | 22923 | 154.56 | 755 | 739 | 143.5 |
| B | 4 | 81 | 19233 | 128.85 | 755 | 739 | 143.5 |
| C | 14 | 234 | 13479 | 75.7 | 721 | 724 | 168.5 |
| C | 14 | 67 | 10905 | 60.43 | 721 | 724 | 168.5 |
| C | 13 | 61 | 5455 | 28.08 | 721 | 724 | 168.5 |
| D | 4 | 95 | 1975194 | 10469.7 | 690 | 675 | 188.6 |
| D | 1 | 52 | 976178 | 5172.51 | 690 | 675 | 188.6 |
| D | 8 | 195 | 92841 | 488.7 | 690 | 675 | 188.6 |
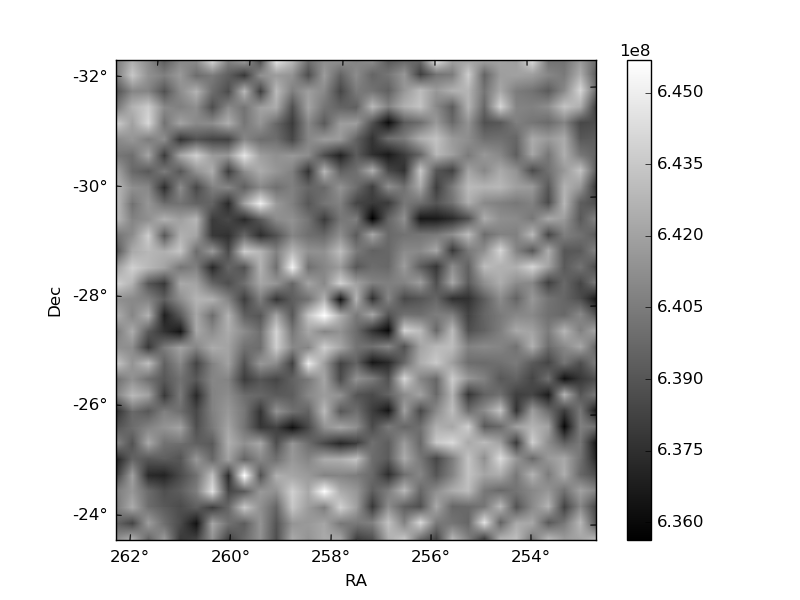
Histogram calculated using DETX and DETY for each event in the final _common_clean file
| Quadrant A | 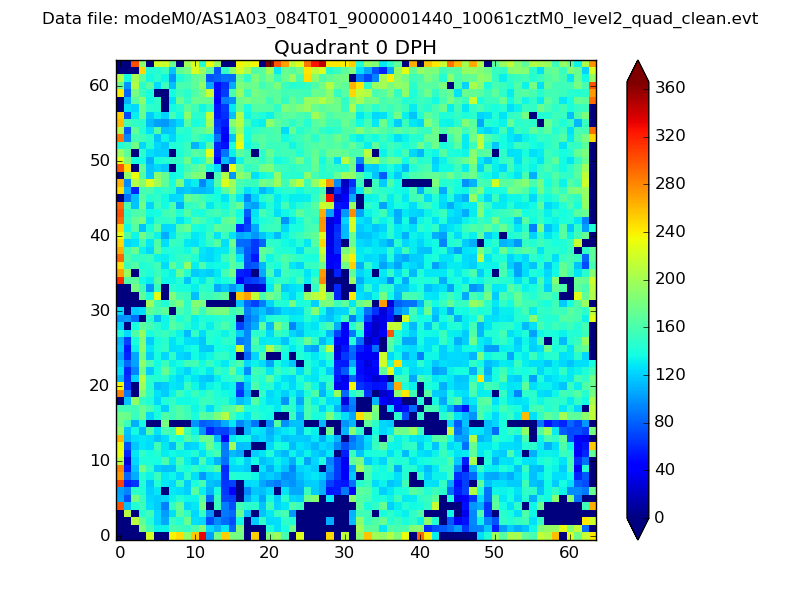 |
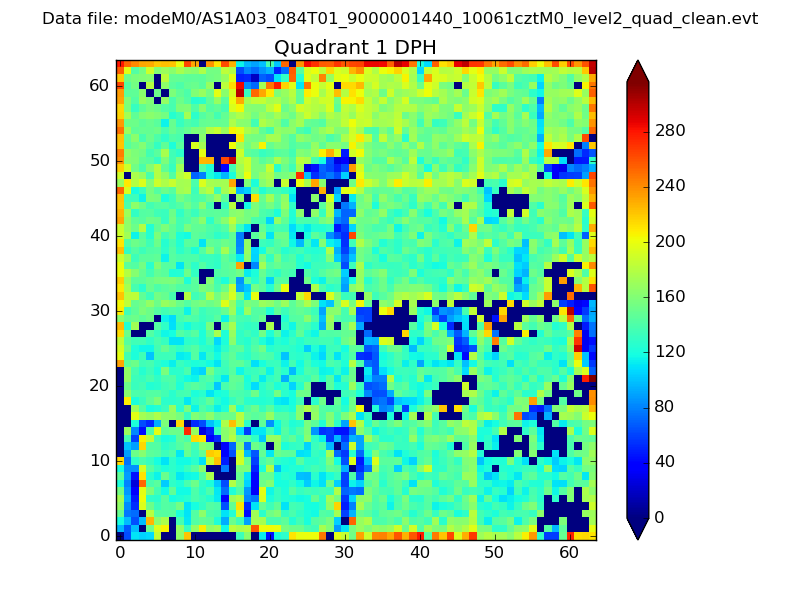 |
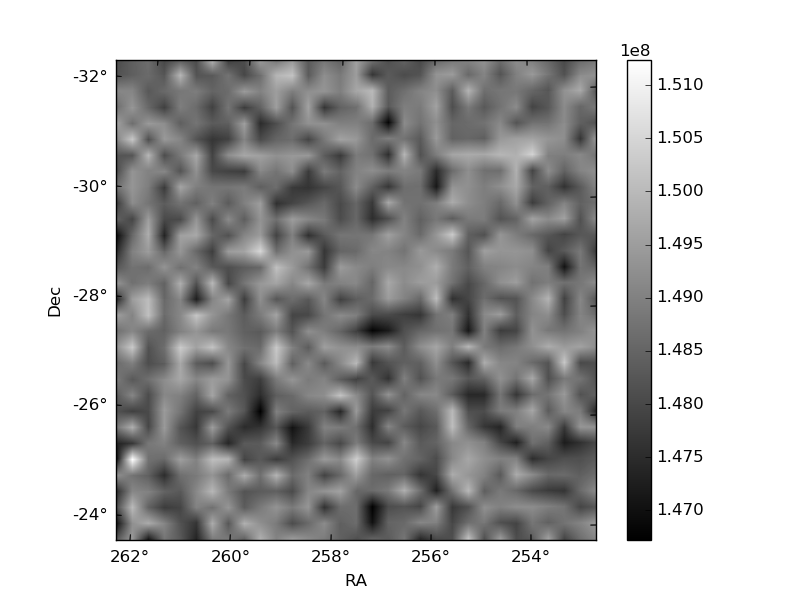
Quadrant B |
|---|---|---|---|
| Quadrant D |  |
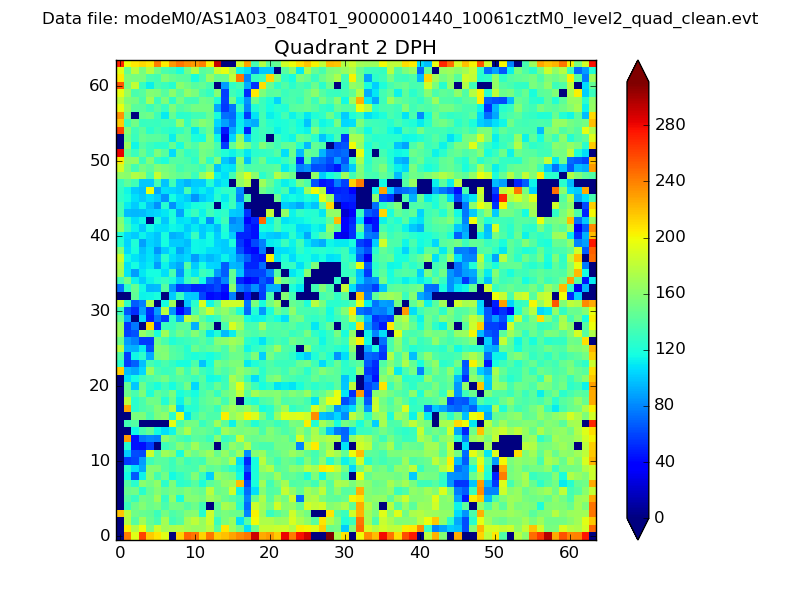 |
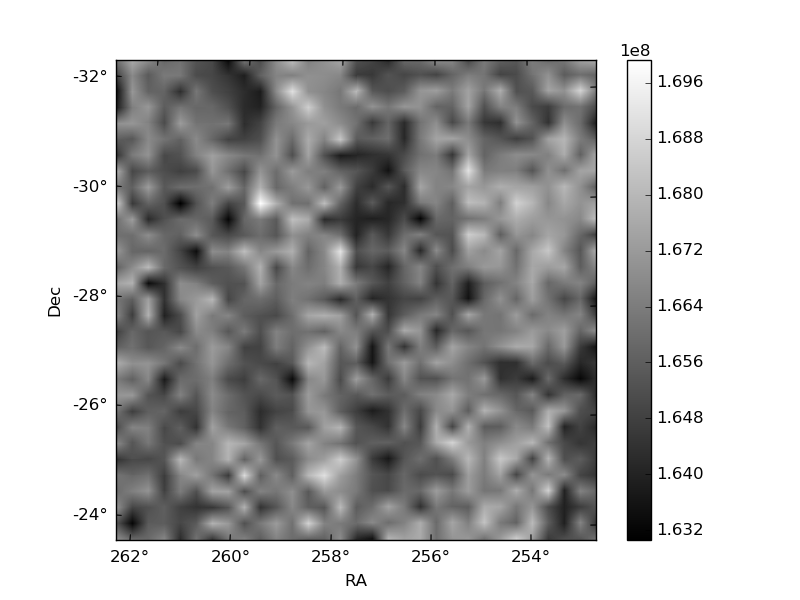
Quadrant C |
| Plot type | Count rate plots | Images |
|---|---|---|
| Comparison with Poisson distribution Blue bars denote a histogram of data divided into 1 sec bins. Red curve is a Poisson curve with rate = median count rate of data. |
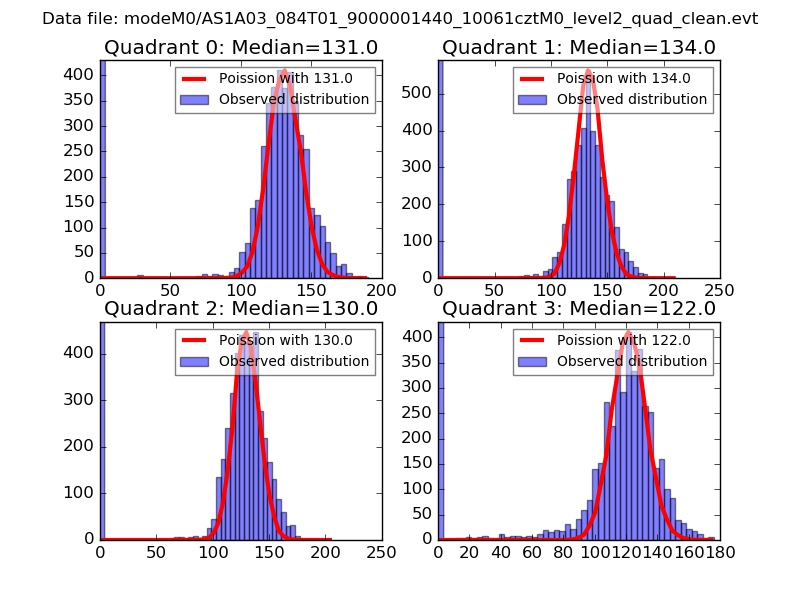 |
 |
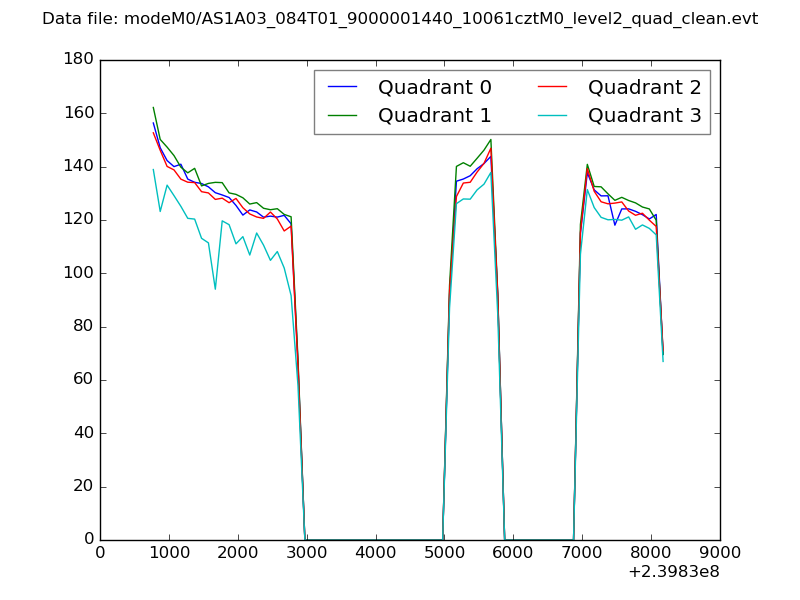
| Quadrant-wise count rates Data is divided into 100 sec bins |
 |
|
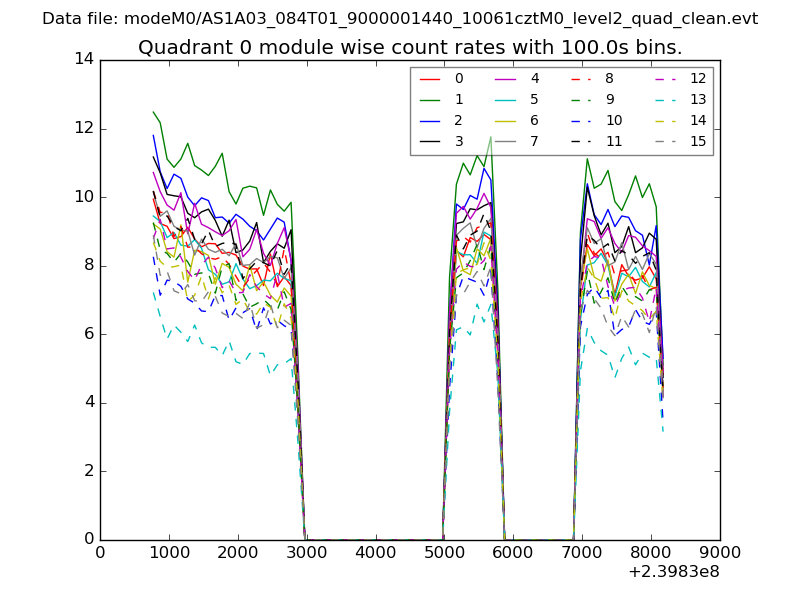
| Module-wise count rates for Quadrant A Data is divided into 100 sec bins |
 |
 |
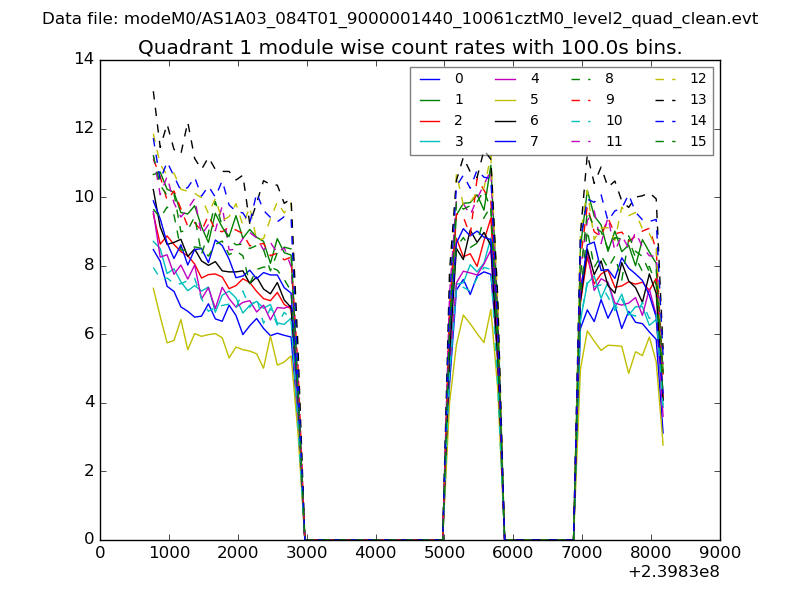
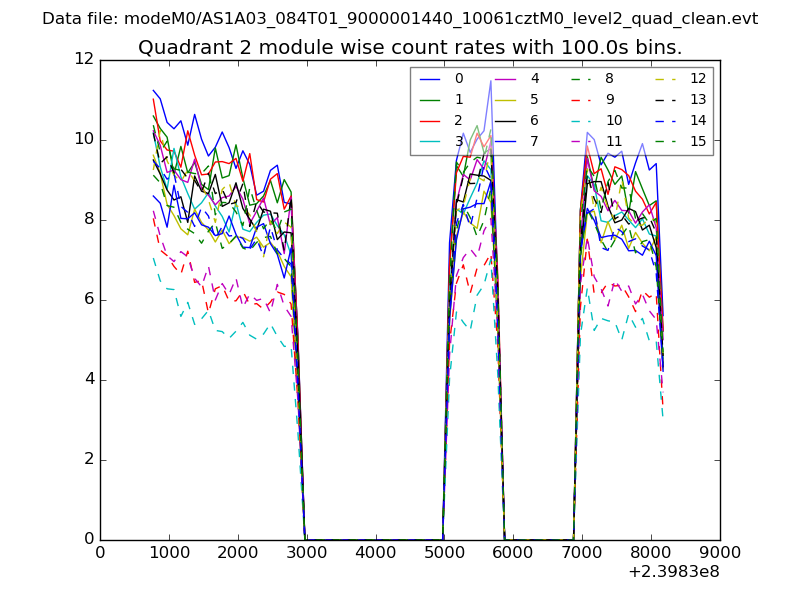
| Module-wise count rates for Quadrant B Data is divided into 100 sec bins |
 |
 |
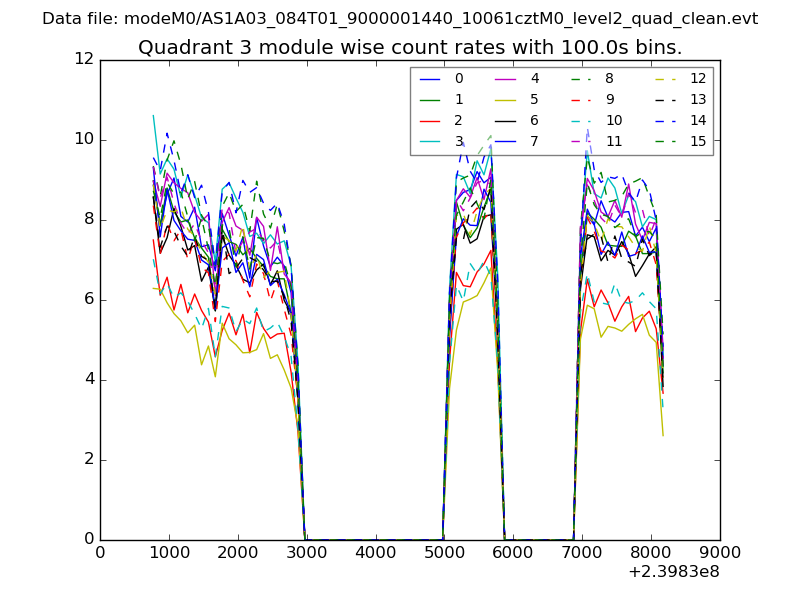
| Module-wise count rates for Quadrant C Data is divided into 100 sec bins |
 |
 |
| Module-wise count rates for Quadrant D Data is divided into 100 sec bins |
 |
 |
| Parameter | Plot |
|---|---|
| CZT HV Monitor | 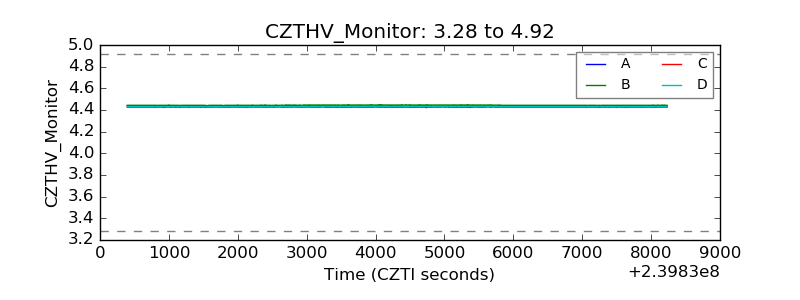 |
| D_VDD | 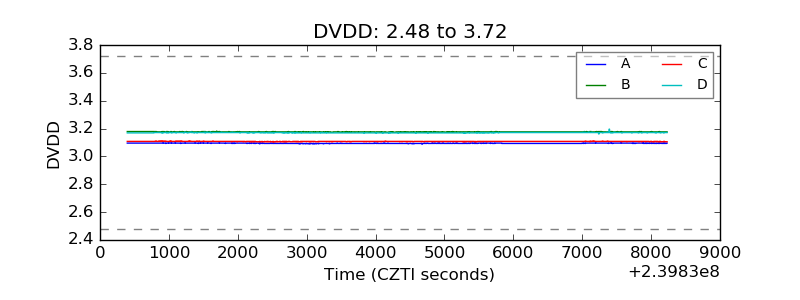 |
| Temperature 1 | 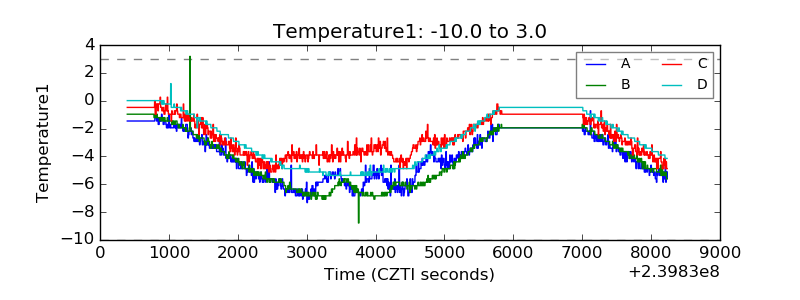 |
| Veto HV Monitor | 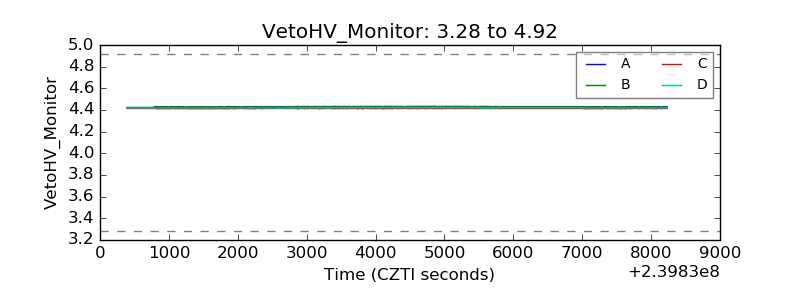 |
| Veto LLD | 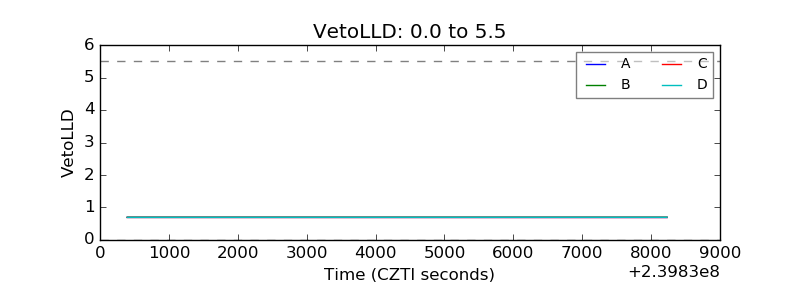 |
| Alpha Counter | 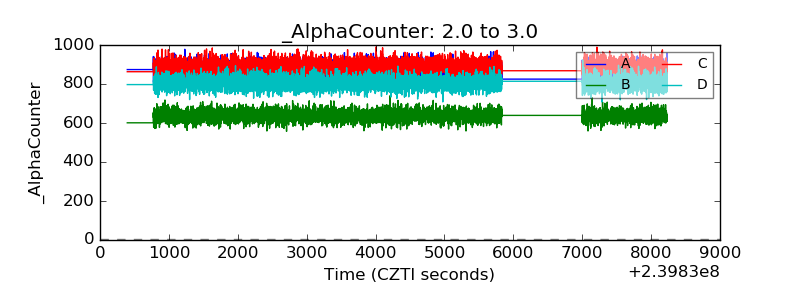 |
| _CPM_Rate | 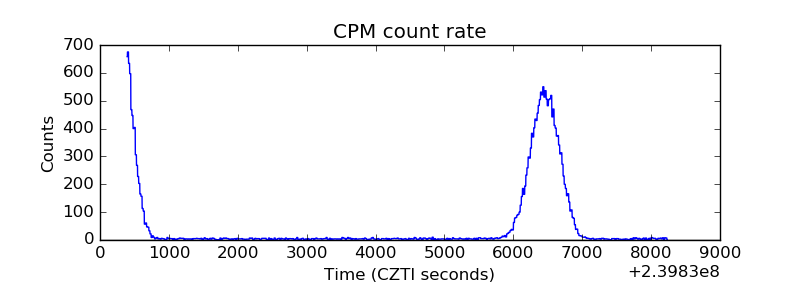 |
| CZT Counter | 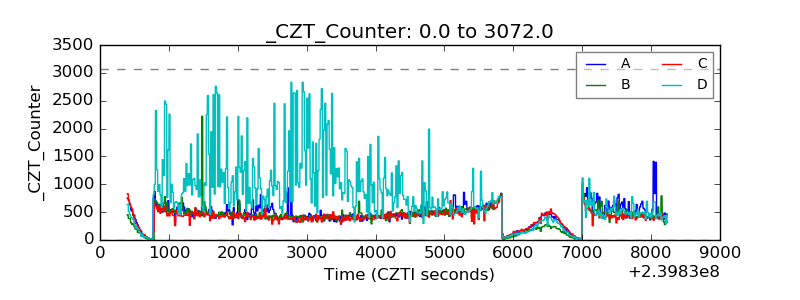 |
| +2.5 Volts monitor |  |
| +5 Volts monitor |  |
| _ROLL_ROT | 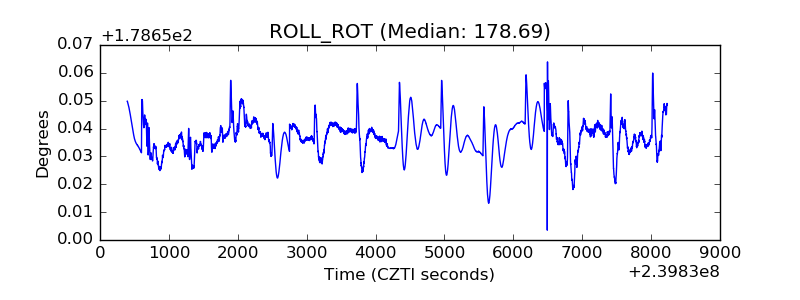 |
| _Roll_DEC | 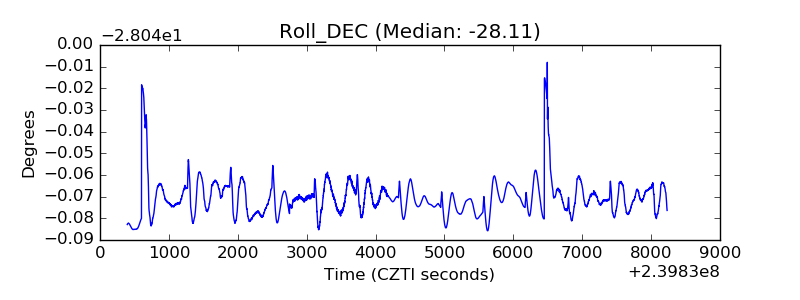 |
| _Roll_RA | 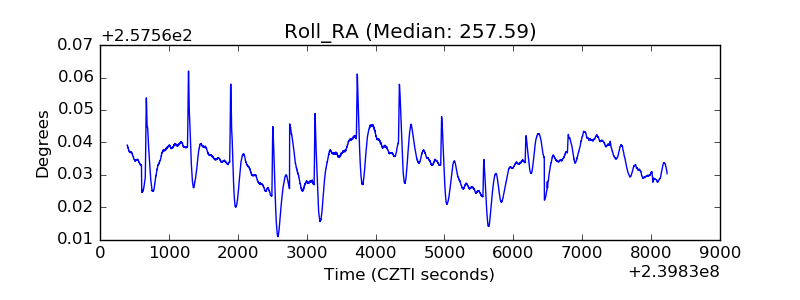 |
| Veto Counter | 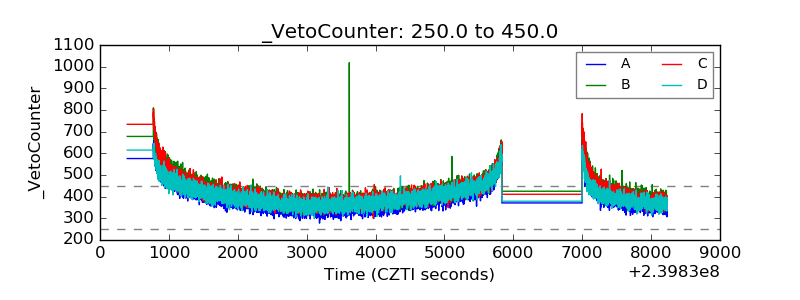 |