| Param | Original file | Final file |
|---|---|---|
| Filename | modeM0/AS1A03_084T01_9000001440_10062cztM0_level2.evt | modeM0/AS1A03_084T01_9000001440_10062cztM0_level2_quad_clean.evt |
| Size (bytes) | 401,679,360 | 76,135,680 |
| Size | 383.1 MB | 72.6 MB |
| Events in quadrant A | 3,145,848 | 476,756 |
| Events in quadrant B | 2,912,200 | 485,870 |
| Events in quadrant C | 2,617,095 | 477,530 |
| Events in quadrant D | 3,089,648 | 454,705 |
| Mode M0 | |||
|---|---|---|---|
| Quadrant | BADHDUFLAG | Total packets | Discarded packets |
| A | 0 | 13585 | 264 |
| B | 0 | 12756 | 233 |
| C | 0 | 12122 | 159 |
| D | 0 | 13396 | 237 |
| Mode SS | |||
|---|---|---|---|
| Quadrant | BADHDUFLAG | Total packets | Discarded packets |
| A | 0 | 120 | 0 |
| B | 0 | 120 | 0 |
| C | 0 | 120 | 0 |
| D | 0 | 120 | 0 |
| Mode M9 | |||
|---|---|---|---|
| Quadrant | BADHDUFLAG | Total packets | Discarded packets |
| A | 0 | 15 | 0 |
| B | 0 | 15 | 0 |
| C | 0 | 15 | 0 |
| D | 0 | 16 | 0 |
| Quadrant | Total seconds | Saturated seconds | Saturation percentage |
|---|---|---|---|
| A | 5867 | 66 | 1.124936% |
| B | 5866 | 29 | 0.494374% |
| C | 5891 | 6 | 0.101850% |
| D | 5872 | 35 | 0.596049% |
Noise dominated data is calculated using 1-second bins in cleaned event files. If a bin has >2000 counts, and if more than 50% of those come from <1% of pixels, then it is considered to be noise-dominated and hence unusable.
| Quadrant | # 1 sec bins | Bins with >0 counts | Bins with >2000 counts | High rate bins dominated by noise | Noise dominated (total time) | Noise dominated (detector-on time) | Marked lightcurve |
|---|---|---|---|---|---|---|---|
| A | 6835 | 5968 | 46 | 46 | 0.67% | 0.77% |  |
| B | 6835 | 5967 | 9 | 9 | 0.13% | 0.15% | 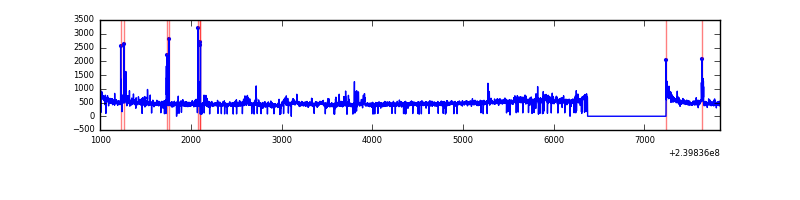 |
| C | 6835 | 5970 | 1 | 1 | 0.01% | 0.02% |  |
| D | 6835 | 5966 | 17 | 17 | 0.25% | 0.28% | 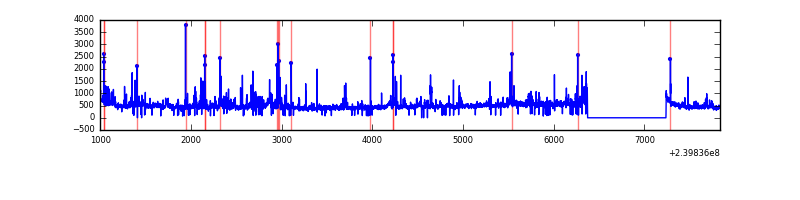 |
Top three noisy pixels from each quadrant. If the there are fewer than three noisy pixels in the level2.evt file, extra rows are filled as -1
| Pixel properties | Quadrant properties | ||||||
|---|---|---|---|---|---|---|---|
| Quadrant | DetID | PixID | Counts | Sigma | Mean | Median | Sigma |
| A | 0 | 8 | 247043 | 1755.33 | 687 | 673 | 140.4 |
| A | 15 | 239 | 151947 | 1077.79 | 687 | 673 | 140.4 |
| A | 13 | 251 | 42403 | 297.32 | 687 | 673 | 140.4 |
| B | 4 | 239 | 66095 | 491.99 | 693 | 676 | 133.0 |
| B | 0 | 214 | 50047 | 371.3 | 693 | 676 | 133.0 |
| B | 12 | 0 | 32448 | 238.95 | 693 | 676 | 133.0 |
| C | 14 | 67 | 6286 | 35.82 | 667 | 670 | 156.8 |
| C | 14 | 234 | 6269 | 35.71 | 667 | 670 | 156.8 |
| C | 13 | 61 | 5175 | 28.74 | 667 | 670 | 156.8 |
| D | 4 | 95 | 147169 | 816.04 | 656 | 640 | 179.6 |
| D | 1 | 52 | 113466 | 628.34 | 656 | 640 | 179.6 |
| D | 8 | 195 | 77932 | 430.45 | 656 | 640 | 179.6 |
Histogram calculated using DETX and DETY for each event in the final _common_clean file
| Quadrant A | 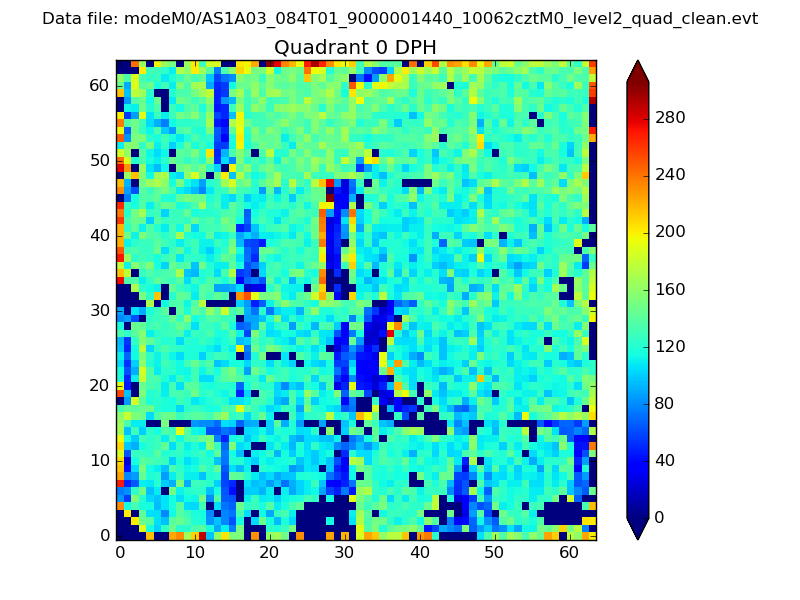 |
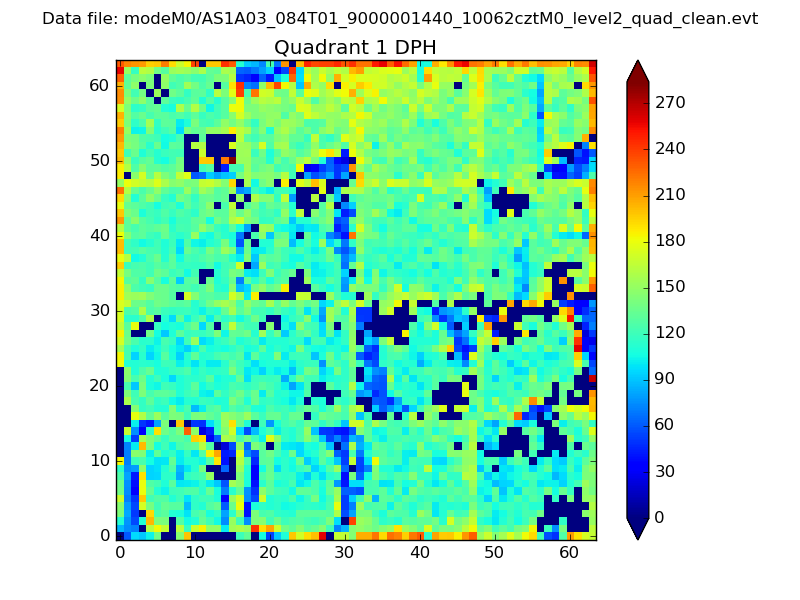 |
Quadrant B |
|---|---|---|---|
| Quadrant D |  |
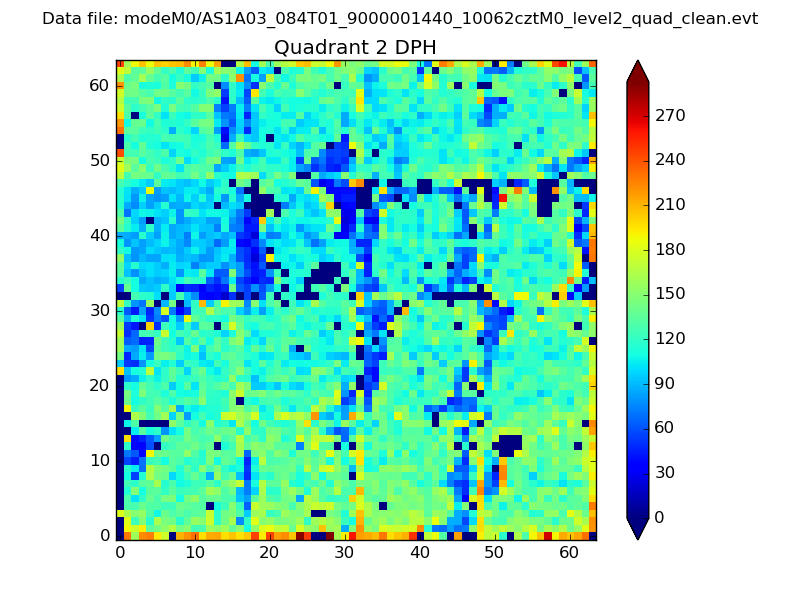 |
Quadrant C |
| Plot type | Count rate plots | Images |
|---|---|---|
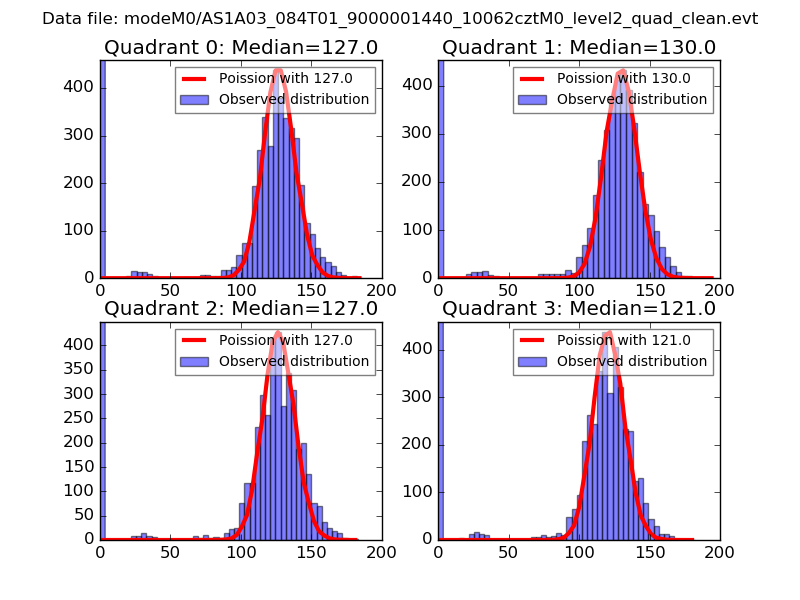
| Comparison with Poisson distribution Blue bars denote a histogram of data divided into 1 sec bins. Red curve is a Poisson curve with rate = median count rate of data. |
 |
 |
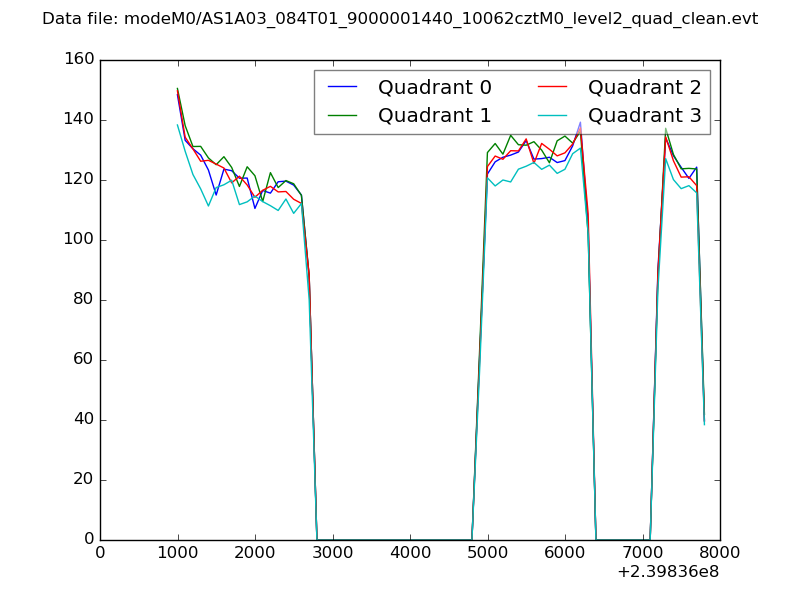
| Quadrant-wise count rates Data is divided into 100 sec bins |
 |
|
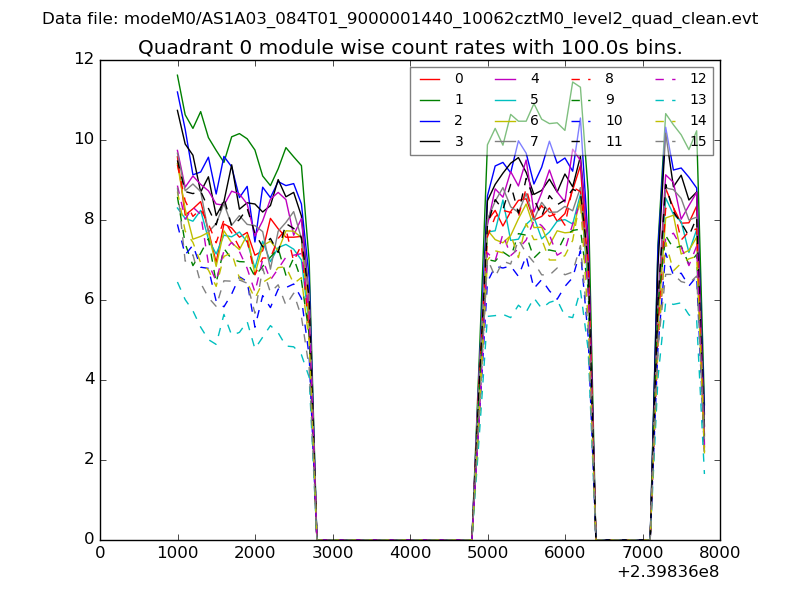
| Module-wise count rates for Quadrant A Data is divided into 100 sec bins |
 |
 |
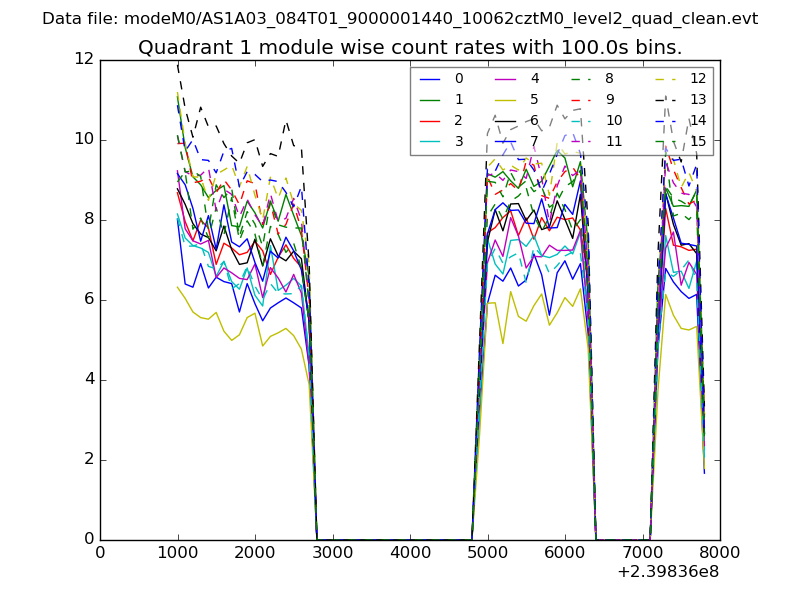
| Module-wise count rates for Quadrant B Data is divided into 100 sec bins |
 |
 |
| Module-wise count rates for Quadrant C Data is divided into 100 sec bins |
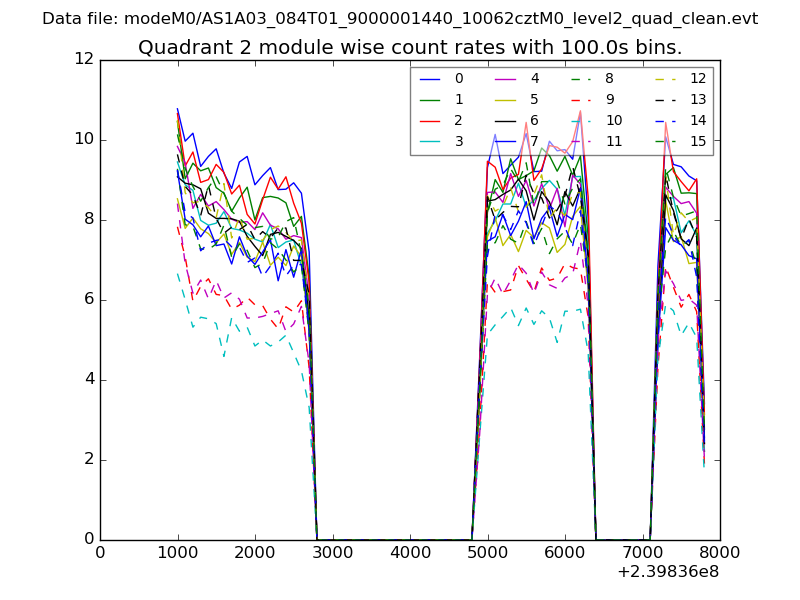 |
 |
| Module-wise count rates for Quadrant D Data is divided into 100 sec bins |
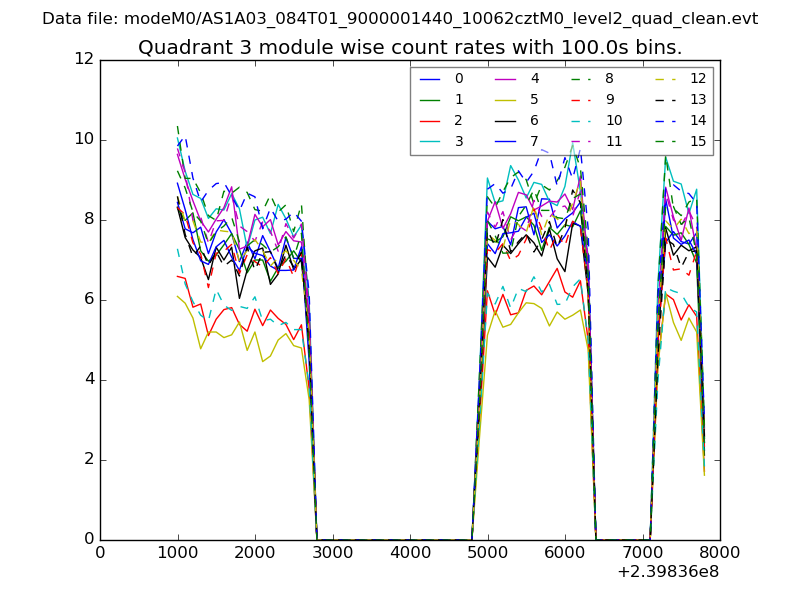 |
 |
| Parameter | Plot |
|---|---|
| CZT HV Monitor | 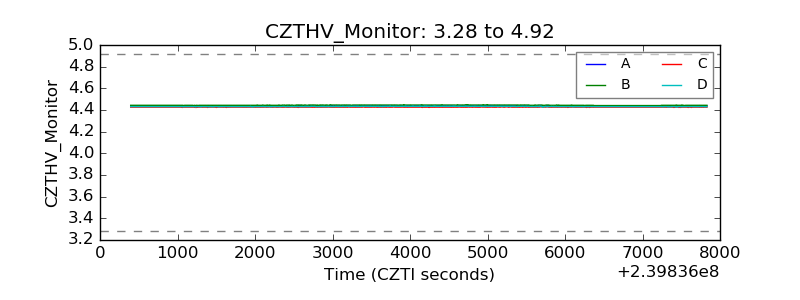 |
| D_VDD | 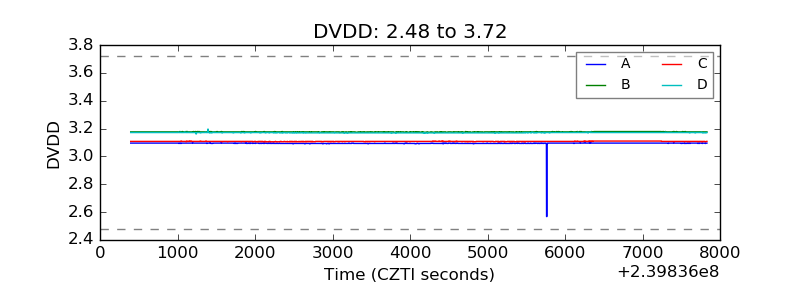 |
| Temperature 1 | 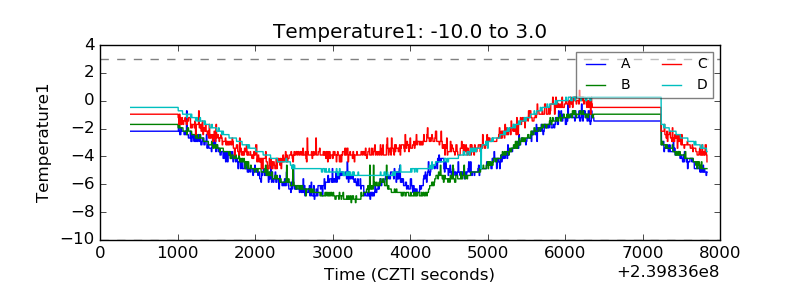 |
| Veto HV Monitor | 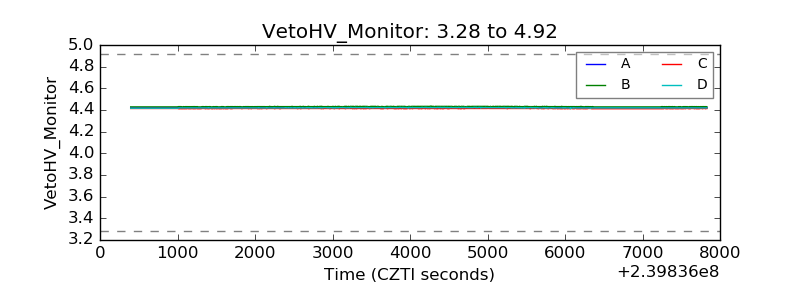 |
| Veto LLD | 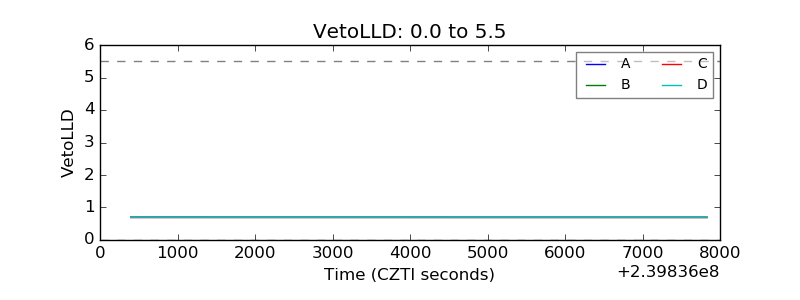 |
| Alpha Counter | 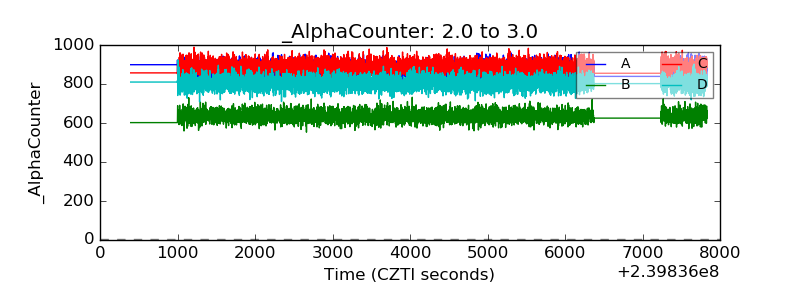 |
| _CPM_Rate | 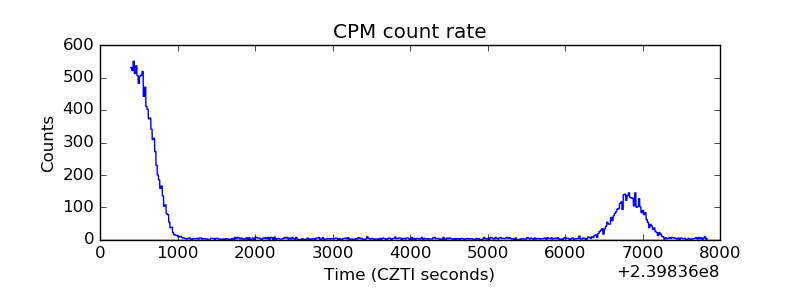 |
| CZT Counter | 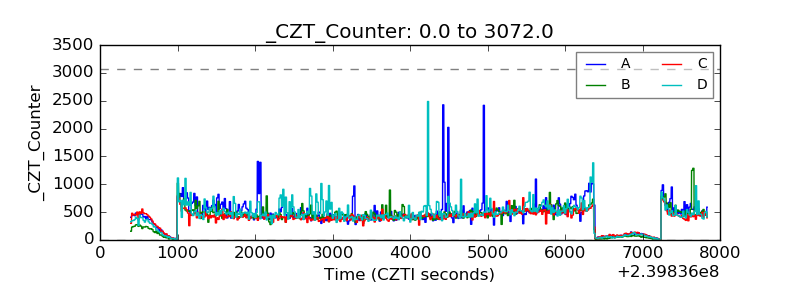 |
| +2.5 Volts monitor |  |
| +5 Volts monitor |  |
| _ROLL_ROT | 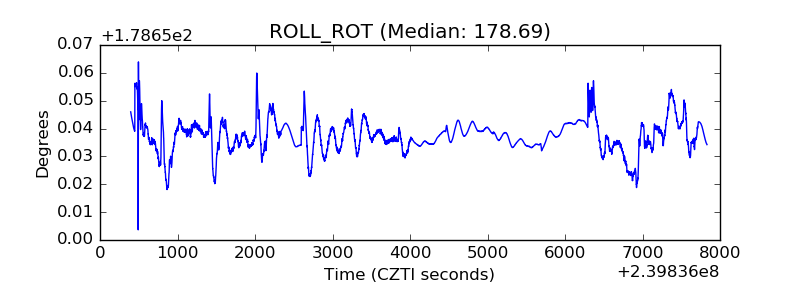 |
| _Roll_DEC | 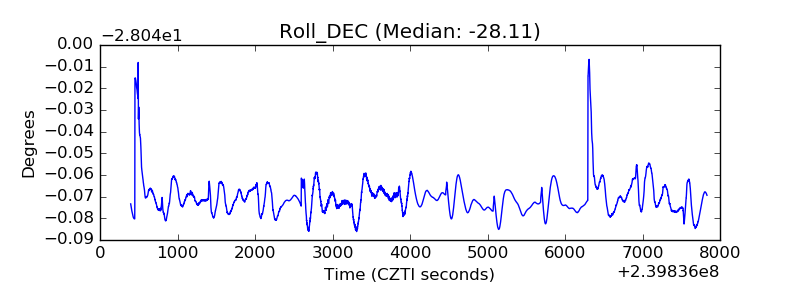 |
| _Roll_RA | 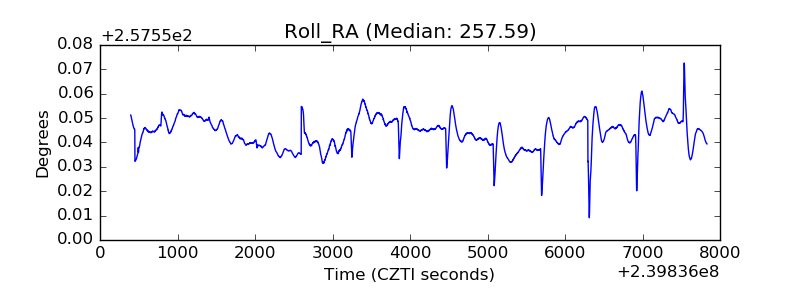 |
| Veto Counter | 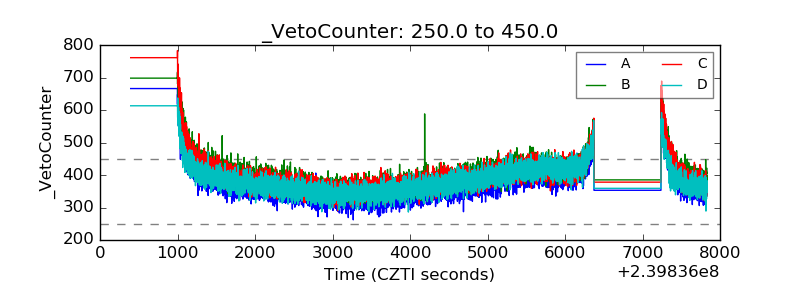 |