| Param | Original file | Final file |
|---|---|---|
| Filename | modeM0/AS1A03_084T01_9000001440_10069cztM0_level2.evt | modeM0/AS1A03_084T01_9000001440_10069cztM0_level2_quad_clean.evt |
| Size (bytes) | 42,681,600 | 11,568,960 |
| Size | 40.7 MB | 11.0 MB |
| Events in quadrant A | 338,134 | 76,392 |
| Events in quadrant B | 328,991 | 76,751 |
| Events in quadrant C | 279,879 | 75,374 |
| Events in quadrant D | 301,678 | 71,878 |
| Mode M0 | |||
|---|---|---|---|
| Quadrant | BADHDUFLAG | Total packets | Discarded packets |
| A | 0 | 1394 | 1 |
| B | 0 | 1353 | 1 |
| C | 0 | 1249 | 1 |
| D | 0 | 1302 | 1 |
| Mode SS | |||
|---|---|---|---|
| Quadrant | BADHDUFLAG | Total packets | Discarded packets |
| A | 0 | 12 | 0 |
| B | 0 | 12 | 0 |
| C | 0 | 12 | 0 |
| D | 0 | 12 | 0 |
| Mode M9 | |||
|---|---|---|---|
| Quadrant | BADHDUFLAG | Total packets | Discarded packets |
| A | 0 | 1 | 0 |
| B | 0 | 1 | 0 |
| C | 0 | 1 | 0 |
| D | 0 | 2 | 0 |
| Quadrant | Total seconds | Saturated seconds | Saturation percentage |
|---|---|---|---|
| A | 595 | 3 | 0.504202% |
| B | 595 | 12 | 2.016807% |
| C | 595 | 2 | 0.336134% |
| D | 595 | 2 | 0.336134% |
Noise dominated data is calculated using 1-second bins in cleaned event files. If a bin has >2000 counts, and if more than 50% of those come from <1% of pixels, then it is considered to be noise-dominated and hence unusable.
| Quadrant | # 1 sec bins | Bins with >0 counts | Bins with >2000 counts | High rate bins dominated by noise | Noise dominated (total time) | Noise dominated (detector-on time) | Marked lightcurve |
|---|---|---|---|---|---|---|---|
| A | 595 | 595 | 1 | 1 | 0.17% | 0.17% | 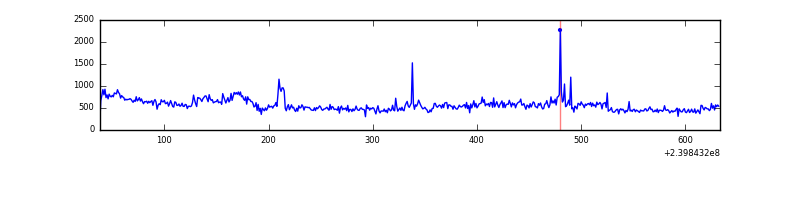 |
| B | 595 | 595 | 2 | 2 | 0.34% | 0.34% | 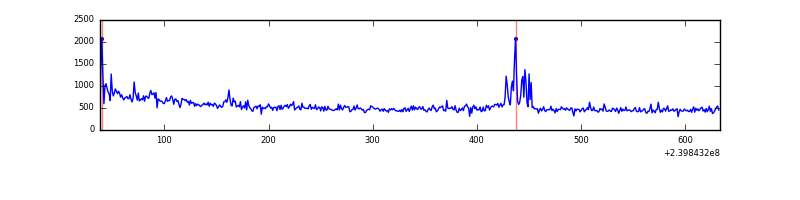 |
| C | 595 | 595 | 0 | 0 | 0.00% | 0.00% | 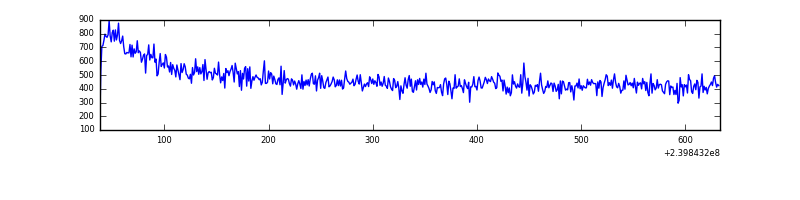 |
| D | 595 | 595 | 1 | 1 | 0.17% | 0.17% | 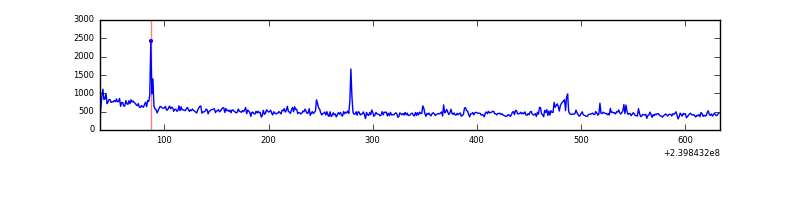 |
Top three noisy pixels from each quadrant. If the there are fewer than three noisy pixels in the level2.evt file, extra rows are filled as -1
| Pixel properties | Quadrant properties | ||||||
|---|---|---|---|---|---|---|---|
| Quadrant | DetID | PixID | Counts | Sigma | Mean | Median | Sigma |
| A | 0 | 8 | 33885 | 1914.95 | 75 | 73 | 17.7 |
| A | 13 | 251 | 6296 | 352.44 | 75 | 73 | 17.7 |
| A | 8 | 5 | 6034 | 337.6 | 75 | 73 | 17.7 |
| B | 4 | 239 | 22735 | 1318.43 | 75 | 74 | 17.2 |
| B | 0 | 229 | 6682 | 384.46 | 75 | 74 | 17.2 |
| B | 0 | 214 | 2747 | 155.52 | 75 | 74 | 17.2 |
| C | 14 | 67 | 895 | 44.66 | 71 | 71 | 18.5 |
| C | 12 | 4 | 644 | 31.05 | 71 | 71 | 18.5 |
| C | 13 | 61 | 529 | 24.82 | 71 | 71 | 18.5 |
| D | 13 | 122 | 13127 | 656.07 | 71 | 68 | 19.9 |
| D | 2 | 152 | 10498 | 523.99 | 71 | 68 | 19.9 |
| D | 2 | 234 | 2148 | 104.5 | 71 | 68 | 19.9 |
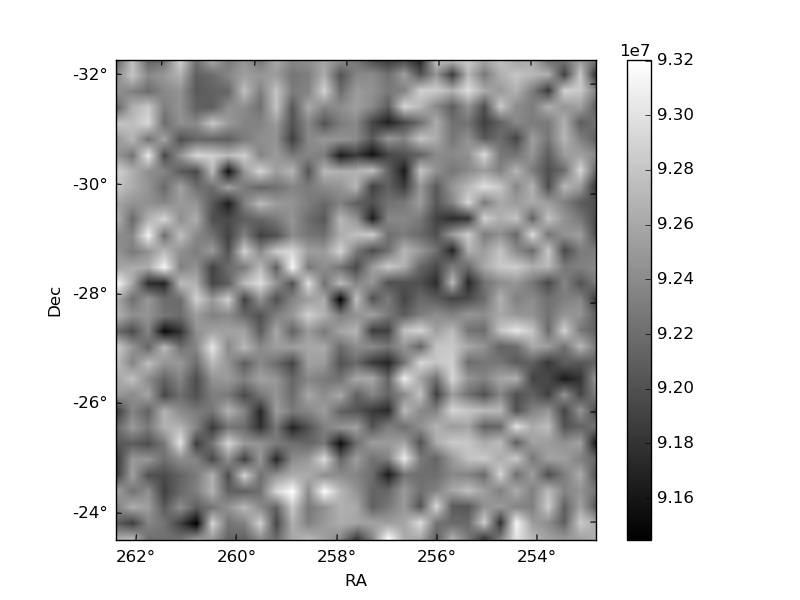
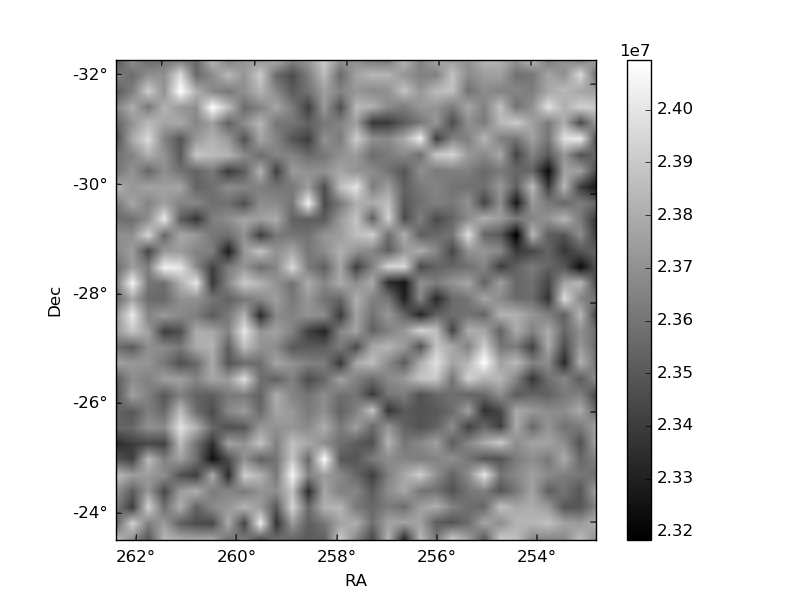
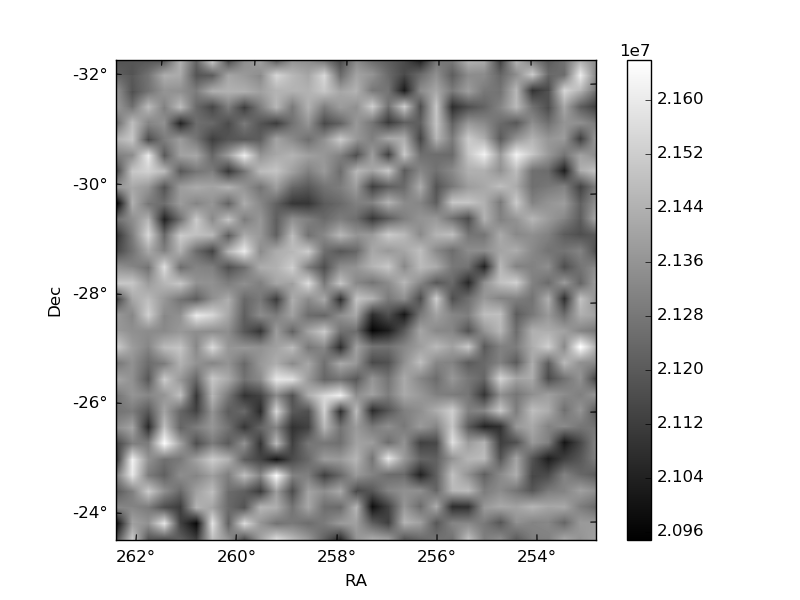
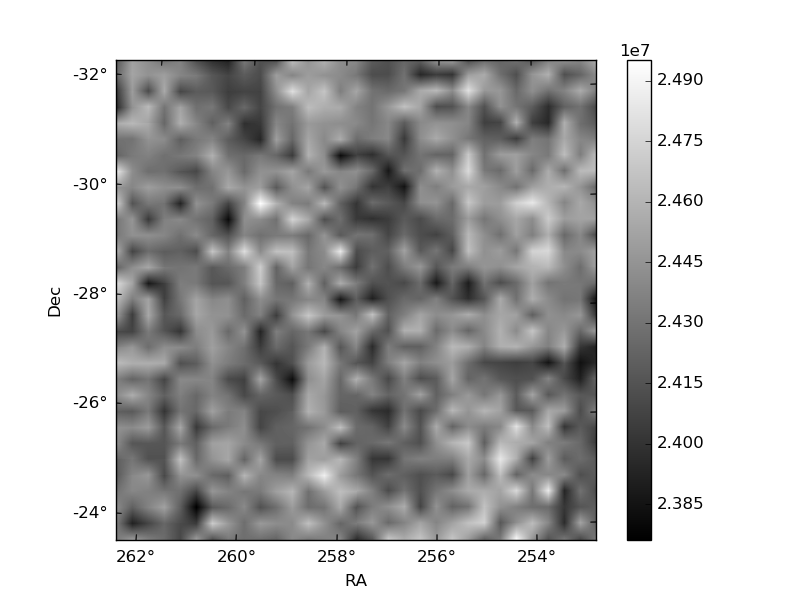
Histogram calculated using DETX and DETY for each event in the final _common_clean file
| Quadrant A | 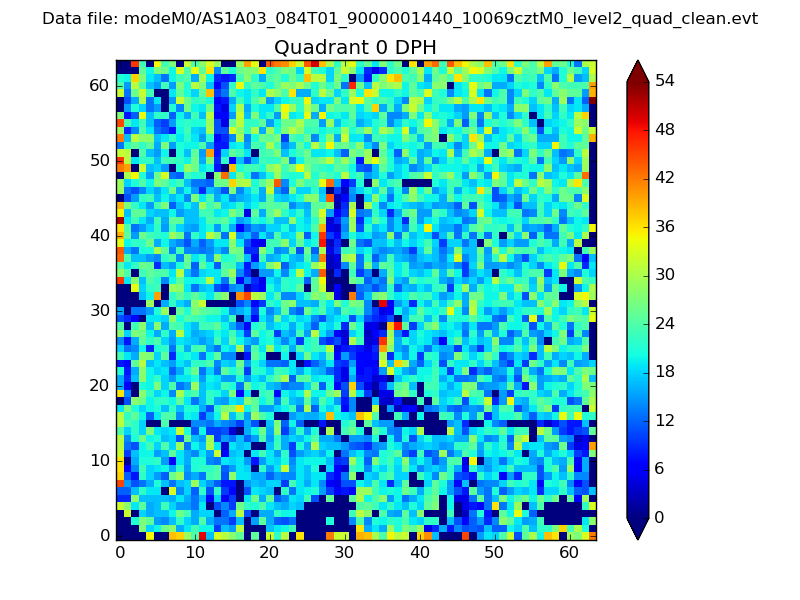 |
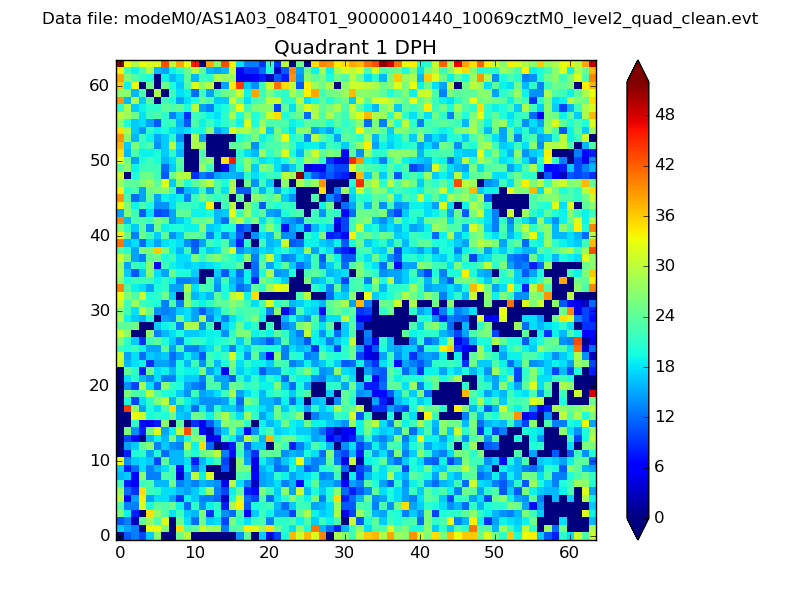 |
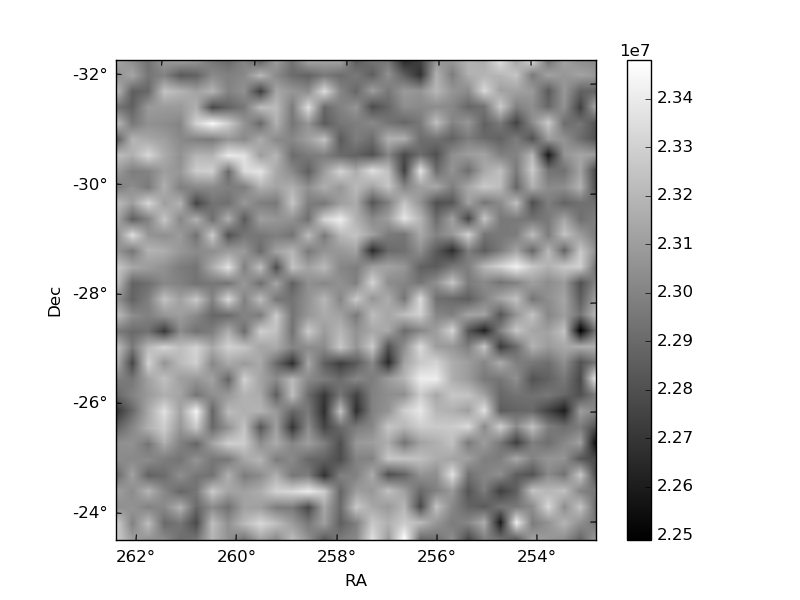
Quadrant B |
|---|---|---|---|
| Quadrant D | 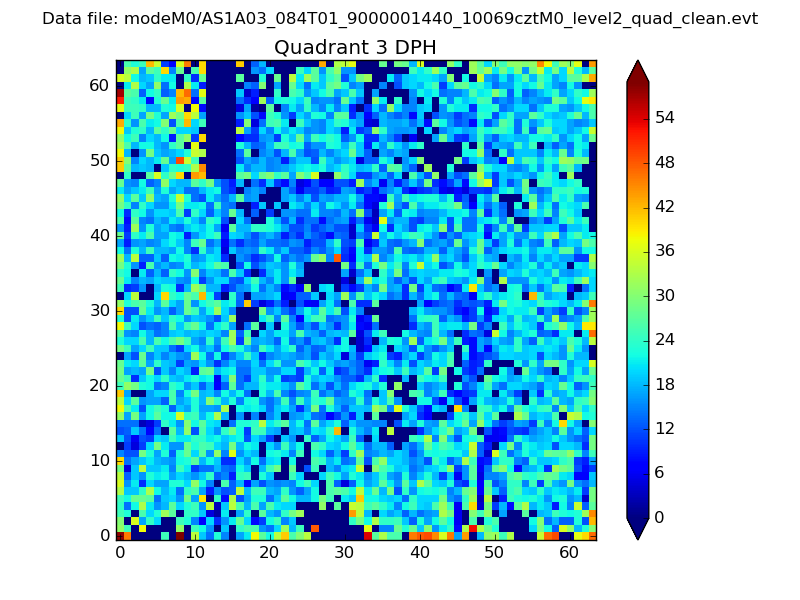 |
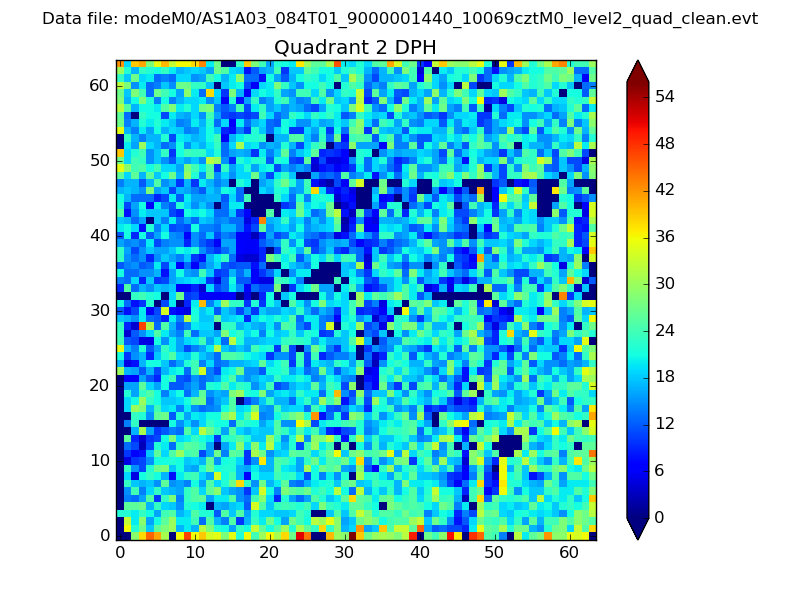 |
Quadrant C |
| Plot type | Count rate plots | Images |
|---|---|---|
| Comparison with Poisson distribution Blue bars denote a histogram of data divided into 1 sec bins. Red curve is a Poisson curve with rate = median count rate of data. |
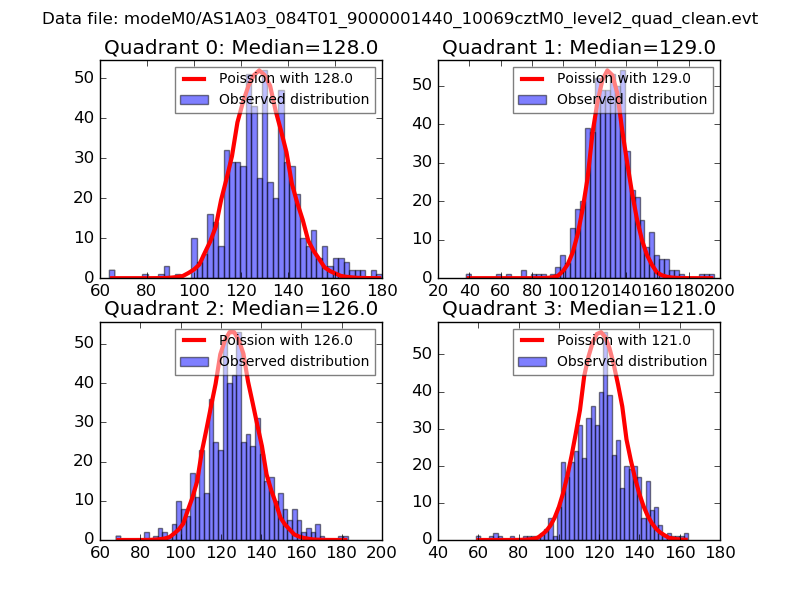 |
 |
| Quadrant-wise count rates Data is divided into 100 sec bins |
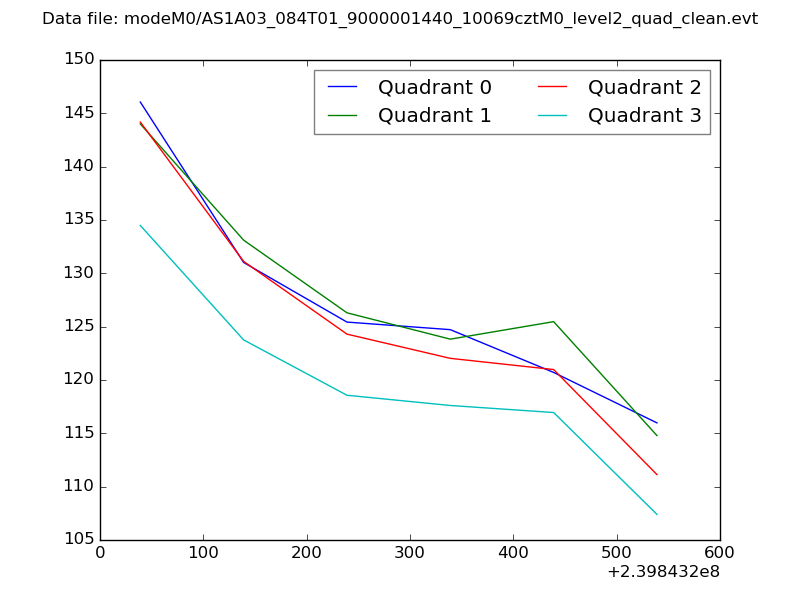 |
|
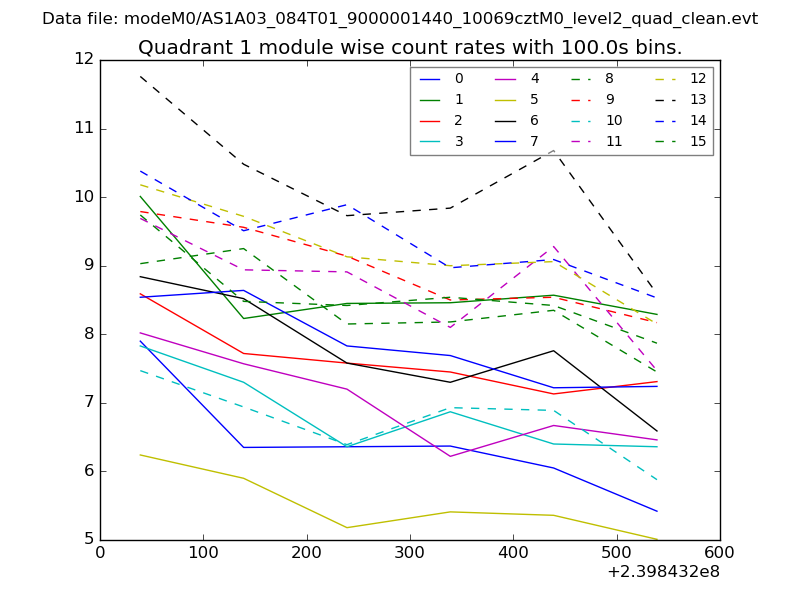
| Module-wise count rates for Quadrant A Data is divided into 100 sec bins |
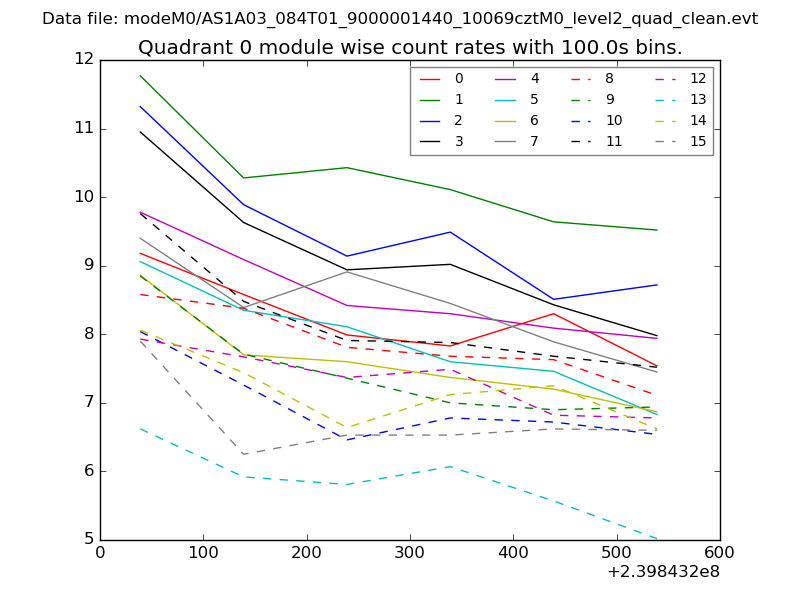 |
 |
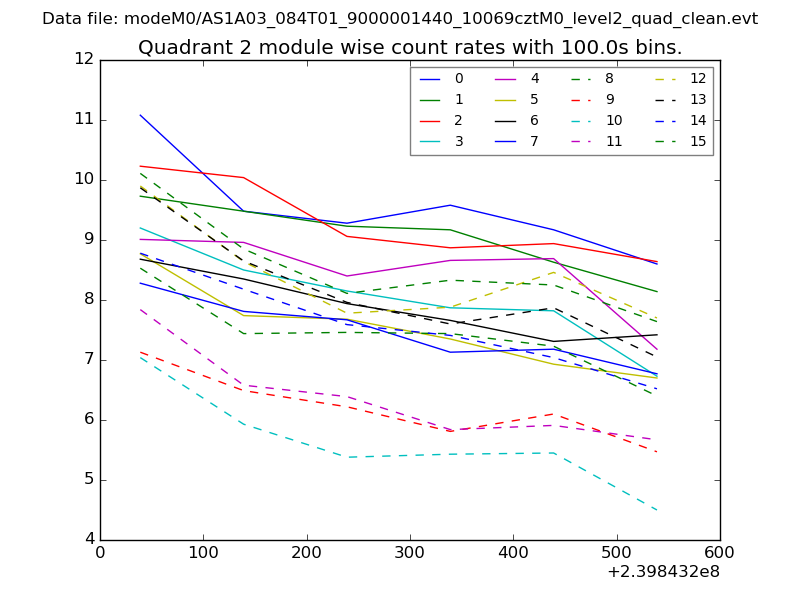
| Module-wise count rates for Quadrant B Data is divided into 100 sec bins |
 |
 |
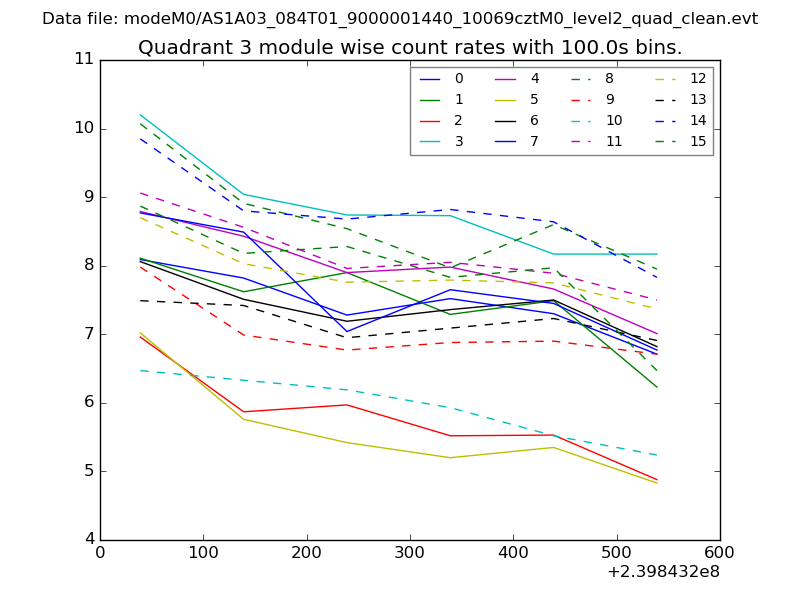
| Module-wise count rates for Quadrant C Data is divided into 100 sec bins |
 |
 |
| Module-wise count rates for Quadrant D Data is divided into 100 sec bins |
 |
 |
| Parameter | Plot |
|---|---|
| CZT HV Monitor | 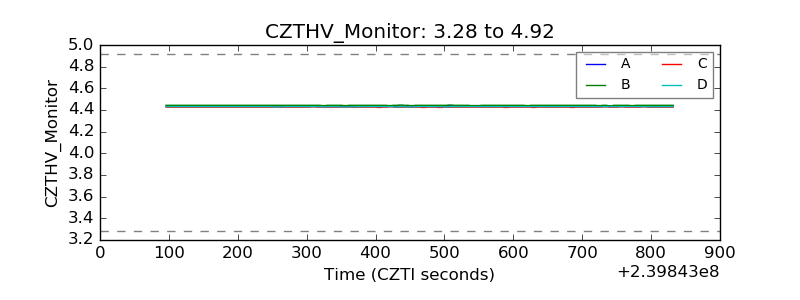 |
| D_VDD | 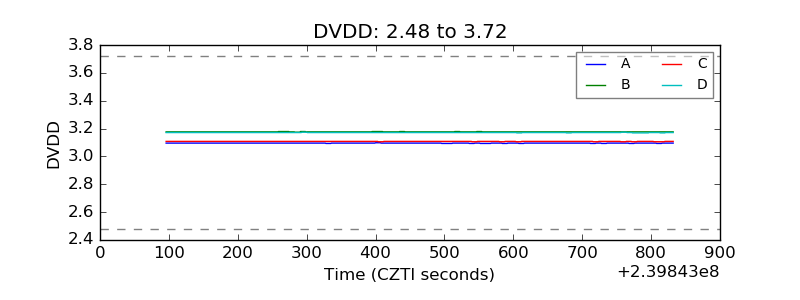 |
| Temperature 1 | 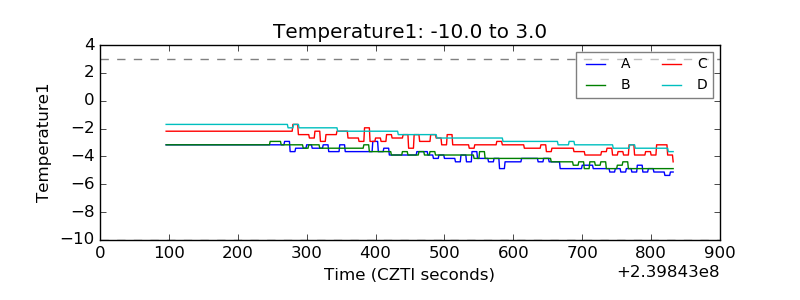 |
| Veto HV Monitor | 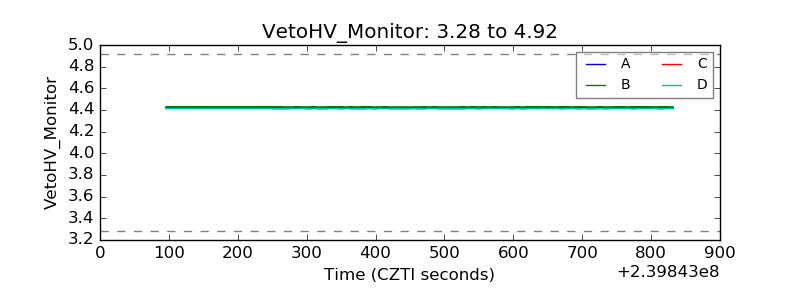 |
| Veto LLD | 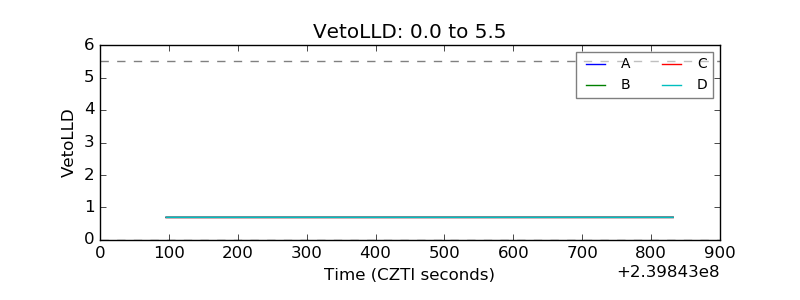 |
| Alpha Counter | 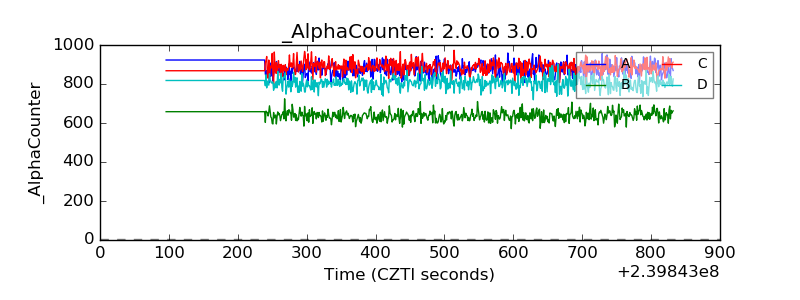 |
| _CPM_Rate | 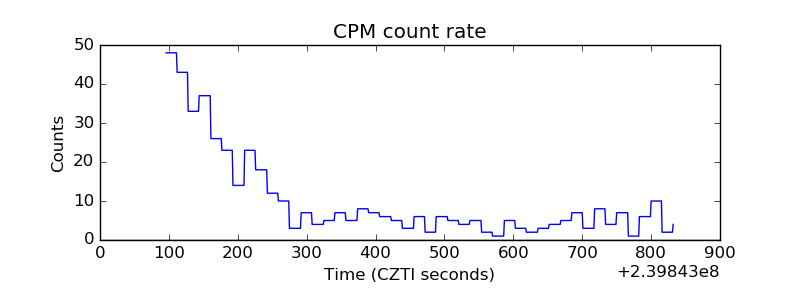 |
| CZT Counter | 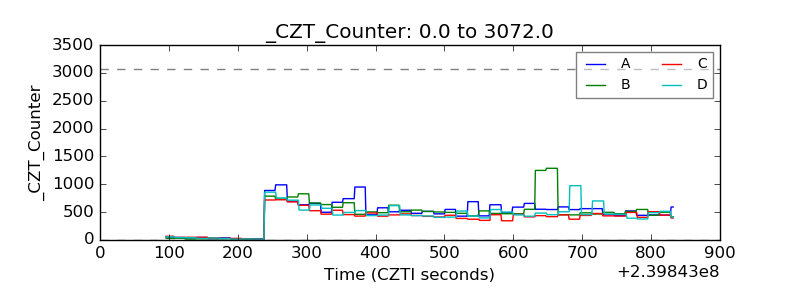 |
| +2.5 Volts monitor |  |
| +5 Volts monitor |  |
| _ROLL_ROT | 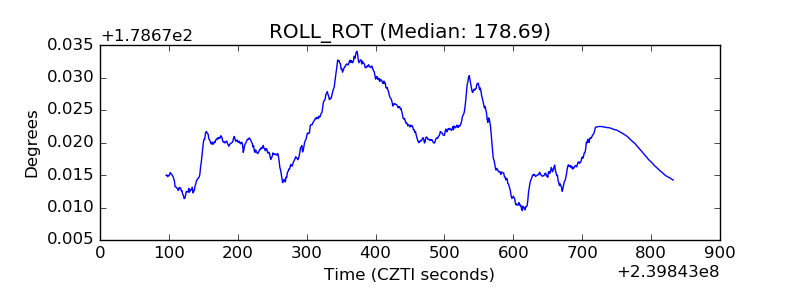 |
| _Roll_DEC | 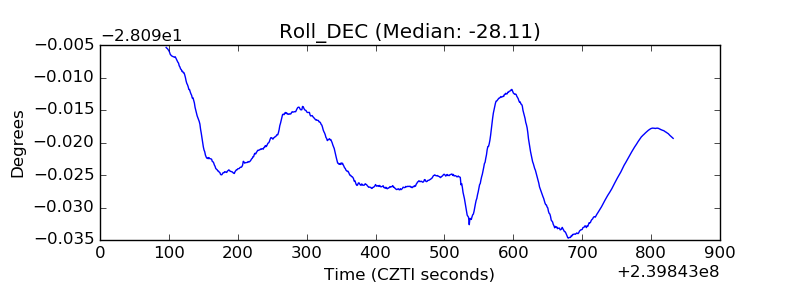 |
| _Roll_RA | 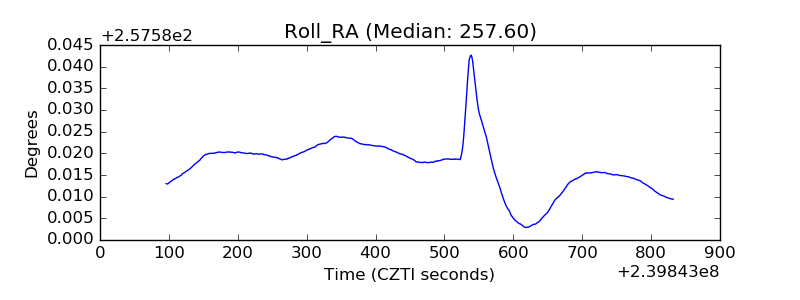 |
| Veto Counter | 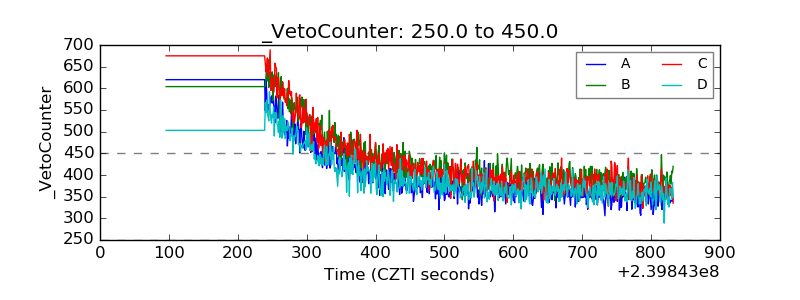 |