| Param | Original file | Final file |
|---|---|---|
| Filename | modeM0/AS1A03_044T03_9000001446_10075cztM0_level2.evt | modeM0/AS1A03_044T03_9000001446_10075cztM0_level2_quad_clean.evt |
| Size (bytes) | 299,292,480 | 59,284,800 |
| Size | 285.4 MB | 56.5 MB |
| Events in quadrant A | 1,913,013 | 385,542 |
| Events in quadrant B | 2,005,348 | 390,866 |
| Events in quadrant C | 1,826,774 | 381,692 |
| Events in quadrant D | 3,050,351 | 359,094 |
| Mode M0 | |||
|---|---|---|---|
| Quadrant | BADHDUFLAG | Total packets | Discarded packets |
| A | 0 | 8333 | 8 |
| B | 0 | 8596 | 3 |
| C | 0 | 8202 | 5 |
| D | 0 | 11761 | 13 |
| Mode SS | |||
|---|---|---|---|
| Quadrant | BADHDUFLAG | Total packets | Discarded packets |
| A | 0 | 78 | 0 |
| B | 0 | 78 | 0 |
| C | 0 | 78 | 0 |
| D | 0 | 78 | 0 |
| Mode M9 | |||
|---|---|---|---|
| Quadrant | BADHDUFLAG | Total packets | Discarded packets |
| A | 0 | 13 | 0 |
| B | 0 | 13 | 0 |
| C | 0 | 13 | 0 |
| D | 0 | 13 | 0 |
| Quadrant | Total seconds | Saturated seconds | Saturation percentage |
|---|---|---|---|
| A | 3946 | 61 | 1.545869% |
| B | 3948 | 64 | 1.621074% |
| C | 3947 | 44 | 1.114771% |
| D | 3944 | 163 | 4.132860% |
Noise dominated data is calculated using 1-second bins in cleaned event files. If a bin has >2000 counts, and if more than 50% of those come from <1% of pixels, then it is considered to be noise-dominated and hence unusable.
| Quadrant | # 1 sec bins | Bins with >0 counts | Bins with >2000 counts | High rate bins dominated by noise | Noise dominated (total time) | Noise dominated (detector-on time) | Marked lightcurve |
|---|---|---|---|---|---|---|---|
| A | 5184 | 3949 | 0 | 0 | 0.00% | 0.00% | 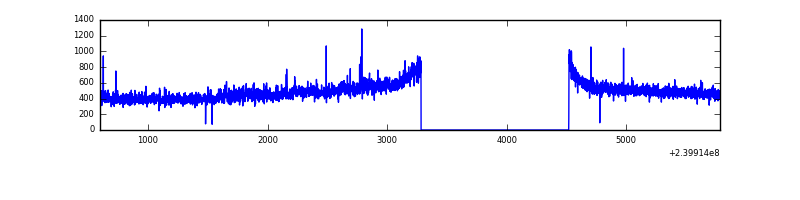 |
| B | 5184 | 3950 | 8 | 8 | 0.15% | 0.20% | 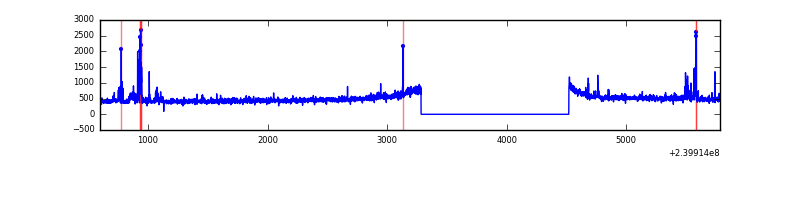 |
| C | 5184 | 3950 | 0 | 0 | 0.00% | 0.00% | 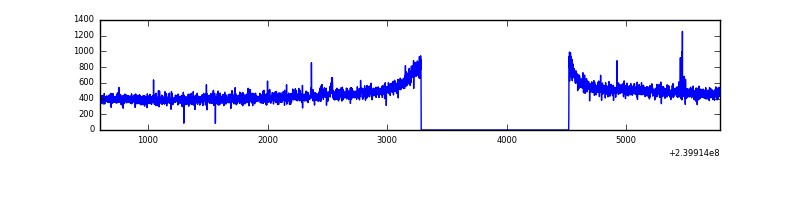 |
| D | 5184 | 3950 | 78 | 78 | 1.50% | 1.97% | 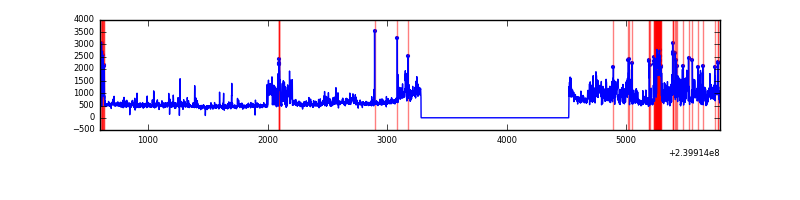 |
Top three noisy pixels from each quadrant. If the there are fewer than three noisy pixels in the level2.evt file, extra rows are filled as -1
| Pixel properties | Quadrant properties | ||||||
|---|---|---|---|---|---|---|---|
| Quadrant | DetID | PixID | Counts | Sigma | Mean | Median | Sigma |
| A | 8 | 15 | 53239 | 539.17 | 477 | 467 | 97.9 |
| A | 8 | 5 | 12522 | 123.17 | 477 | 467 | 97.9 |
| A | 0 | 8 | 8956 | 86.73 | 477 | 467 | 97.9 |
| B | 4 | 81 | 64736 | 692.52 | 480 | 469 | 92.8 |
| B | 4 | 239 | 28675 | 303.94 | 480 | 469 | 92.8 |
| B | 0 | 214 | 17824 | 187.01 | 480 | 469 | 92.8 |
| C | 14 | 234 | 5684 | 48.11 | 464 | 464 | 108.5 |
| C | 14 | 67 | 5325 | 44.8 | 464 | 464 | 108.5 |
| C | 4 | 239 | 5269 | 44.28 | 464 | 464 | 108.5 |
| D | 2 | 16 | 595788 | 5316.19 | 457 | 443 | 112.0 |
| D | 8 | 195 | 316878 | 2825.63 | 457 | 443 | 112.0 |
| D | 13 | 137 | 105690 | 939.81 | 457 | 443 | 112.0 |
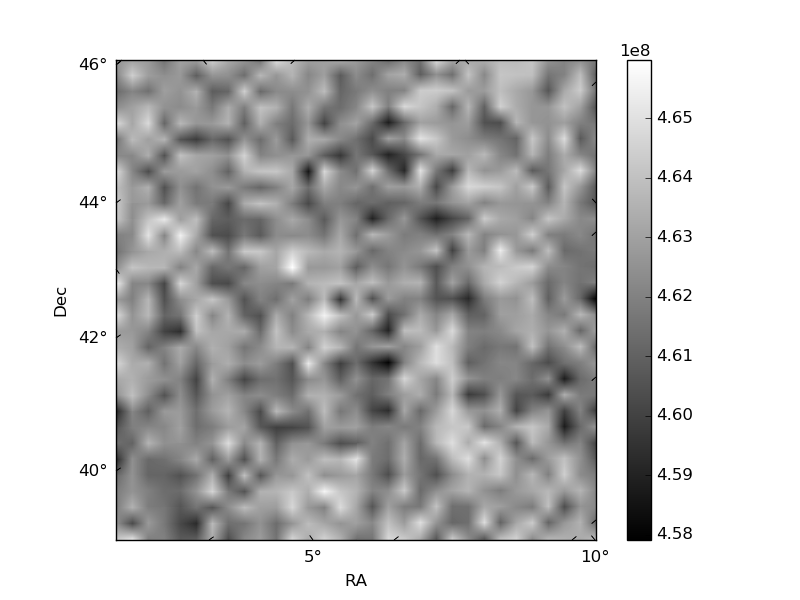
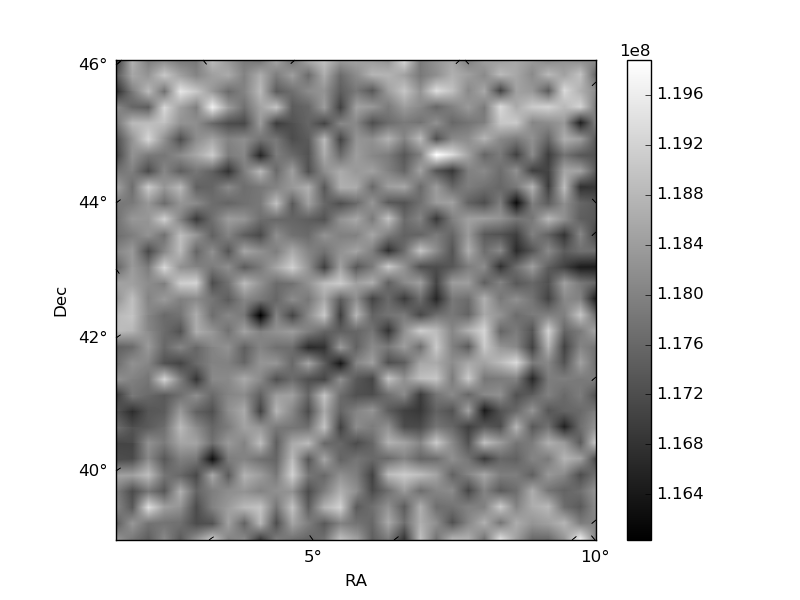
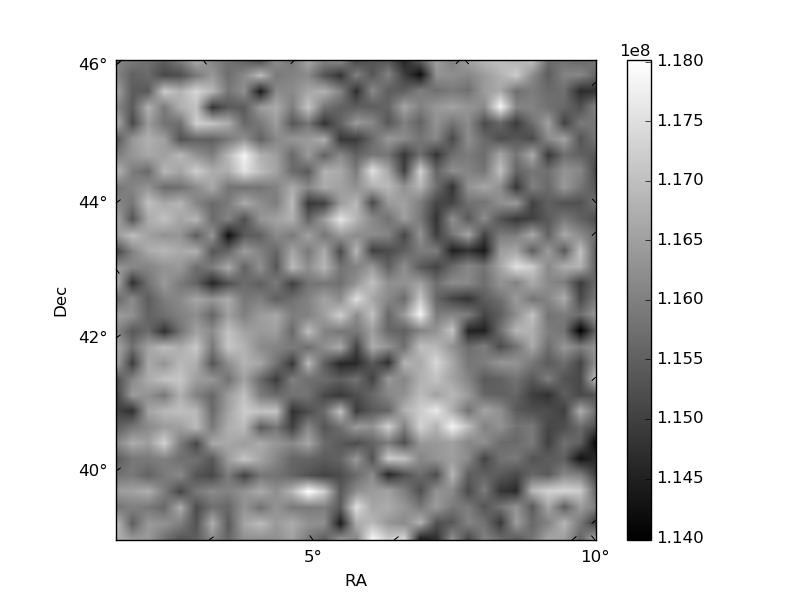
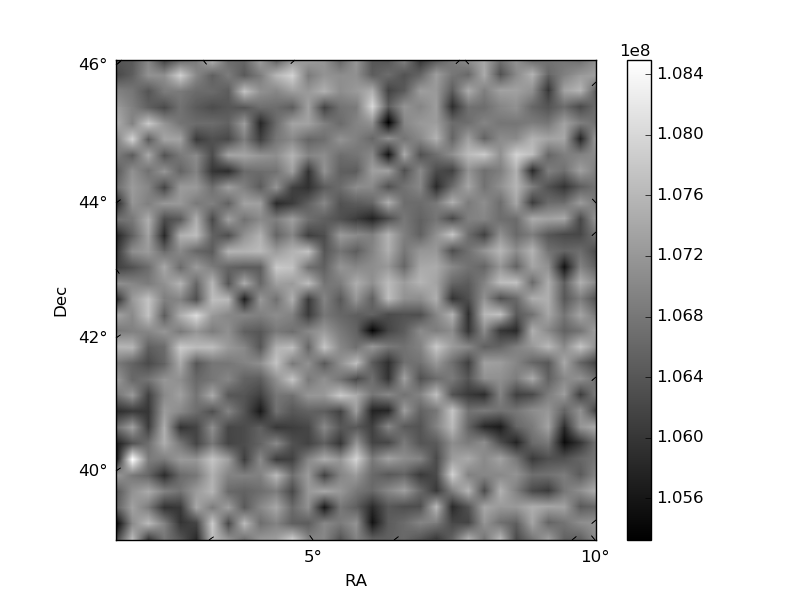
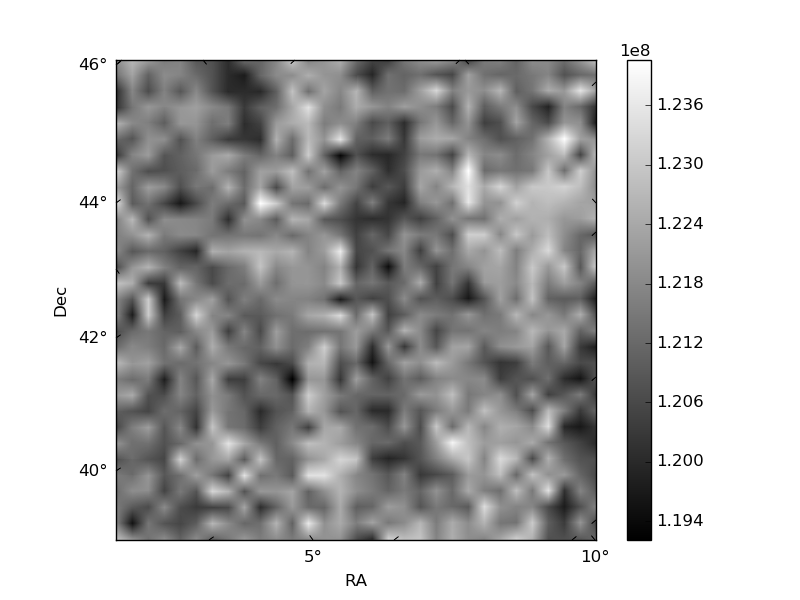
Histogram calculated using DETX and DETY for each event in the final _common_clean file
| Quadrant A | 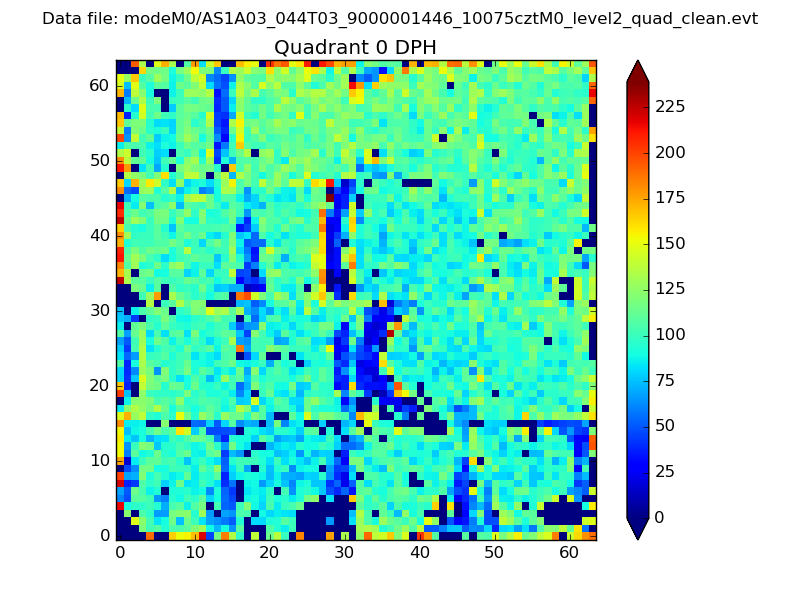 |
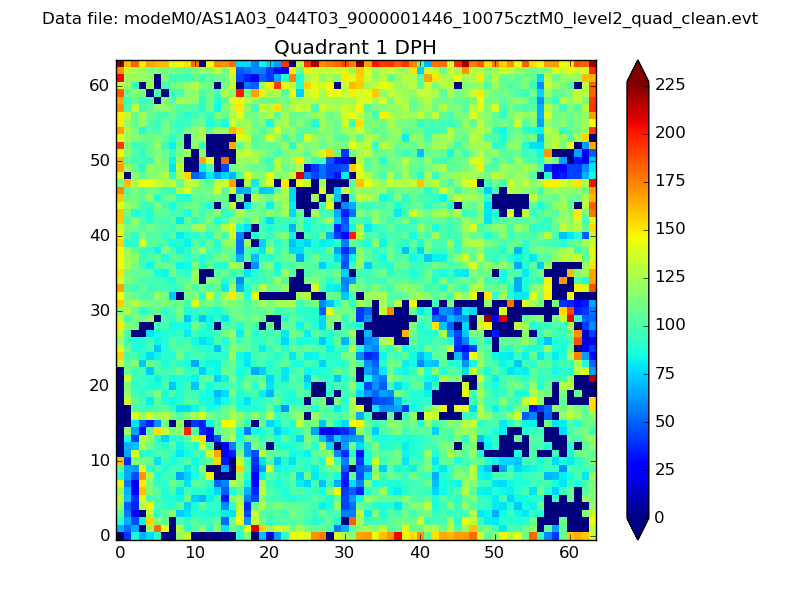 |
Quadrant B |
|---|---|---|---|
| Quadrant D | 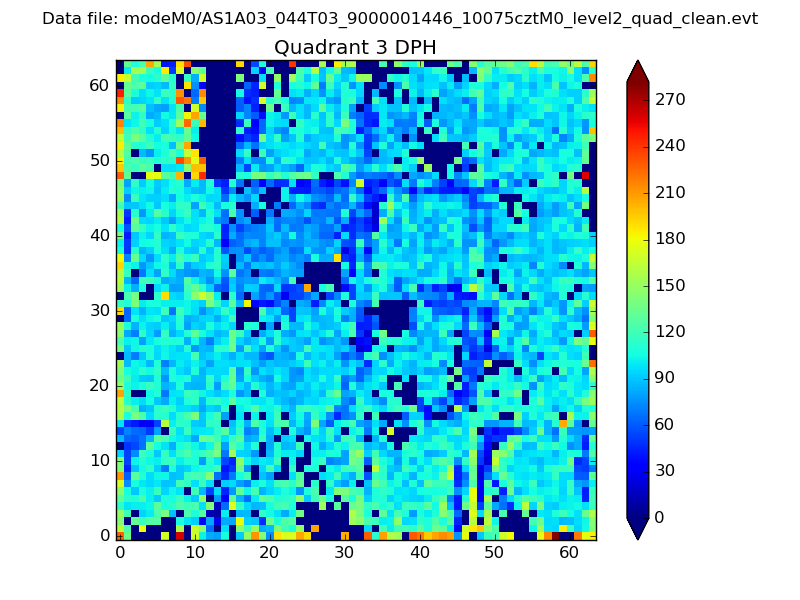 |
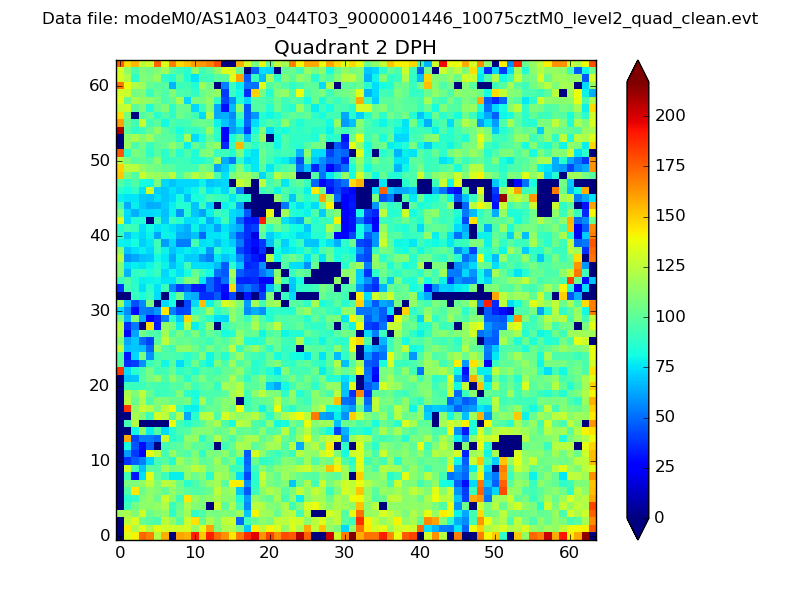 |
Quadrant C |
| Plot type | Count rate plots | Images |
|---|---|---|
| Comparison with Poisson distribution Blue bars denote a histogram of data divided into 1 sec bins. Red curve is a Poisson curve with rate = median count rate of data. |
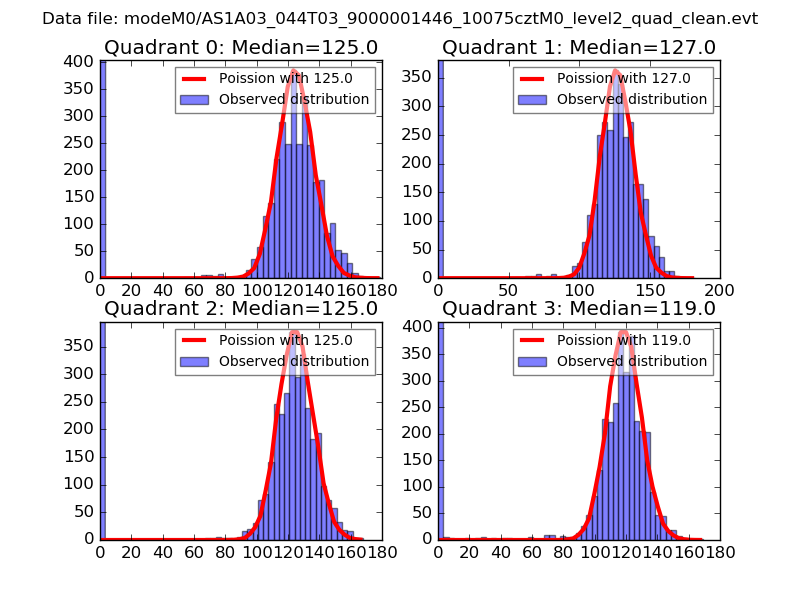 |
 |
| Quadrant-wise count rates Data is divided into 100 sec bins |
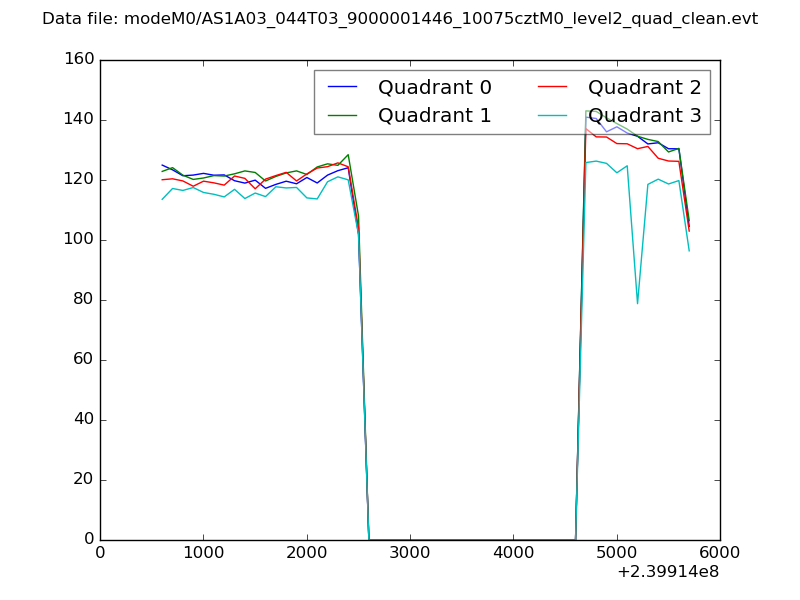 |
|
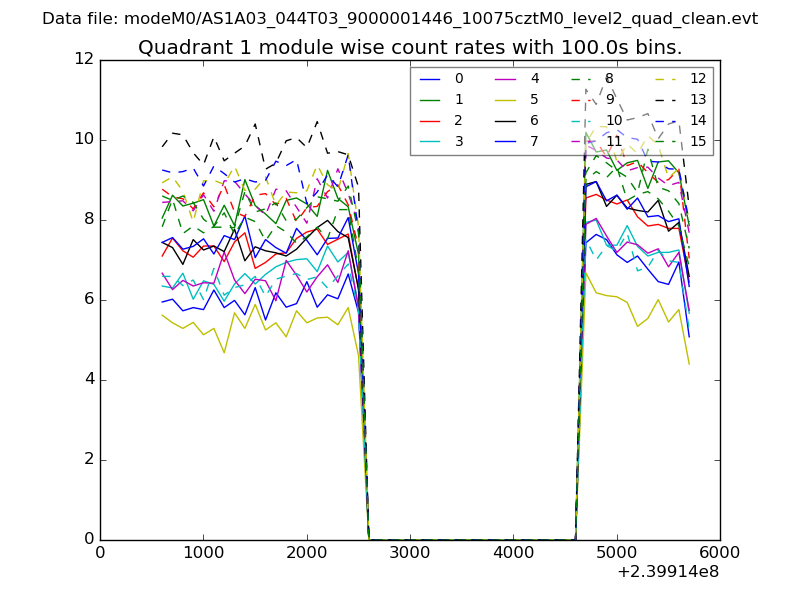
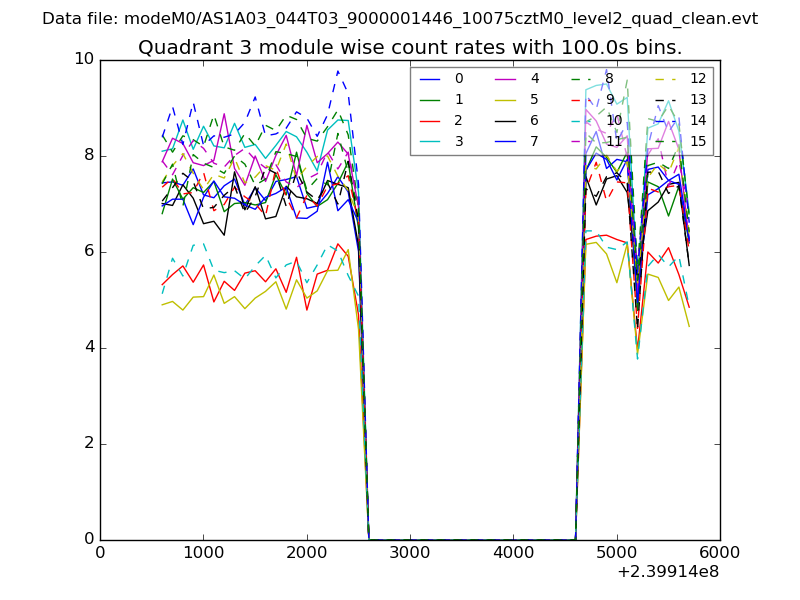
| Module-wise count rates for Quadrant A Data is divided into 100 sec bins |
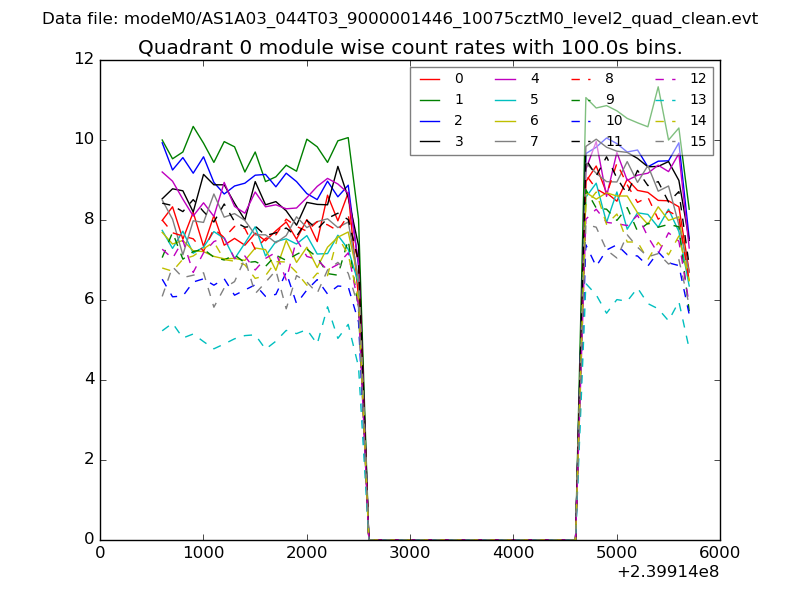 |
 |
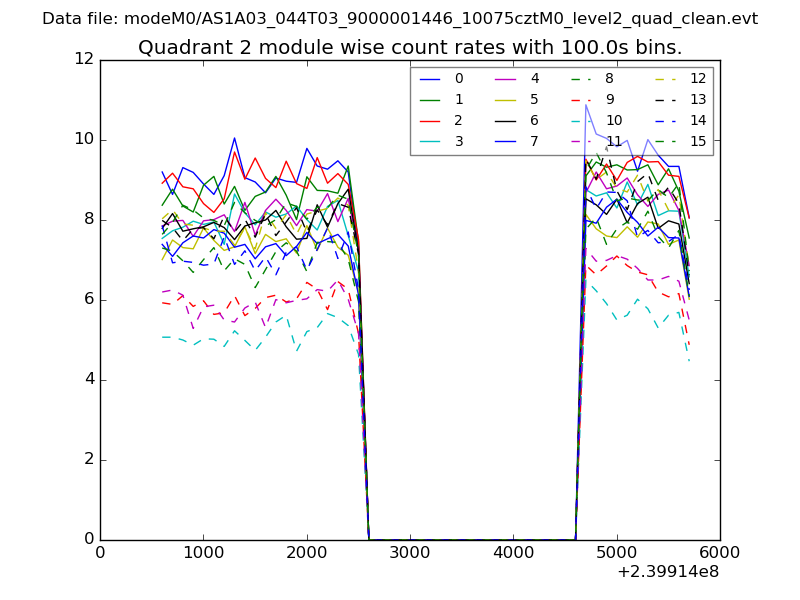
| Module-wise count rates for Quadrant B Data is divided into 100 sec bins |
 |
 |
| Module-wise count rates for Quadrant C Data is divided into 100 sec bins |
 |
 |
| Module-wise count rates for Quadrant D Data is divided into 100 sec bins |
 |
 |
| Parameter | Plot |
|---|---|
| CZT HV Monitor | 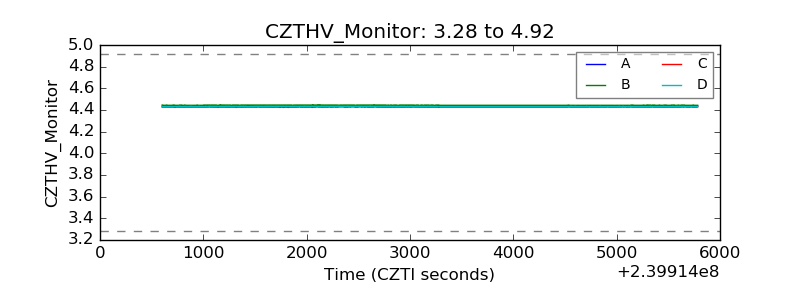 |
| D_VDD | 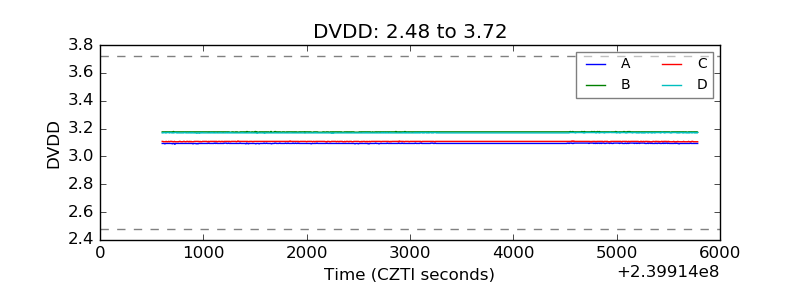 |
| Temperature 1 | 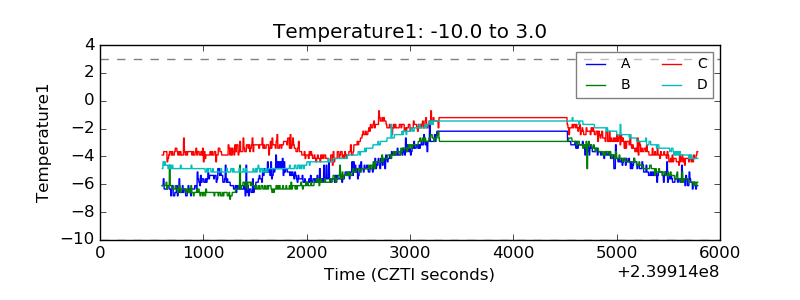 |
| Veto HV Monitor | 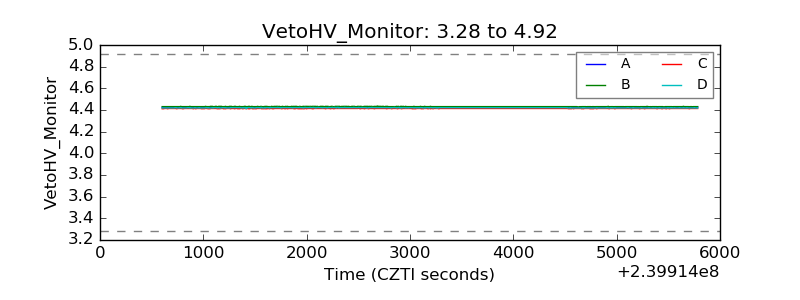 |
| Veto LLD | 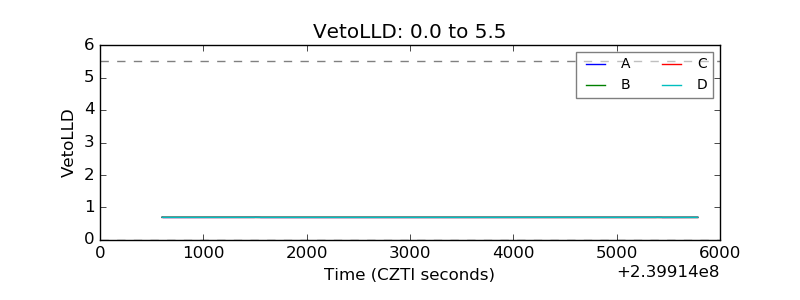 |
| Alpha Counter | 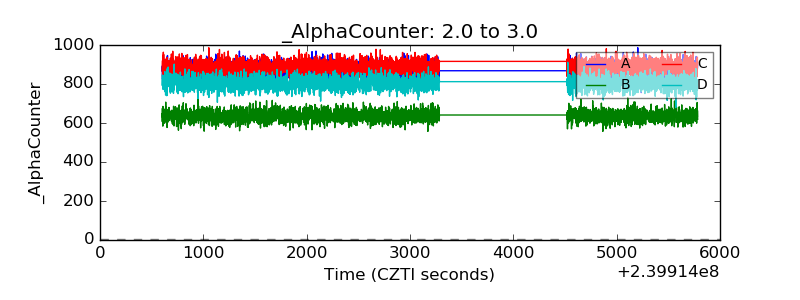 |
| _CPM_Rate | 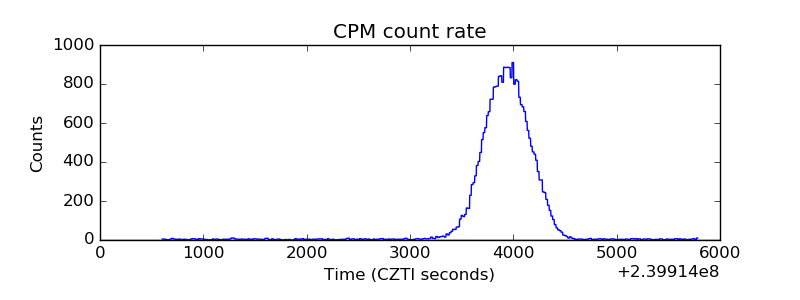 |
| CZT Counter | 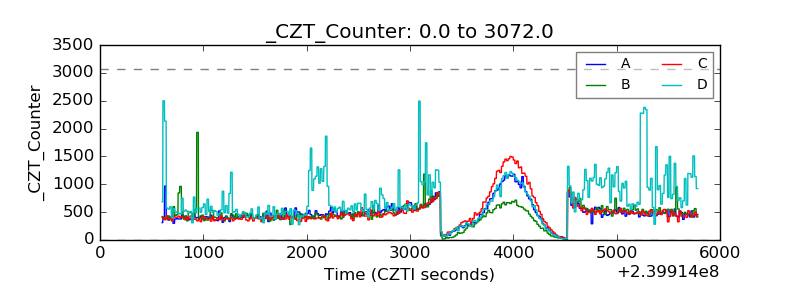 |
| +2.5 Volts monitor |  |
| +5 Volts monitor |  |
| _ROLL_ROT | 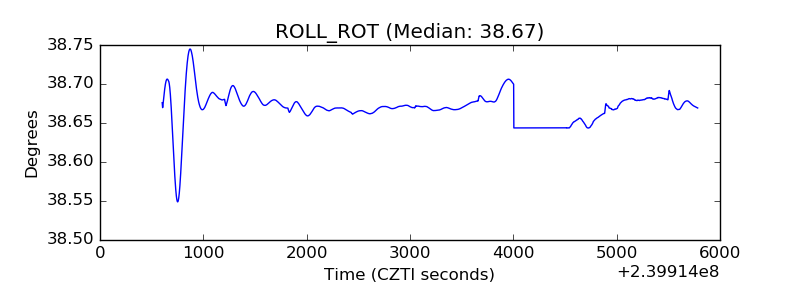 |
| _Roll_DEC | 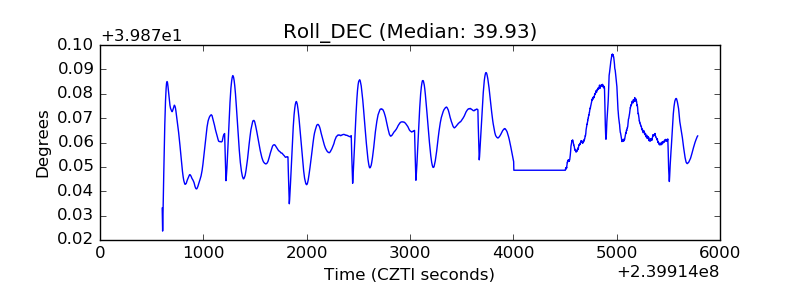 |
| _Roll_RA | 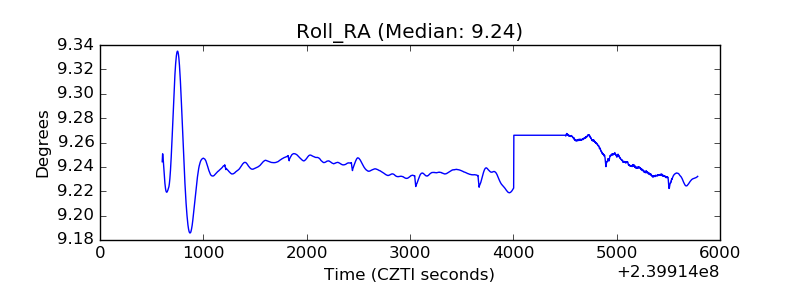 |
| Veto Counter | 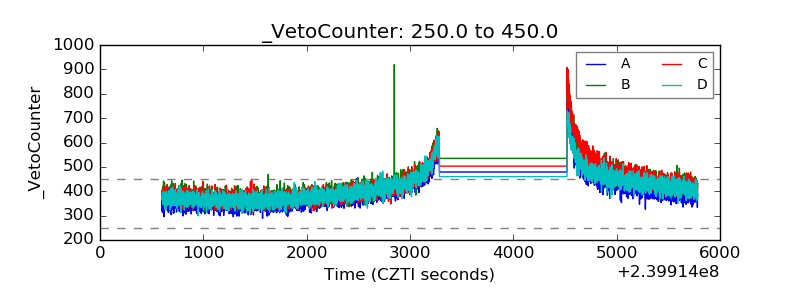 |