| Param | Original file | Final file |
|---|---|---|
| Filename | modeM0/AS1A03_044T03_9000001446_10076cztM0_level2.evt | modeM0/AS1A03_044T03_9000001446_10076cztM0_level2_quad_clean.evt |
| Size (bytes) | 427,245,120 | 79,548,480 |
| Size | 407.5 MB | 75.9 MB |
| Events in quadrant A | 2,842,605 | 515,868 |
| Events in quadrant B | 2,882,563 | 518,596 |
| Events in quadrant C | 2,725,071 | 510,060 |
| Events in quadrant D | 4,091,236 | 456,673 |
| Mode M0 | |||
|---|---|---|---|
| Quadrant | BADHDUFLAG | Total packets | Discarded packets |
| A | 0 | 14388 | 1939 |
| B | 0 | 14710 | 2229 |
| C | 0 | 14132 | 1925 |
| D | 0 | 20221 | 4238 |
| Mode SS | |||
|---|---|---|---|
| Quadrant | BADHDUFLAG | Total packets | Discarded packets |
| A | 0 | 140 | 10 |
| B | 0 | 140 | 20 |
| C | 0 | 140 | 32 |
| D | 0 | 140 | 14 |
| Mode M9 | |||
|---|---|---|---|
| Quadrant | BADHDUFLAG | Total packets | Discarded packets |
| A | 0 | 23 | 5 |
| B | 0 | 23 | 4 |
| C | 0 | 23 | 0 |
| D | 0 | 23 | 4 |
| Quadrant | Total seconds | Saturated seconds | Saturation percentage |
|---|---|---|---|
| A | 5944 | 48 | 0.807537% |
| B | 5856 | 58 | 0.990437% |
| C | 5919 | 35 | 0.591316% |
| D | 5538 | 157 | 2.834958% |
Noise dominated data is calculated using 1-second bins in cleaned event files. If a bin has >2000 counts, and if more than 50% of those come from <1% of pixels, then it is considered to be noise-dominated and hence unusable.
| Quadrant | # 1 sec bins | Bins with >0 counts | Bins with >2000 counts | High rate bins dominated by noise | Noise dominated (total time) | Noise dominated (detector-on time) | Marked lightcurve |
|---|---|---|---|---|---|---|---|
| A | 9057 | 6634 | 1 | 1 | 0.01% | 0.02% | 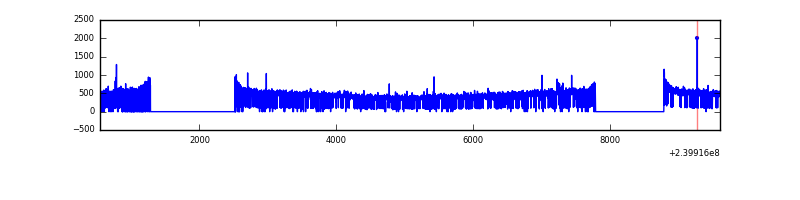 |
| B | 9056 | 6583 | 3 | 3 | 0.03% | 0.05% | 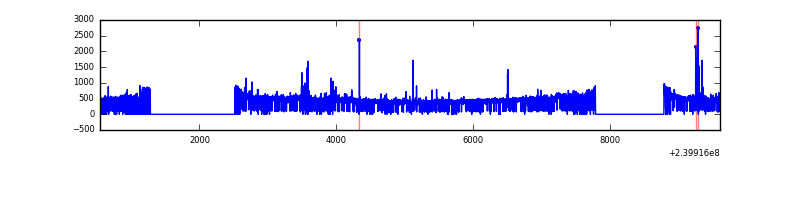 |
| C | 9057 | 6637 | 0 | 0 | 0.00% | 0.00% | 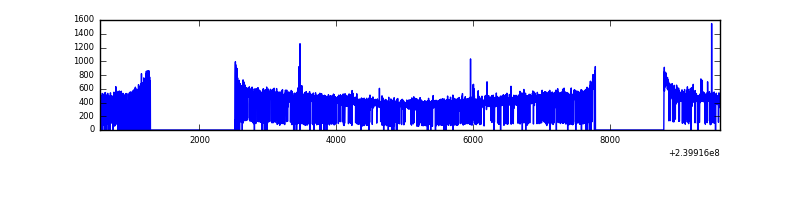 |
| D | 9057 | 6405 | 73 | 73 | 0.81% | 1.14% | 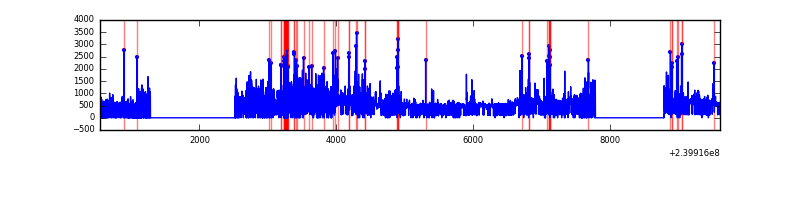 |
Top three noisy pixels from each quadrant. If the there are fewer than three noisy pixels in the level2.evt file, extra rows are filled as -1
| Pixel properties | Quadrant properties | ||||||
|---|---|---|---|---|---|---|---|
| Quadrant | DetID | PixID | Counts | Sigma | Mean | Median | Sigma |
| A | 0 | 8 | 44133 | 299.49 | 713 | 697 | 145.0 |
| A | 8 | 15 | 37502 | 253.77 | 713 | 697 | 145.0 |
| A | 8 | 5 | 11992 | 77.88 | 713 | 697 | 145.0 |
| B | 4 | 239 | 50447 | 369.35 | 705 | 688 | 134.7 |
| B | 0 | 214 | 29924 | 217.01 | 705 | 688 | 134.7 |
| B | 4 | 81 | 24822 | 179.14 | 705 | 688 | 134.7 |
| C | 14 | 234 | 8484 | 48.32 | 694 | 697 | 161.2 |
| C | 13 | 61 | 5127 | 27.49 | 694 | 697 | 161.2 |
| C | 4 | 239 | 3491 | 17.34 | 694 | 697 | 161.2 |
| D | 2 | 16 | 651063 | 3811.82 | 633 | 617 | 170.6 |
| D | 8 | 195 | 474201 | 2775.35 | 633 | 617 | 170.6 |
| D | 2 | 152 | 116289 | 677.87 | 633 | 617 | 170.6 |
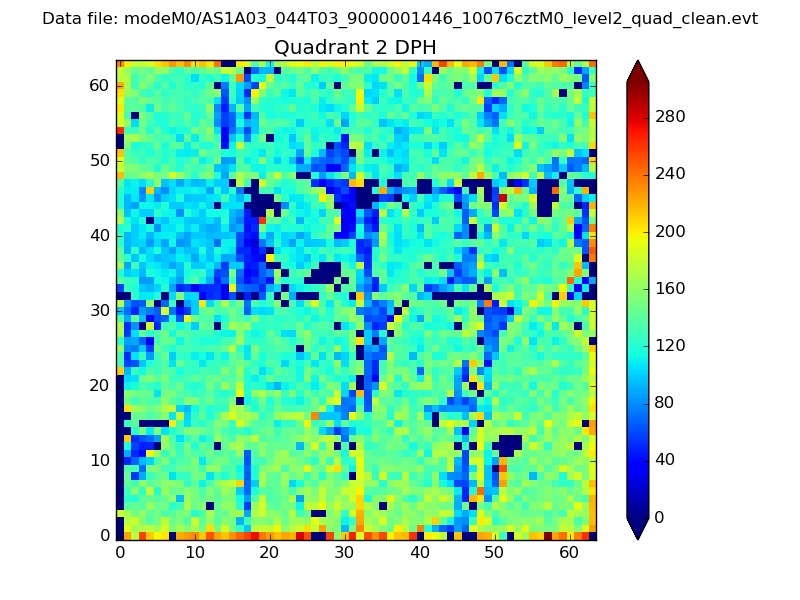
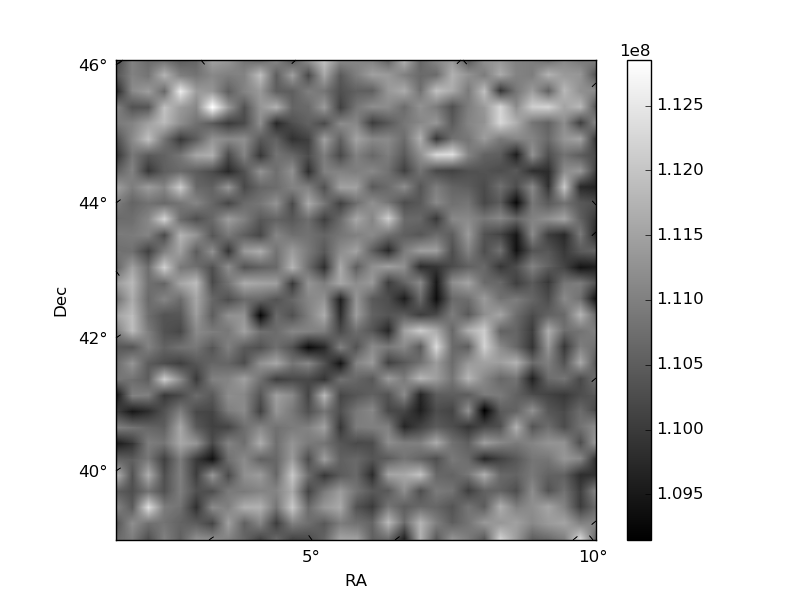
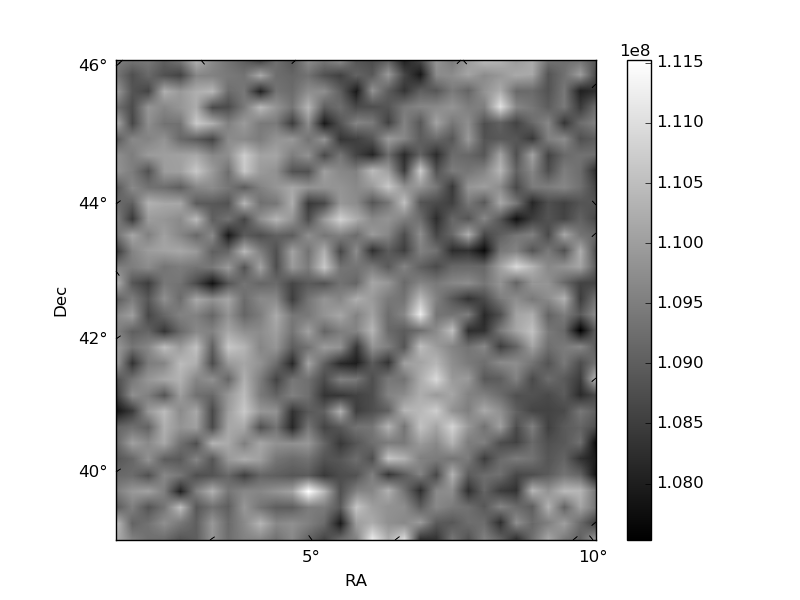
Histogram calculated using DETX and DETY for each event in the final _common_clean file
| Quadrant A | 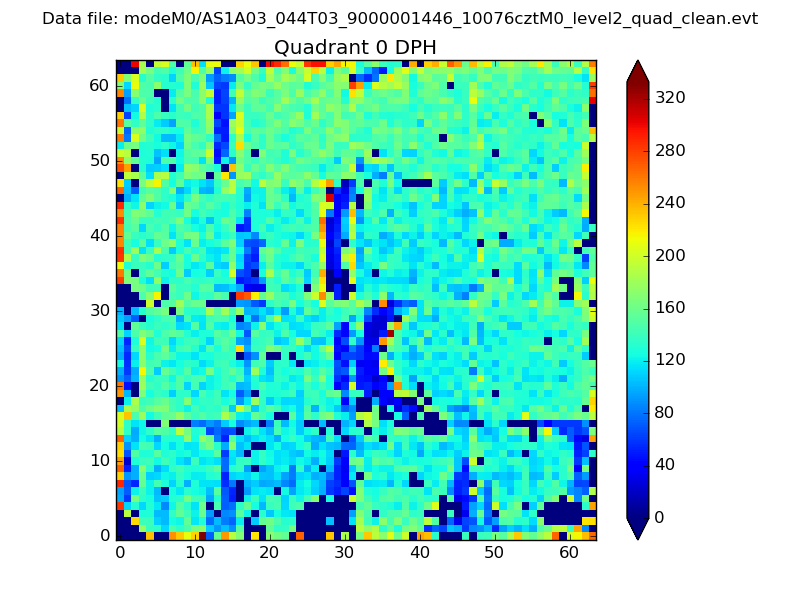 |
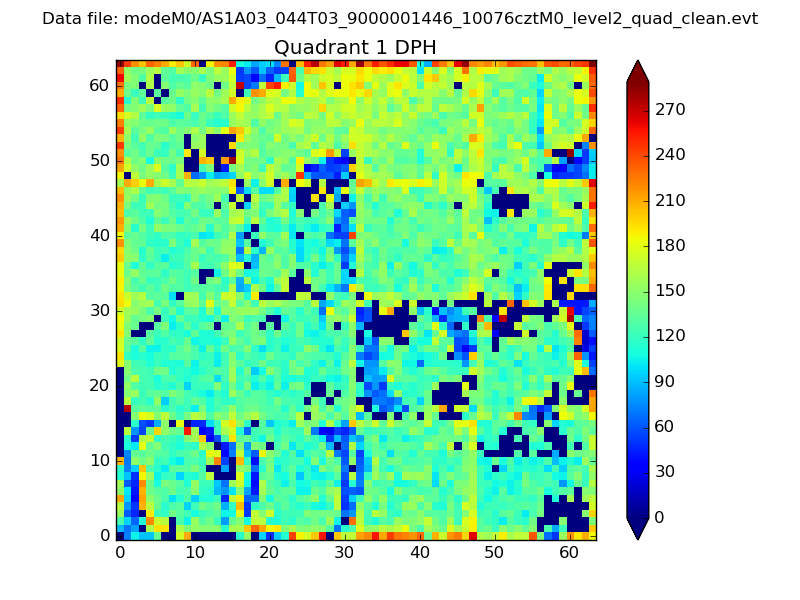 |
Quadrant B |
|---|---|---|---|
| Quadrant D | 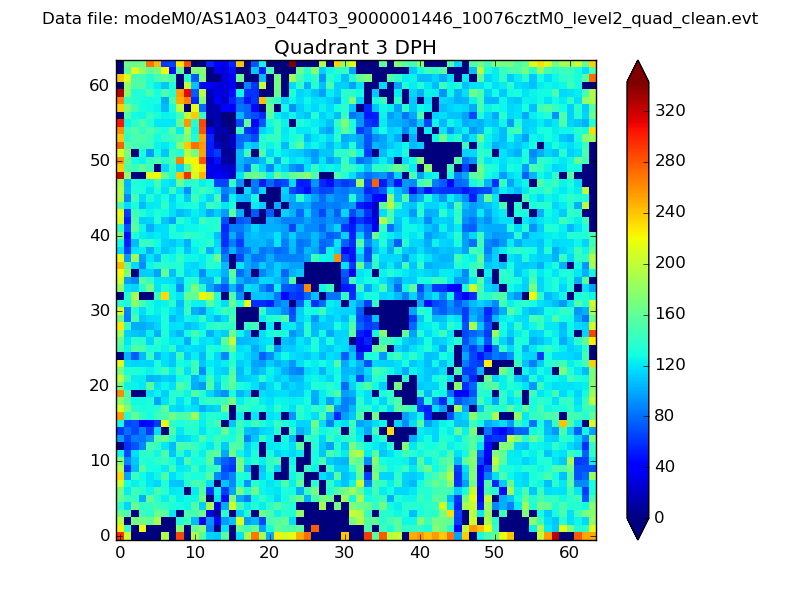 |
 |
Quadrant C |
| Plot type | Count rate plots | Images |
|---|---|---|
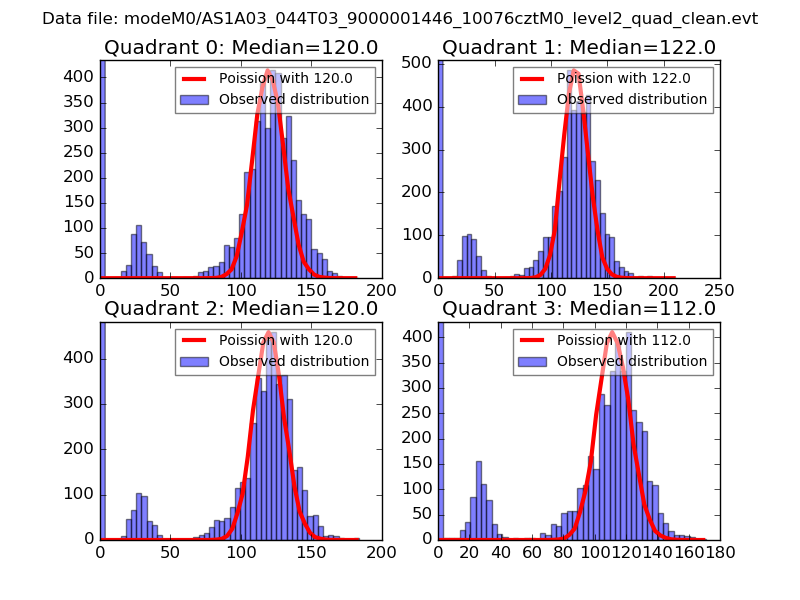
| Comparison with Poisson distribution Blue bars denote a histogram of data divided into 1 sec bins. Red curve is a Poisson curve with rate = median count rate of data. |
 |
 |
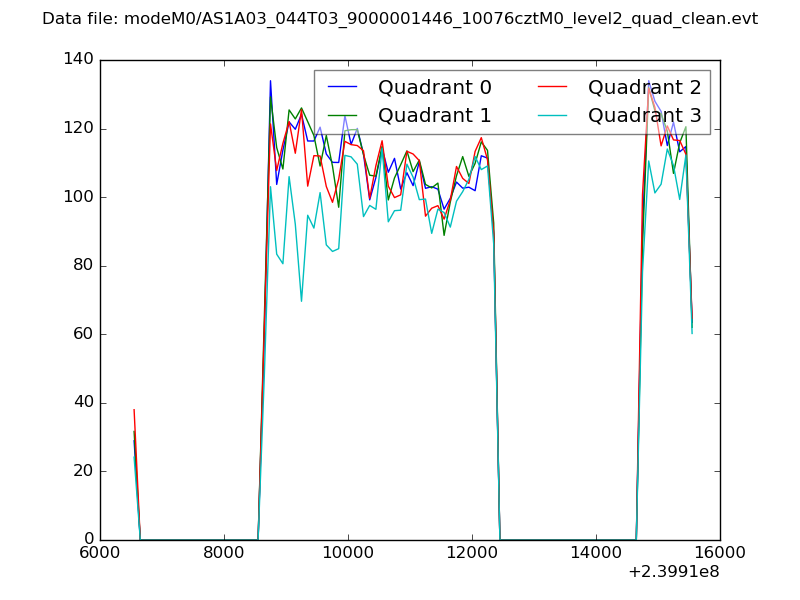
| Quadrant-wise count rates Data is divided into 100 sec bins |
 |
|
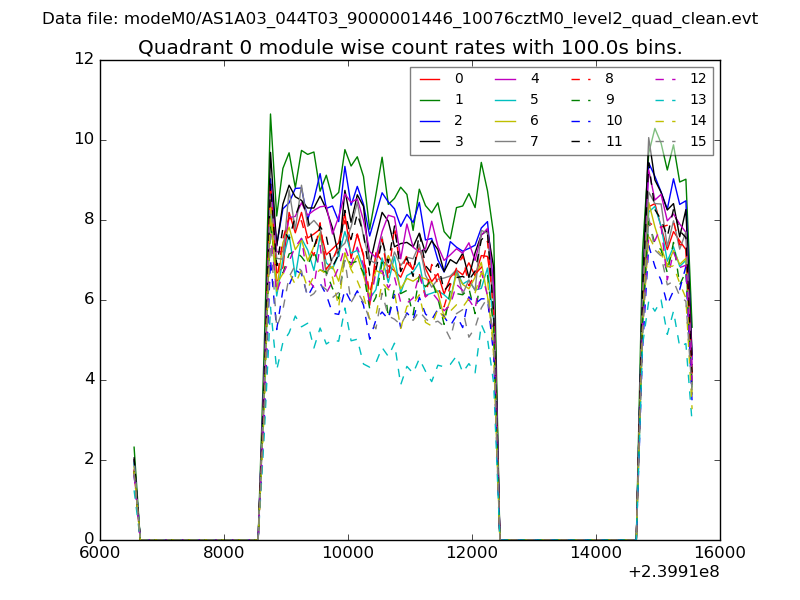
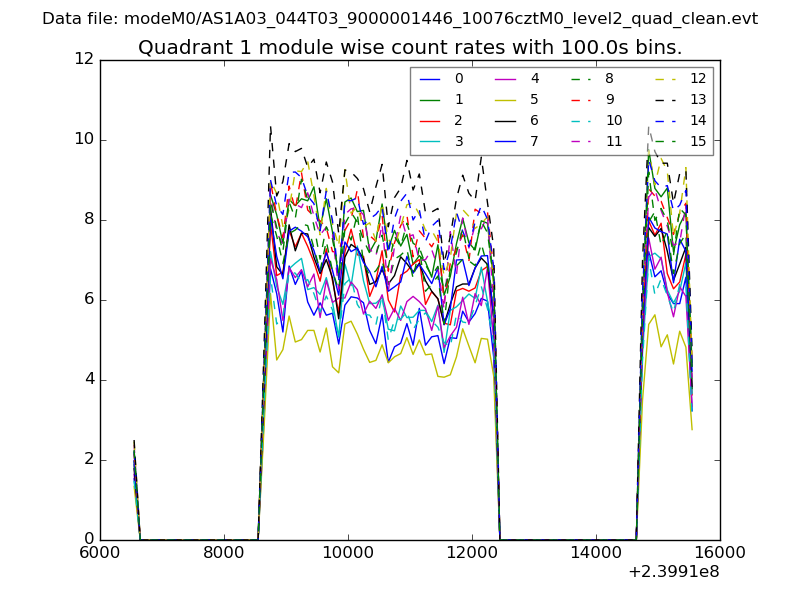
| Module-wise count rates for Quadrant A Data is divided into 100 sec bins |
 |
 |
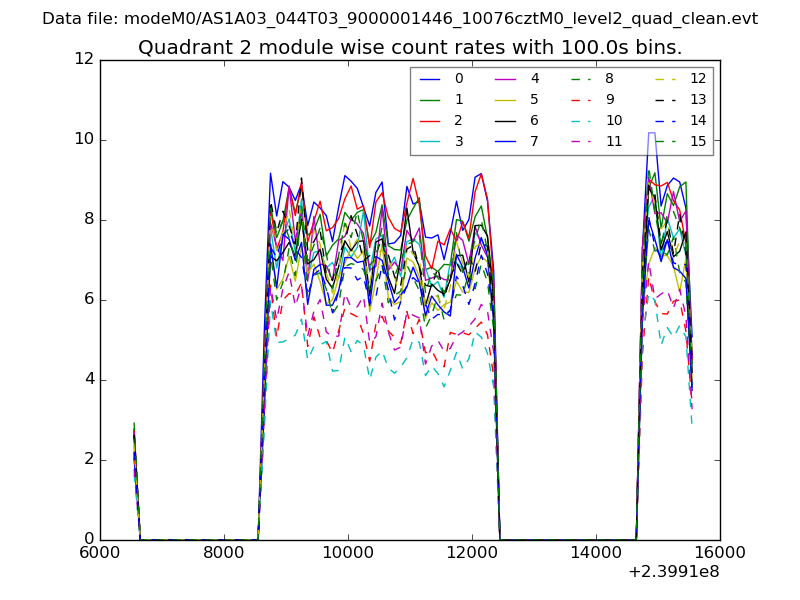
| Module-wise count rates for Quadrant B Data is divided into 100 sec bins |
 |
 |
| Module-wise count rates for Quadrant C Data is divided into 100 sec bins |
 |
 |
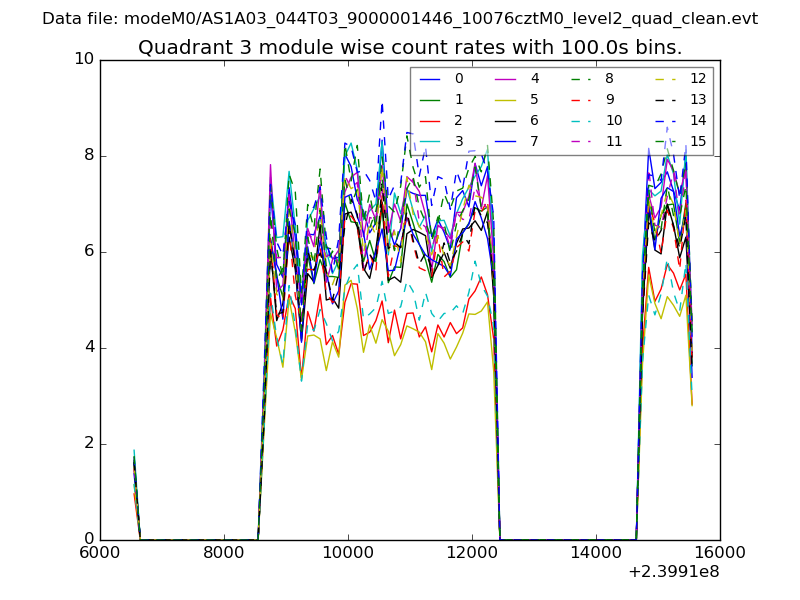
| Module-wise count rates for Quadrant D Data is divided into 100 sec bins |
 |
 |
| Parameter | Plot |
|---|---|
| CZT HV Monitor | 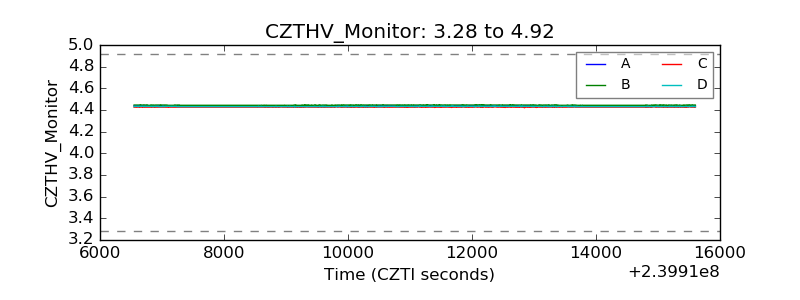 |
| D_VDD | 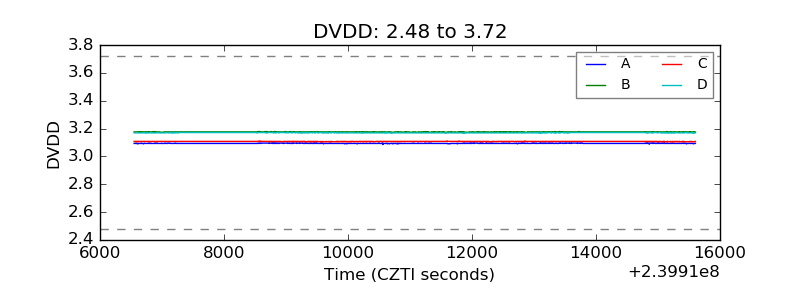 |
| Temperature 1 | 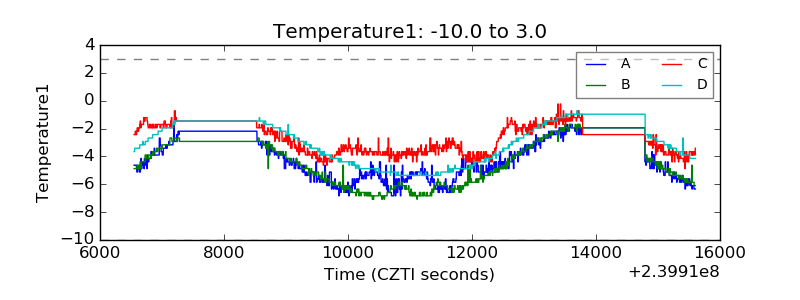 |
| Veto HV Monitor | 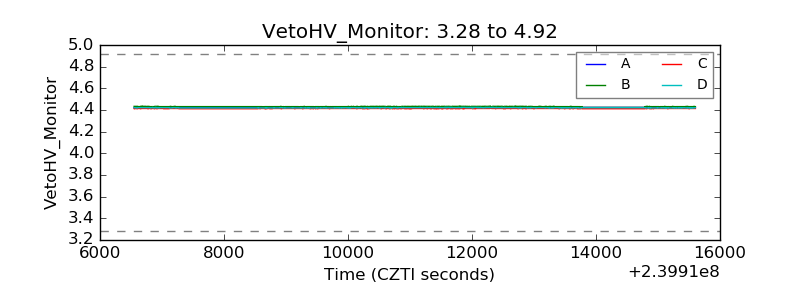 |
| Veto LLD | 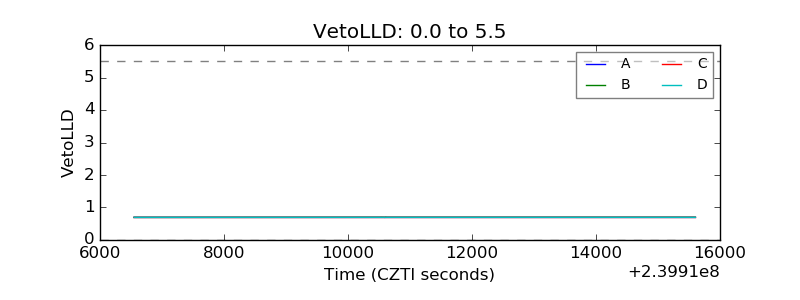 |
| Alpha Counter | 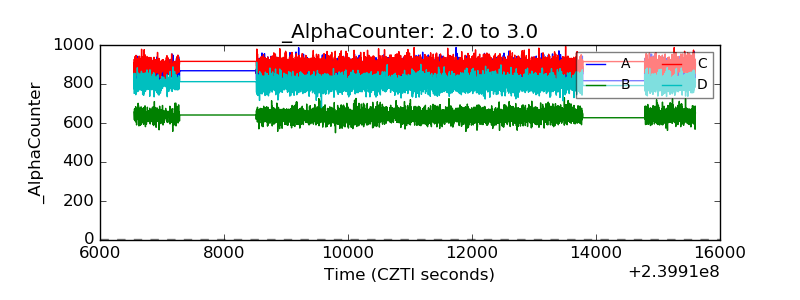 |
| _CPM_Rate | 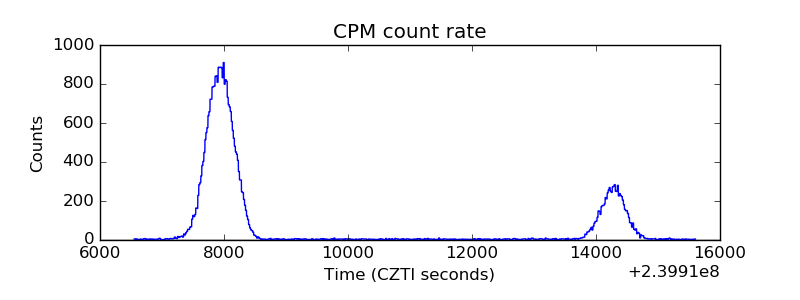 |
| CZT Counter | 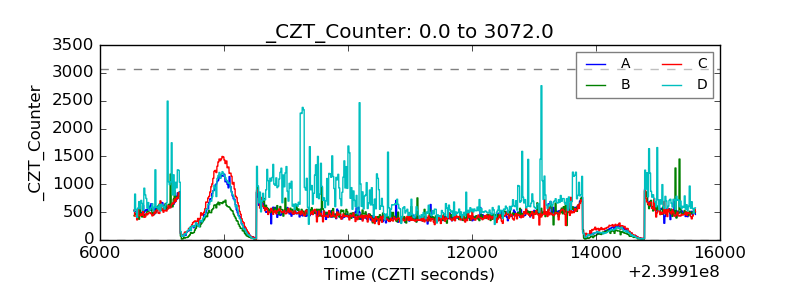 |
| +2.5 Volts monitor |  |
| +5 Volts monitor |  |
| _ROLL_ROT | 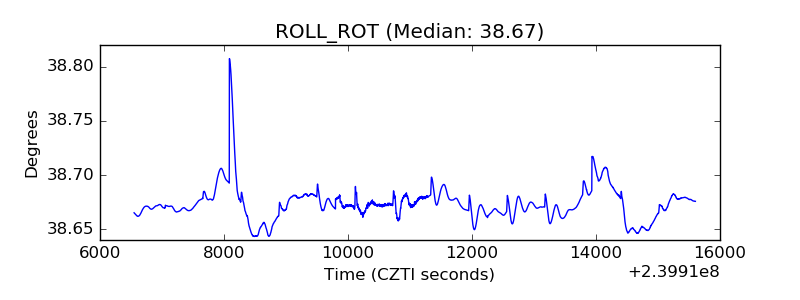 |
| _Roll_DEC | 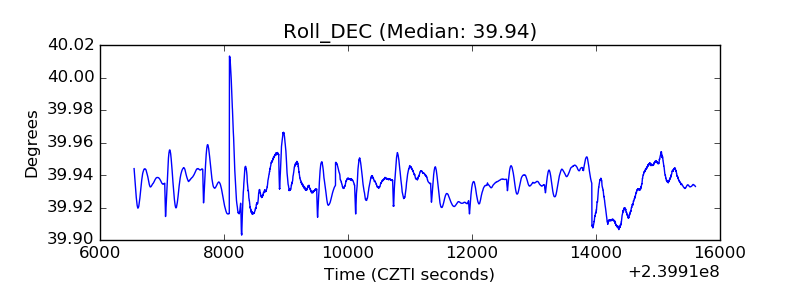 |
| _Roll_RA | 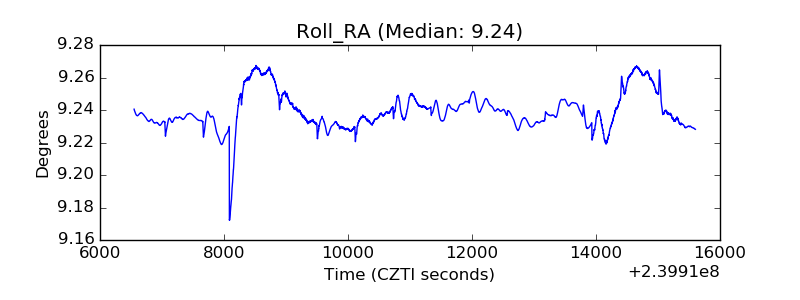 |
| Veto Counter | 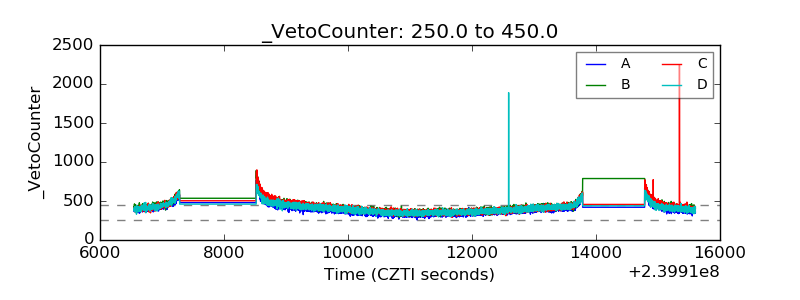 |