| Param | Original file | Final file |
|---|---|---|
| Filename | modeM0/AS1A03_044T03_9000001446_10077cztM0_level2.evt | modeM0/AS1A03_044T03_9000001446_10077cztM0_level2_quad_clean.evt |
| Size (bytes) | 317,831,040 | 63,377,280 |
| Size | 303.1 MB | 60.4 MB |
| Events in quadrant A | 2,096,360 | 414,573 |
| Events in quadrant B | 2,150,366 | 415,881 |
| Events in quadrant C | 2,010,826 | 407,353 |
| Events in quadrant D | 3,056,174 | 360,193 |
| Mode M0 | |||
|---|---|---|---|
| Quadrant | BADHDUFLAG | Total packets | Discarded packets |
| A | 0 | 12609 | 3116 |
| B | 0 | 12973 | 3426 |
| C | 0 | 12467 | 3157 |
| D | 0 | 17965 | 5958 |
| Mode SS | |||
|---|---|---|---|
| Quadrant | BADHDUFLAG | Total packets | Discarded packets |
| A | 0 | 124 | 38 |
| B | 0 | 124 | 30 |
| C | 0 | 124 | 32 |
| D | 0 | 125 | 29 |
| Mode M9 | |||
|---|---|---|---|
| Quadrant | BADHDUFLAG | Total packets | Discarded packets |
| A | 0 | 10 | 9 |
| B | 0 | 10 | 7 |
| C | 0 | 10 | 8 |
| D | 0 | 10 | 9 |
| Quadrant | Total seconds | Saturated seconds | Saturation percentage |
|---|---|---|---|
| A | 4656 | 10 | 0.214777% |
| B | 4608 | 16 | 0.347222% |
| C | 4606 | 7 | 0.151976% |
| D | 4355 | 61 | 1.400689% |
Noise dominated data is calculated using 1-second bins in cleaned event files. If a bin has >2000 counts, and if more than 50% of those come from <1% of pixels, then it is considered to be noise-dominated and hence unusable.
| Quadrant | # 1 sec bins | Bins with >0 counts | Bins with >2000 counts | High rate bins dominated by noise | Noise dominated (total time) | Noise dominated (detector-on time) | Marked lightcurve |
|---|---|---|---|---|---|---|---|
| A | 7053 | 5003 | 0 | 0 | 0.00% | 0.00% | 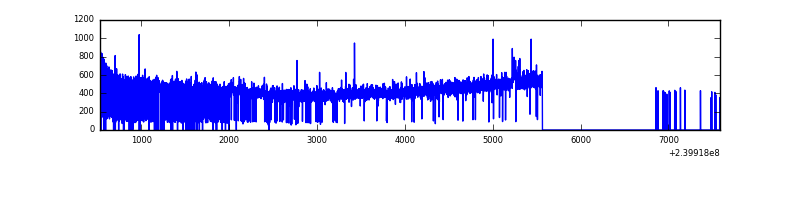 |
| B | 7054 | 4986 | 1 | 1 | 0.01% | 0.02% | 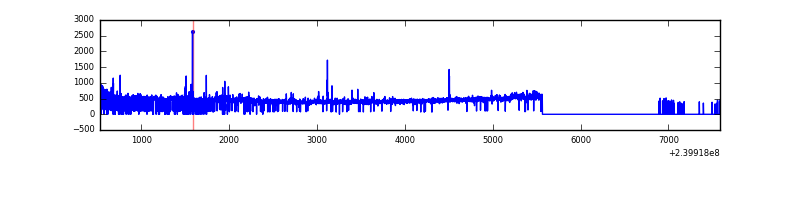 |
| C | 7050 | 4974 | 0 | 0 | 0.00% | 0.00% | 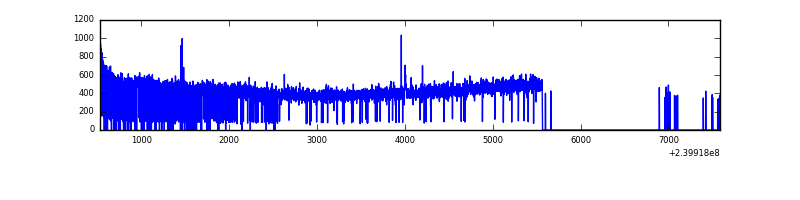 |
| D | 7053 | 4785 | 40 | 40 | 0.57% | 0.84% | 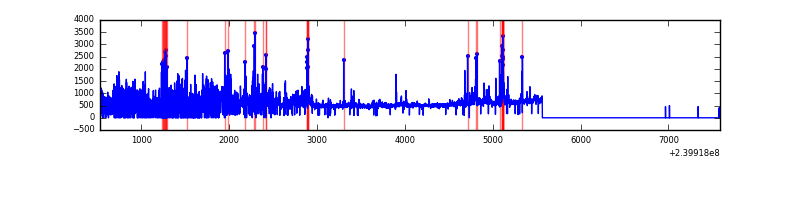 |
Top three noisy pixels from each quadrant. If the there are fewer than three noisy pixels in the level2.evt file, extra rows are filled as -1
| Pixel properties | Quadrant properties | ||||||
|---|---|---|---|---|---|---|---|
| Quadrant | DetID | PixID | Counts | Sigma | Mean | Median | Sigma |
| A | 0 | 8 | 18785 | 168.07 | 532 | 522 | 108.7 |
| A | 8 | 15 | 18286 | 163.48 | 532 | 522 | 108.7 |
| A | 8 | 5 | 6818 | 57.94 | 532 | 522 | 108.7 |
| B | 0 | 214 | 22416 | 216.88 | 530 | 519 | 101.0 |
| B | 4 | 239 | 22386 | 216.58 | 530 | 519 | 101.0 |
| B | 4 | 81 | 18002 | 173.16 | 530 | 519 | 101.0 |
| C | 14 | 234 | 4642 | 34.7 | 512 | 514 | 119.0 |
| C | 13 | 61 | 3744 | 27.15 | 512 | 514 | 119.0 |
| C | 4 | 239 | 3675 | 26.57 | 512 | 514 | 119.0 |
| D | 2 | 16 | 525941 | 4197.88 | 475 | 464 | 125.2 |
| D | 8 | 195 | 359820 | 2870.79 | 475 | 464 | 125.2 |
| D | 2 | 152 | 96337 | 765.9 | 475 | 464 | 125.2 |
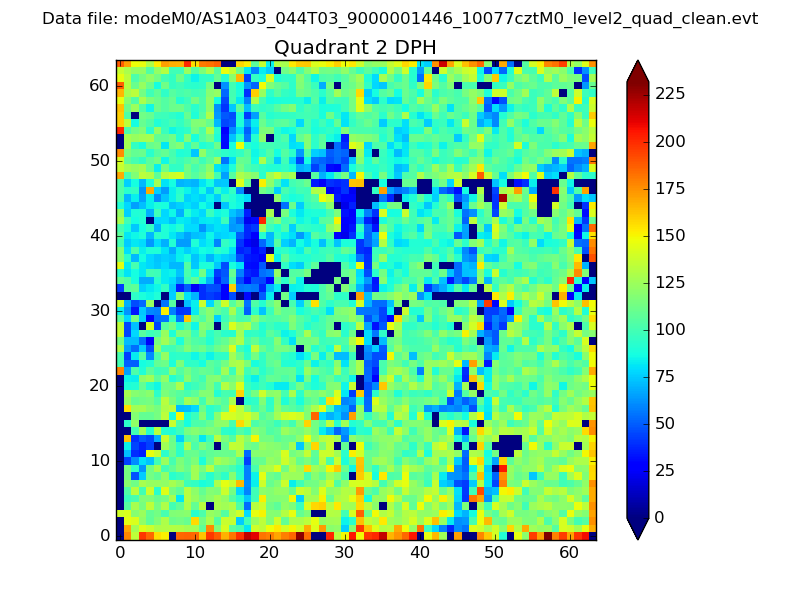
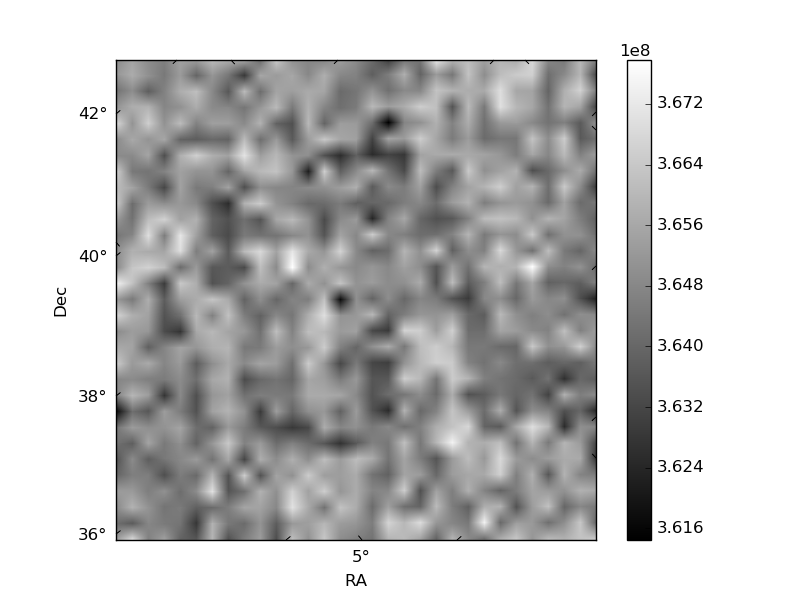
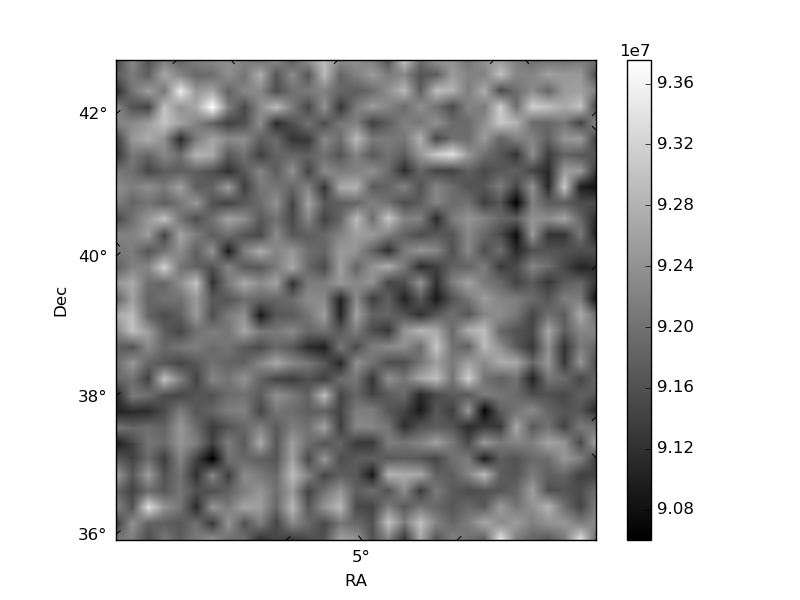
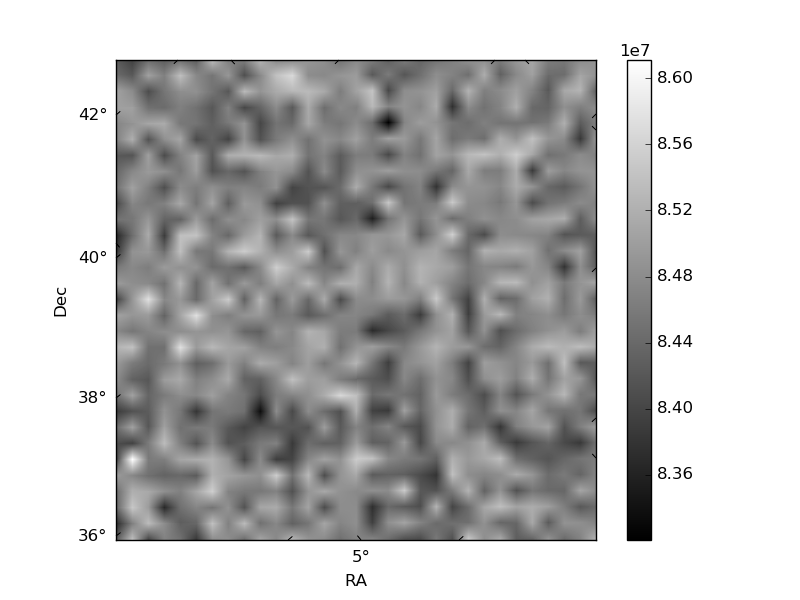
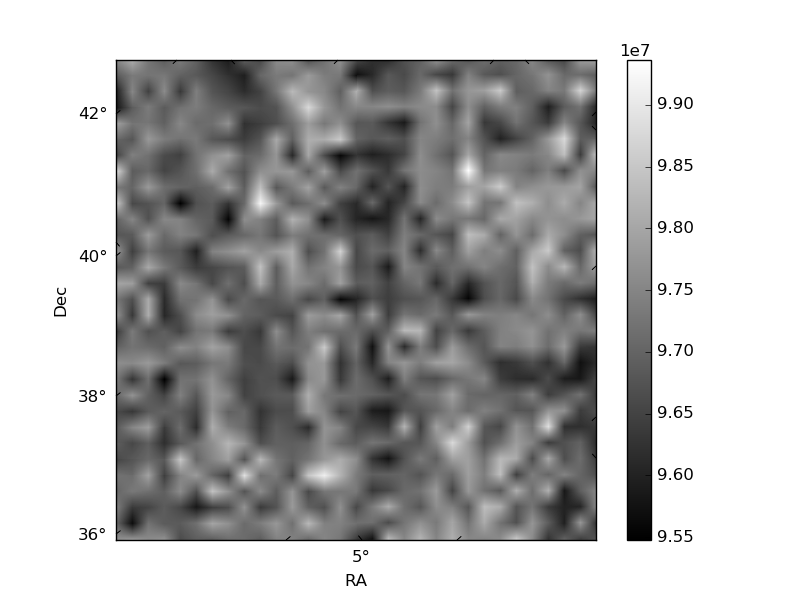
Histogram calculated using DETX and DETY for each event in the final _common_clean file
| Quadrant A | 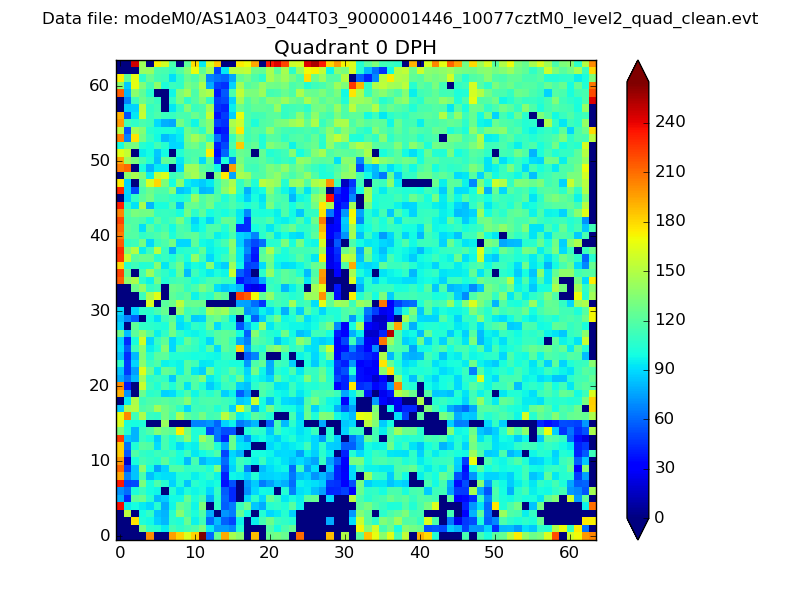 |
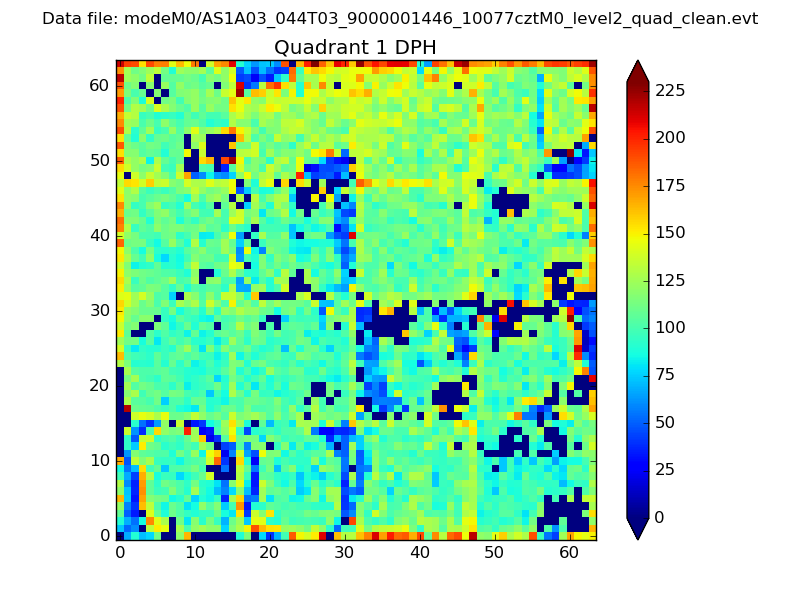 |
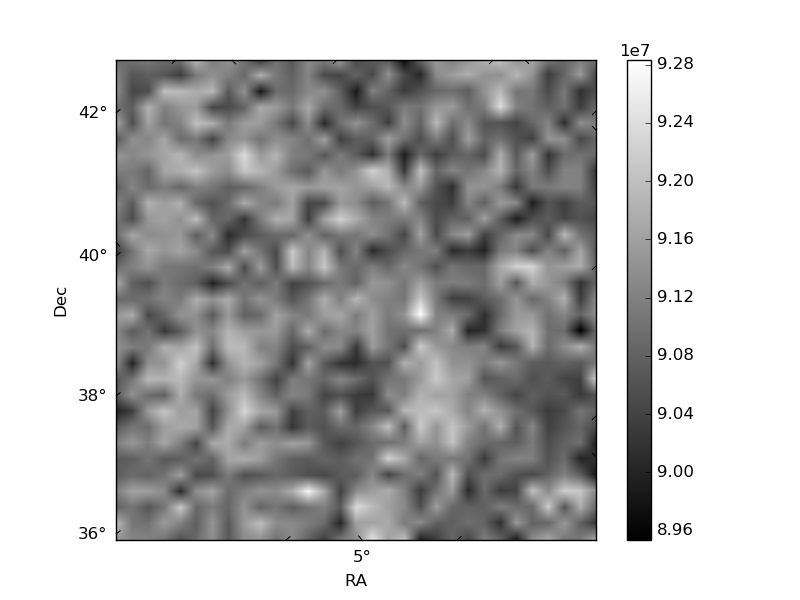
Quadrant B |
|---|---|---|---|
| Quadrant D | 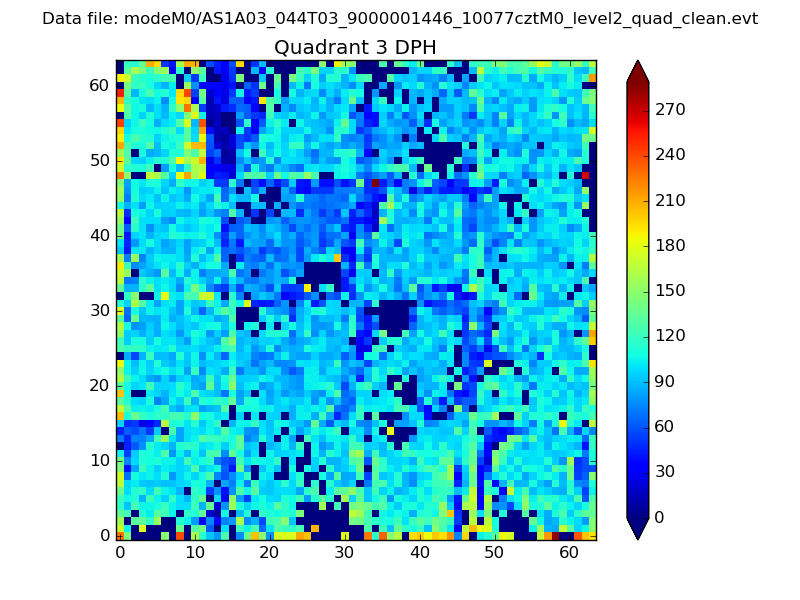 |
 |
Quadrant C |
| Plot type | Count rate plots | Images |
|---|---|---|
| Comparison with Poisson distribution Blue bars denote a histogram of data divided into 1 sec bins. Red curve is a Poisson curve with rate = median count rate of data. |
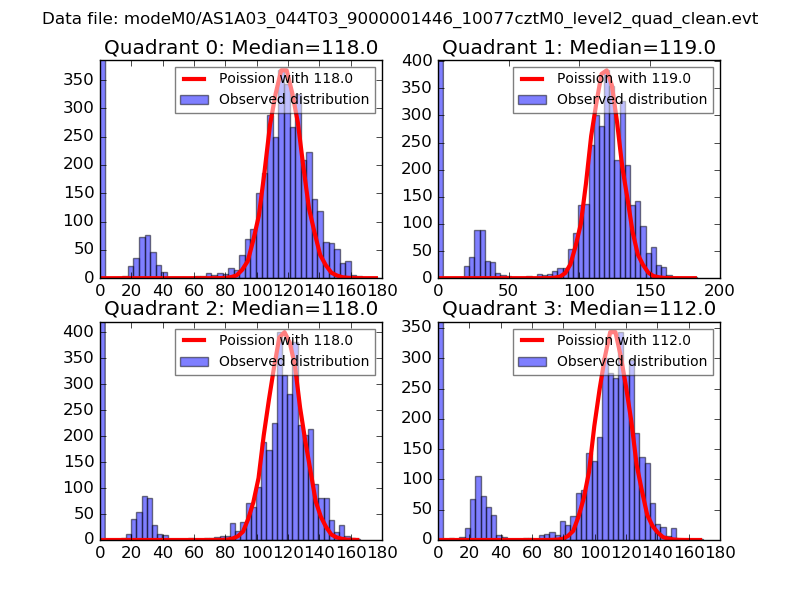 |
 |
| Quadrant-wise count rates Data is divided into 100 sec bins |
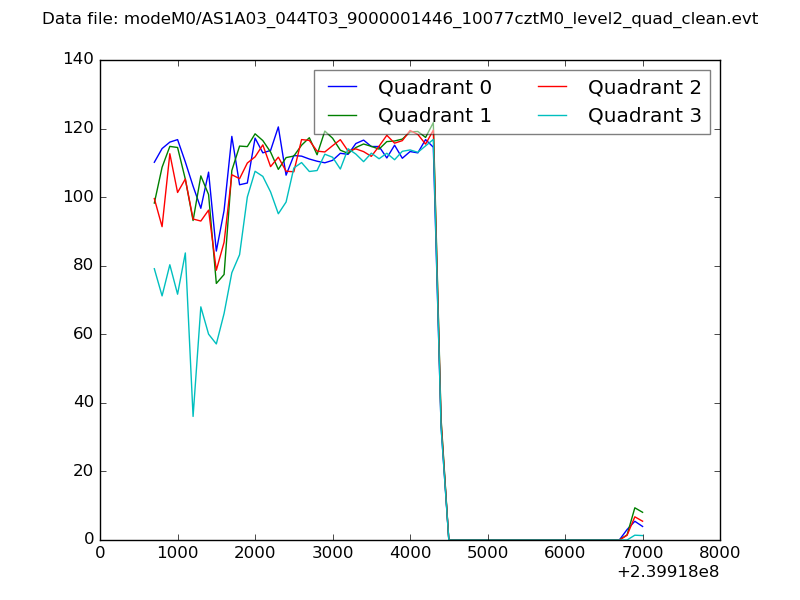 |
|
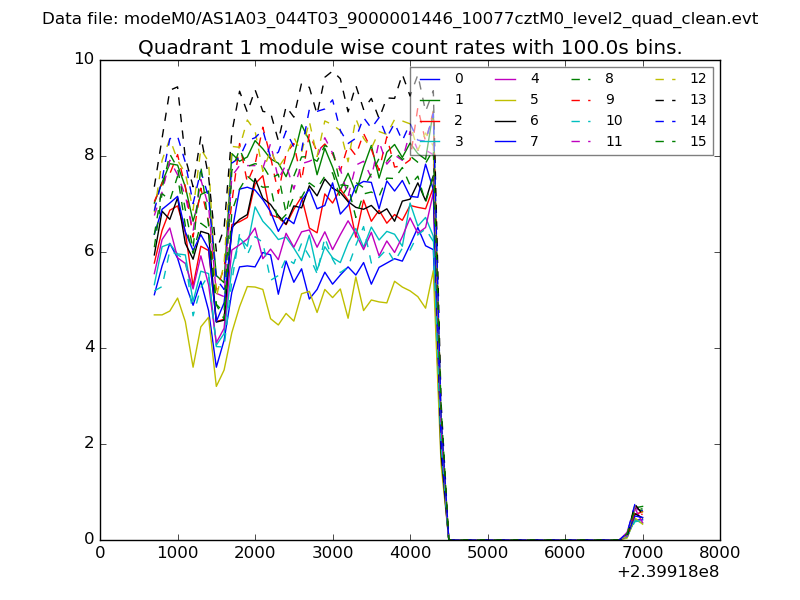
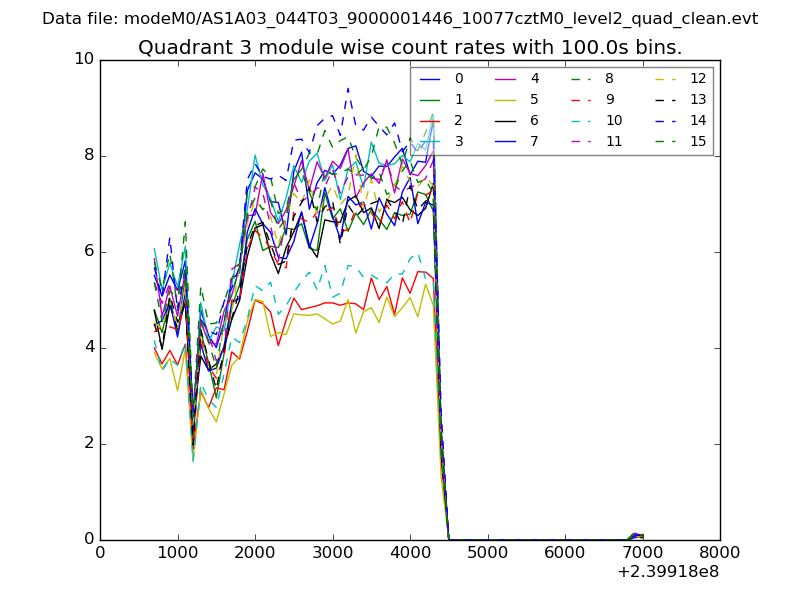
| Module-wise count rates for Quadrant A Data is divided into 100 sec bins |
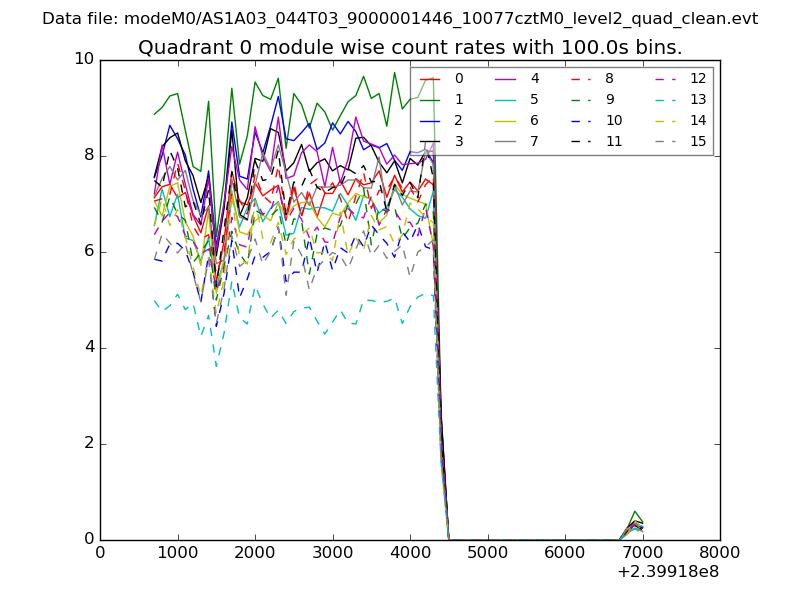 |
 |
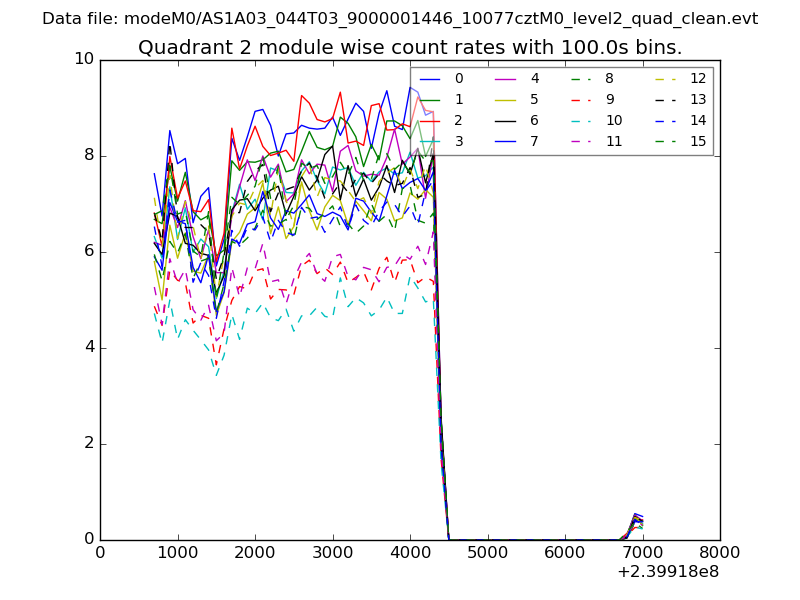
| Module-wise count rates for Quadrant B Data is divided into 100 sec bins |
 |
 |
| Module-wise count rates for Quadrant C Data is divided into 100 sec bins |
 |
 |
| Module-wise count rates for Quadrant D Data is divided into 100 sec bins |
 |
 |
| Parameter | Plot |
|---|---|
| CZT HV Monitor | 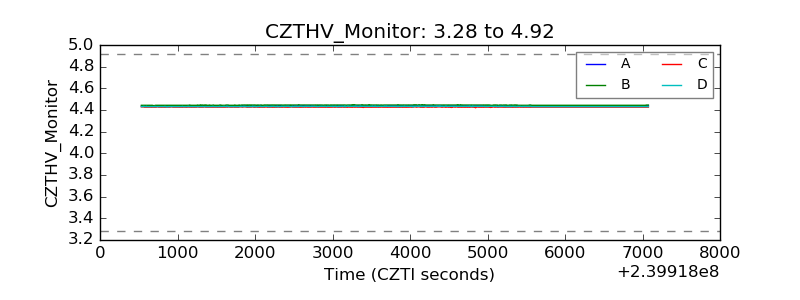 |
| D_VDD |  |
| Temperature 1 | 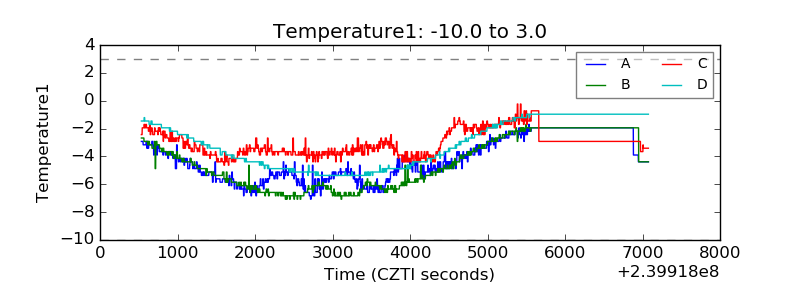 |
| Veto HV Monitor | 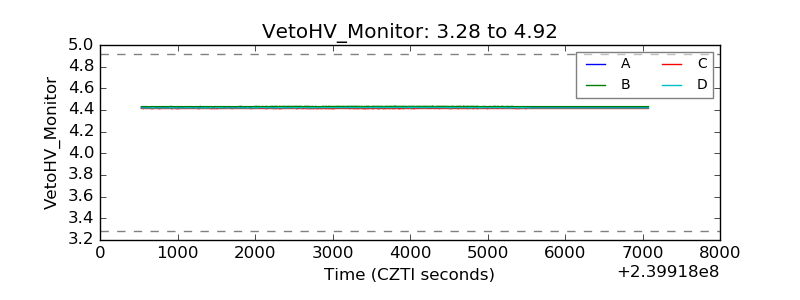 |
| Veto LLD | 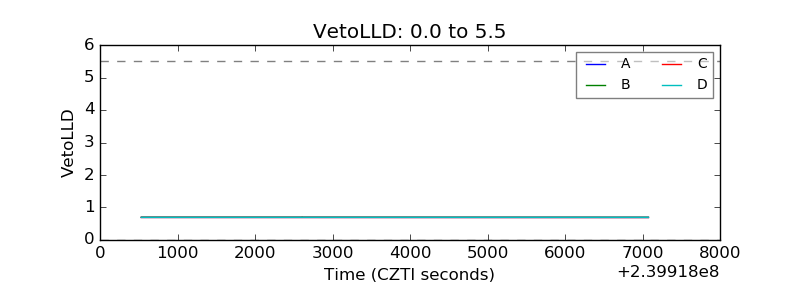 |
| Alpha Counter | 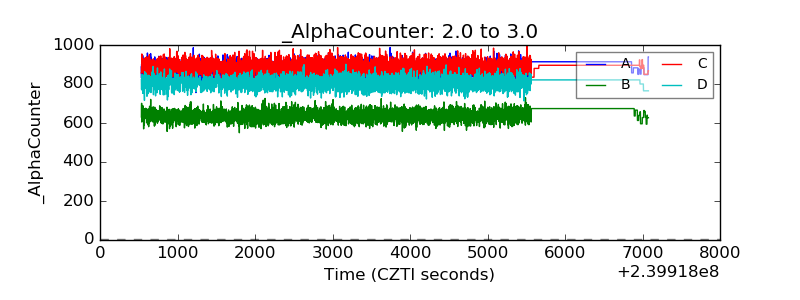 |
| _CPM_Rate | 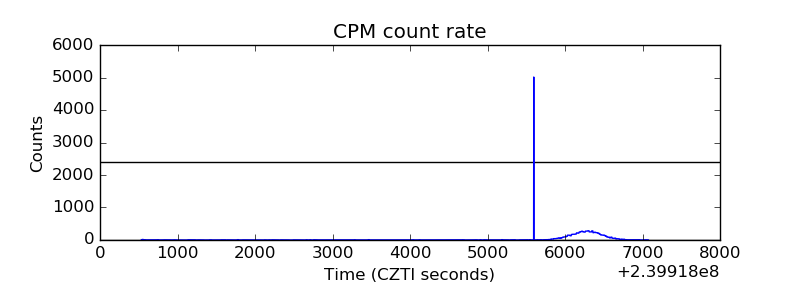 |
| CZT Counter | 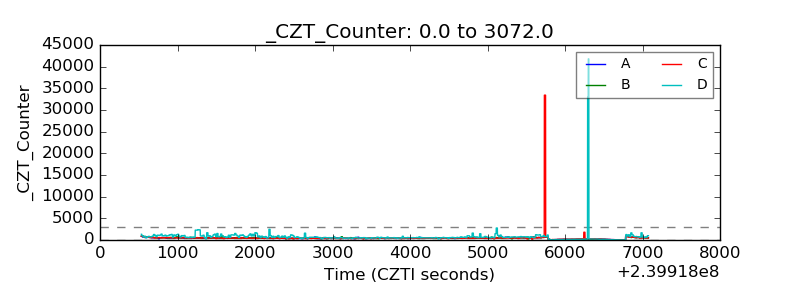 |
| +2.5 Volts monitor |  |
| +5 Volts monitor |  |
| _ROLL_ROT | 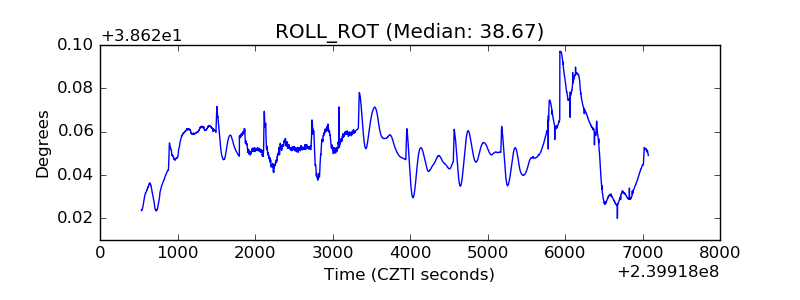 |
| _Roll_DEC | 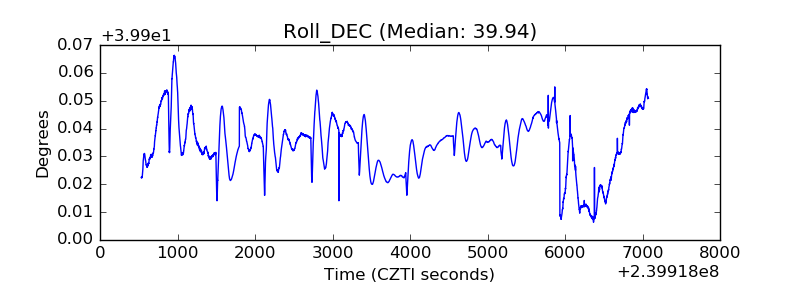 |
| _Roll_RA | 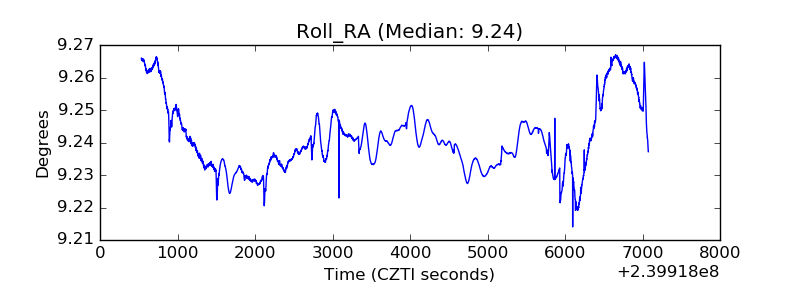 |
| Veto Counter | 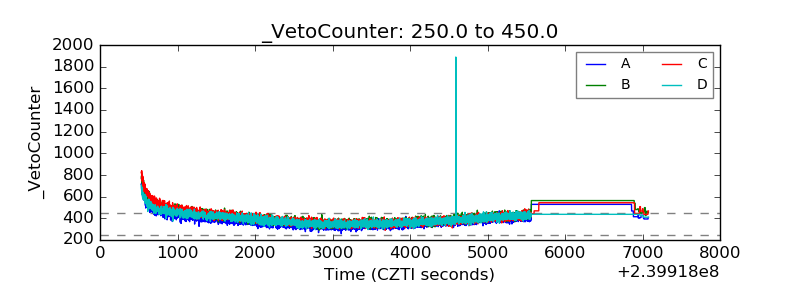 |