| Param | Original file | Final file |
|---|---|---|
| Filename | modeM0/AS1A03_044T03_9000001446_10085cztM0_level2.evt | modeM0/AS1A03_044T03_9000001446_10085cztM0_level2_quad_clean.evt |
| Size (bytes) | 637,997,760 | 125,392,320 |
| Size | 608.4 MB | 119.6 MB |
| Events in quadrant A | 4,126,532 | 805,343 |
| Events in quadrant B | 4,294,001 | 819,177 |
| Events in quadrant C | 3,949,382 | 802,782 |
| Events in quadrant D | 6,358,127 | 762,232 |
| Mode M0 | |||
|---|---|---|---|
| Quadrant | BADHDUFLAG | Total packets | Discarded packets |
| A | 0 | 18314 | 10 |
| B | 0 | 18773 | 6 |
| C | 0 | 18048 | 11 |
| D | 0 | 24903 | 26 |
| Mode SS | |||
|---|---|---|---|
| Quadrant | BADHDUFLAG | Total packets | Discarded packets |
| A | 0 | 178 | 0 |
| B | 0 | 178 | 0 |
| C | 0 | 178 | 0 |
| D | 0 | 178 | 0 |
| Mode M9 | |||
|---|---|---|---|
| Quadrant | BADHDUFLAG | Total packets | Discarded packets |
| A | 0 | 23 | 0 |
| B | 0 | 23 | 0 |
| C | 0 | 23 | 1 |
| D | 0 | 23 | 0 |
| Quadrant | Total seconds | Saturated seconds | Saturation percentage |
|---|---|---|---|
| A | 8767 | 76 | 0.866887% |
| B | 8768 | 96 | 1.094891% |
| C | 8766 | 55 | 0.627424% |
| D | 8762 | 254 | 2.898882% |
Noise dominated data is calculated using 1-second bins in cleaned event files. If a bin has >2000 counts, and if more than 50% of those come from <1% of pixels, then it is considered to be noise-dominated and hence unusable.
| Quadrant | # 1 sec bins | Bins with >0 counts | Bins with >2000 counts | High rate bins dominated by noise | Noise dominated (total time) | Noise dominated (detector-on time) | Marked lightcurve |
|---|---|---|---|---|---|---|---|
| A | 11005 | 8771 | 1 | 1 | 0.01% | 0.01% | 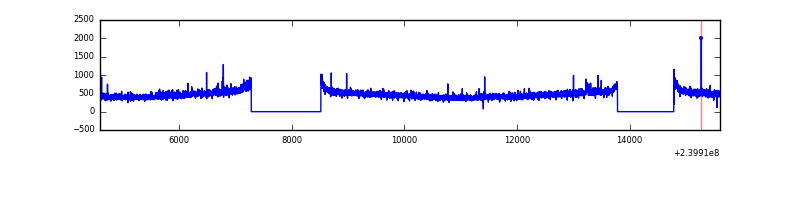 |
| B | 11005 | 8772 | 12 | 12 | 0.11% | 0.14% | 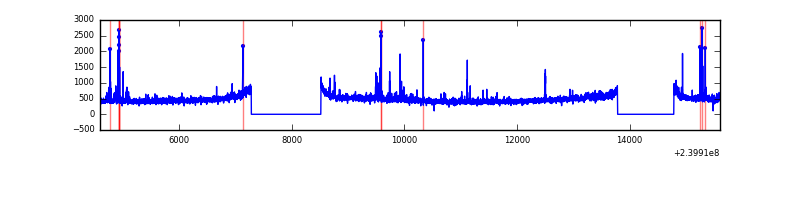 |
| C | 11005 | 8771 | 0 | 0 | 0.00% | 0.00% | 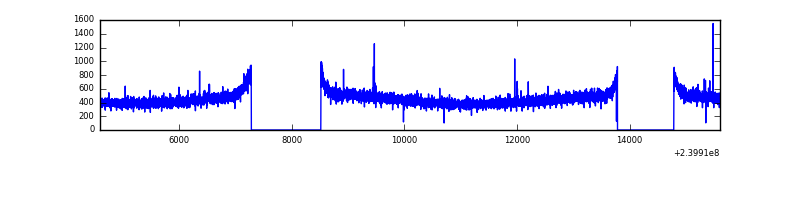 |
| D | 11005 | 8772 | 127 | 127 | 1.15% | 1.45% | 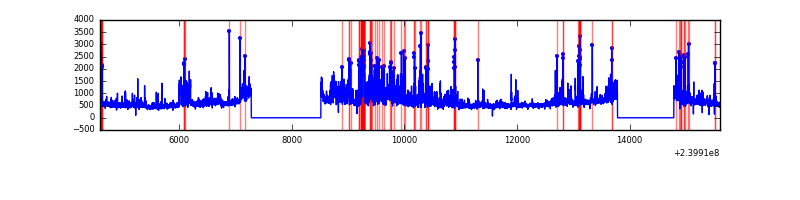 |
Top three noisy pixels from each quadrant. If the there are fewer than three noisy pixels in the level2.evt file, extra rows are filled as -1
| Pixel properties | Quadrant properties | ||||||
|---|---|---|---|---|---|---|---|
| Quadrant | DetID | PixID | Counts | Sigma | Mean | Median | Sigma |
| A | 8 | 15 | 75716 | 358.3 | 1033 | 1011 | 208.5 |
| A | 0 | 8 | 51495 | 242.13 | 1033 | 1011 | 208.5 |
| A | 8 | 5 | 18190 | 82.39 | 1033 | 1011 | 208.5 |
| B | 4 | 81 | 77465 | 386.3 | 1040 | 1014 | 197.9 |
| B | 4 | 239 | 69961 | 348.38 | 1040 | 1014 | 197.9 |
| B | 0 | 214 | 47015 | 232.44 | 1040 | 1014 | 197.9 |
| C | 14 | 234 | 10026 | 38.8 | 1005 | 1008 | 232.4 |
| C | 4 | 239 | 9000 | 34.38 | 1005 | 1008 | 232.4 |
| C | 14 | 67 | 7951 | 29.87 | 1005 | 1008 | 232.4 |
| D | 2 | 16 | 988302 | 3738.32 | 986 | 963 | 264.1 |
| D | 8 | 195 | 736911 | 2786.49 | 986 | 963 | 264.1 |
| D | 2 | 152 | 182093 | 685.8 | 986 | 963 | 264.1 |
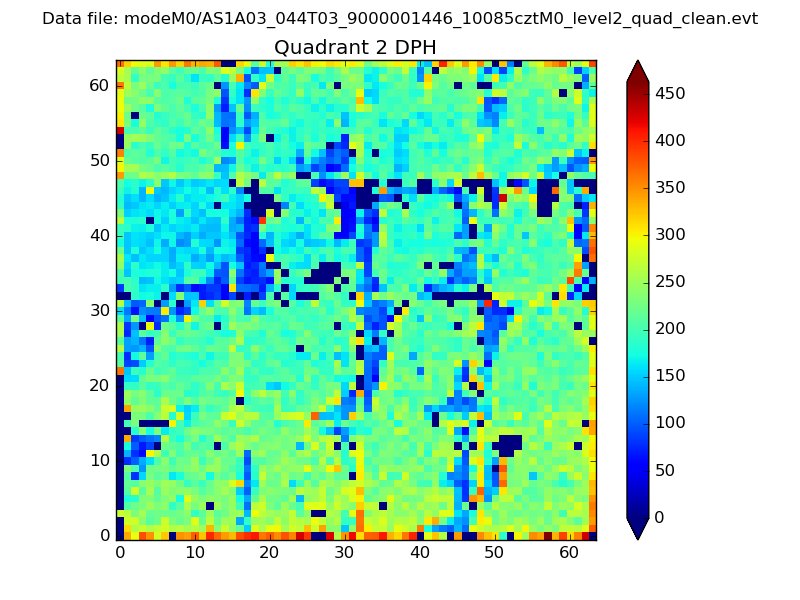
Histogram calculated using DETX and DETY for each event in the final _common_clean file
| Quadrant A | 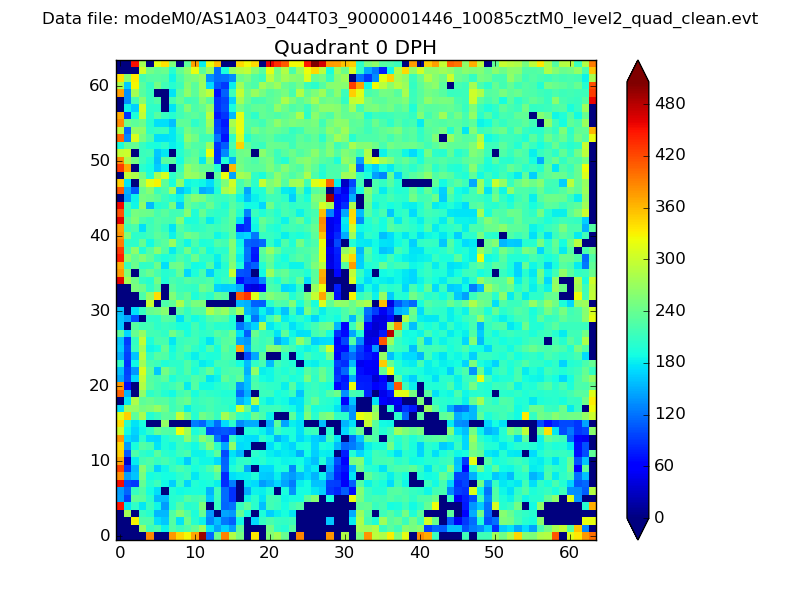 |
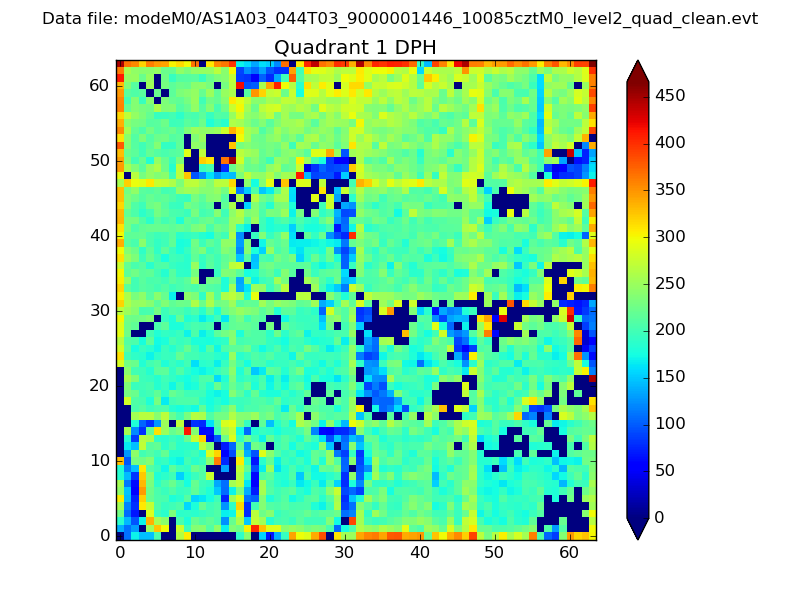 |
Quadrant B |
|---|---|---|---|
| Quadrant D | 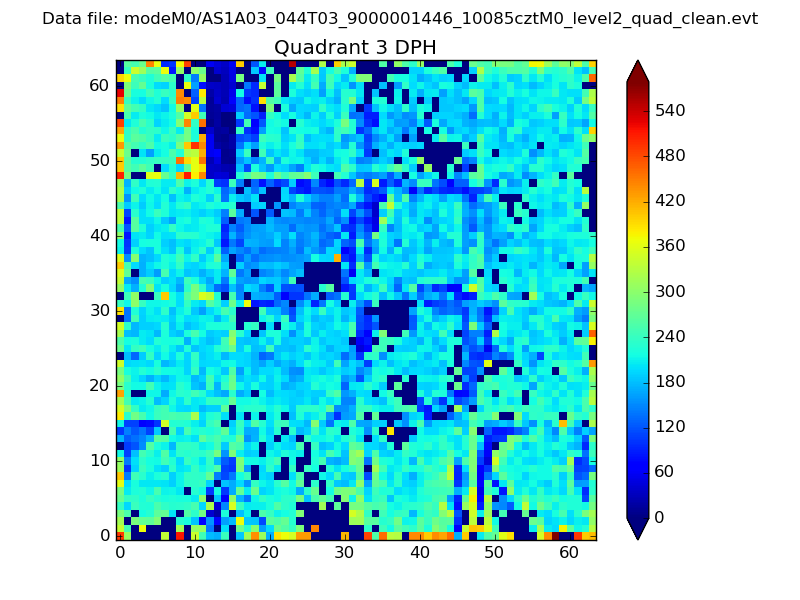 |
 |
Quadrant C |
| Plot type | Count rate plots | Images |
|---|---|---|
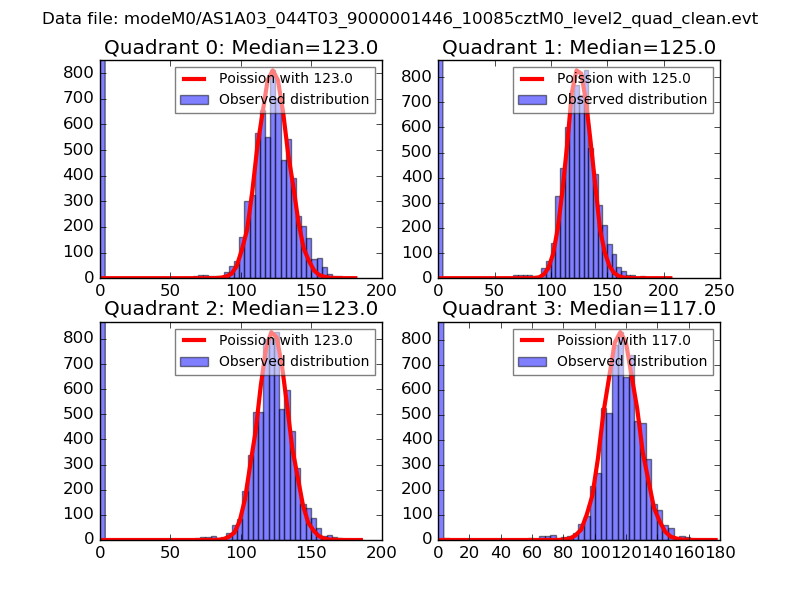
| Comparison with Poisson distribution Blue bars denote a histogram of data divided into 1 sec bins. Red curve is a Poisson curve with rate = median count rate of data. |
 |
 |
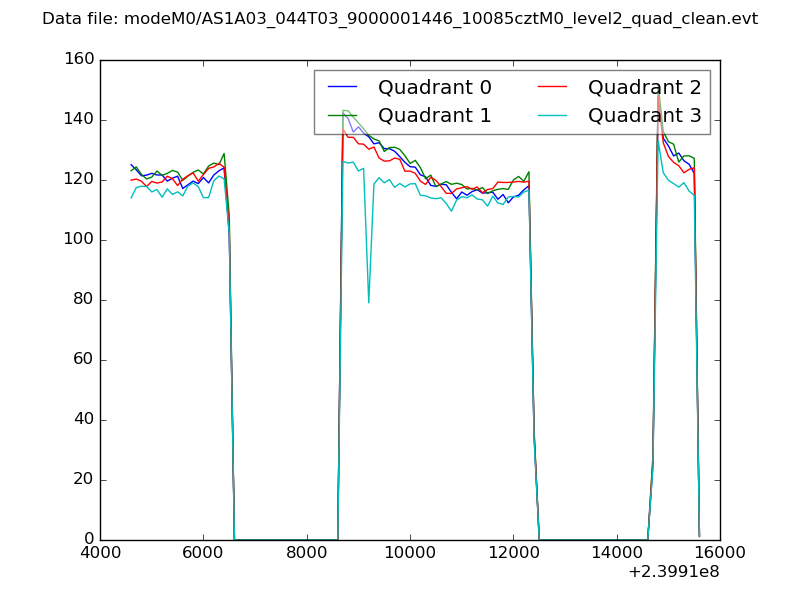
| Quadrant-wise count rates Data is divided into 100 sec bins |
 |
|
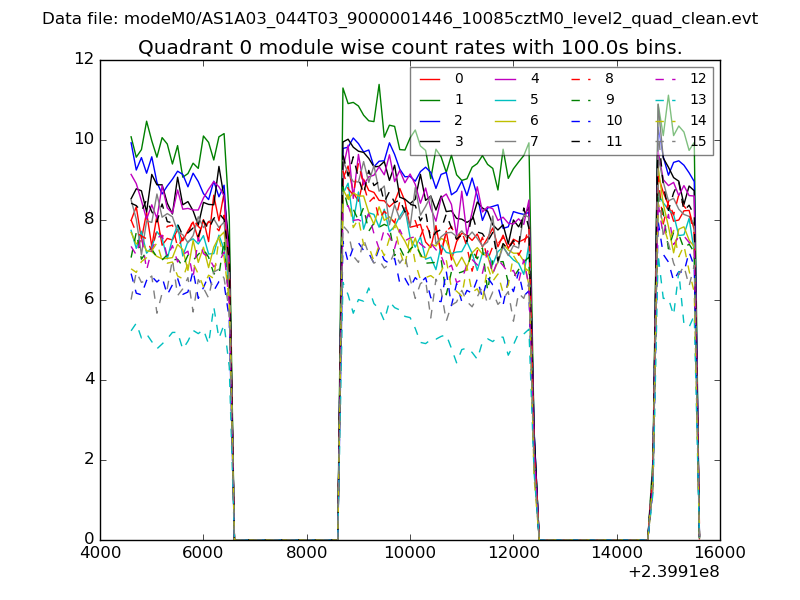
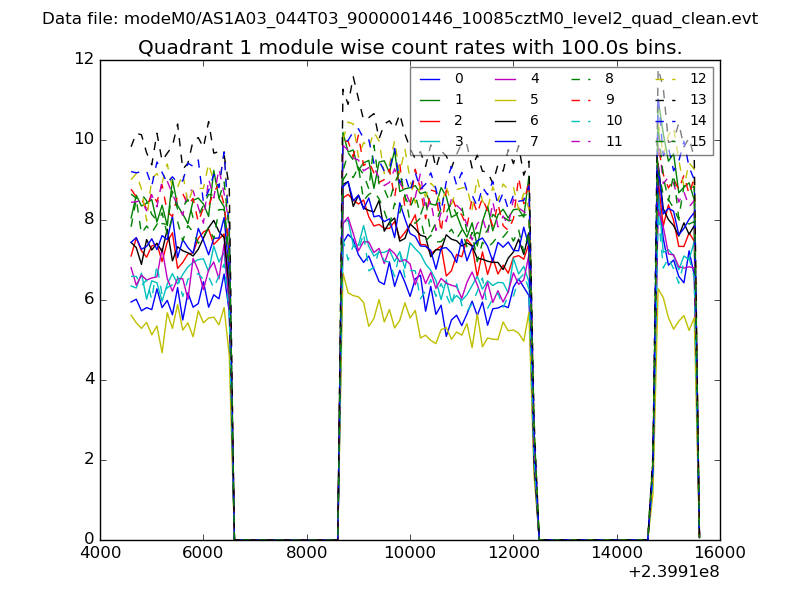
| Module-wise count rates for Quadrant A Data is divided into 100 sec bins |
 |
 |
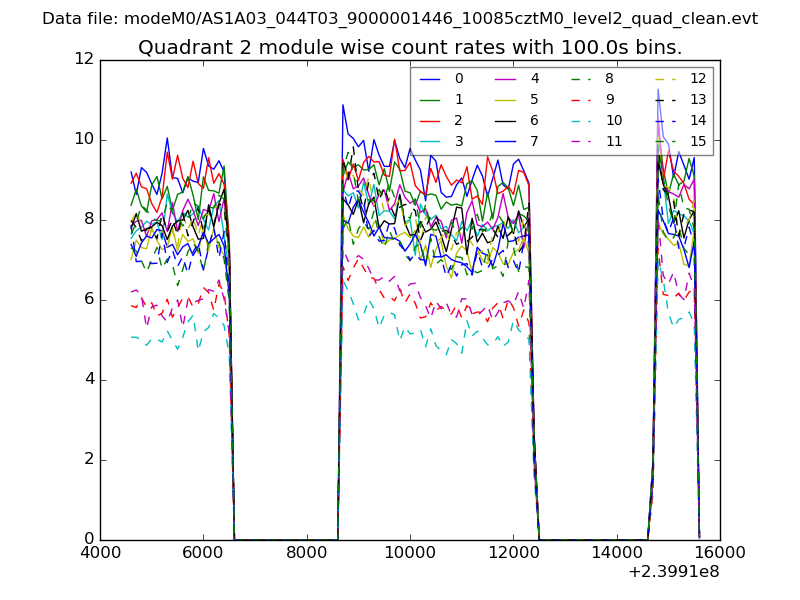
| Module-wise count rates for Quadrant B Data is divided into 100 sec bins |
 |
 |
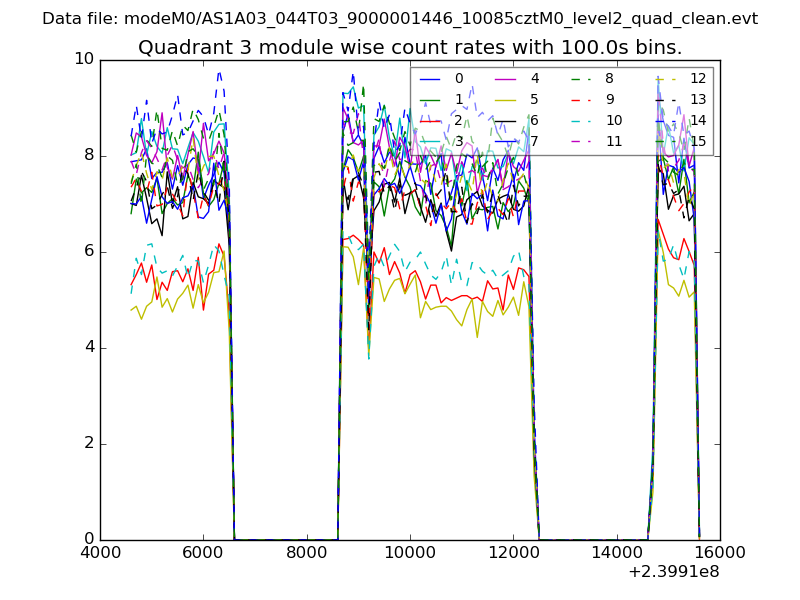
| Module-wise count rates for Quadrant C Data is divided into 100 sec bins |
 |
 |
| Module-wise count rates for Quadrant D Data is divided into 100 sec bins |
 |
 |
| Parameter | Plot |
|---|---|
| CZT HV Monitor | 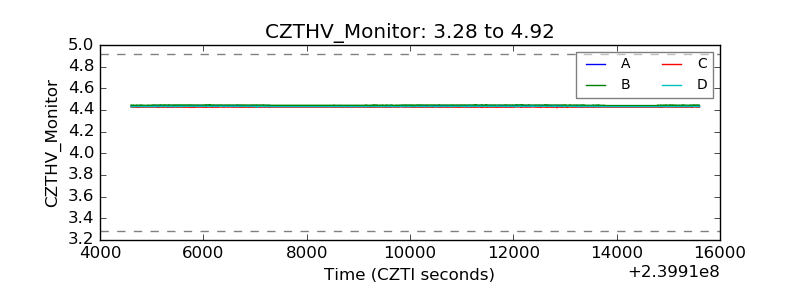 |
| D_VDD | 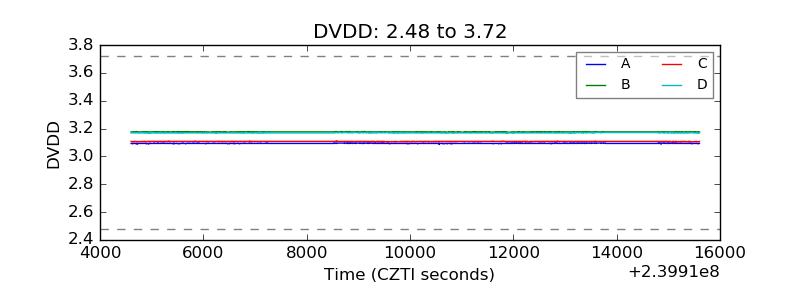 |
| Temperature 1 | 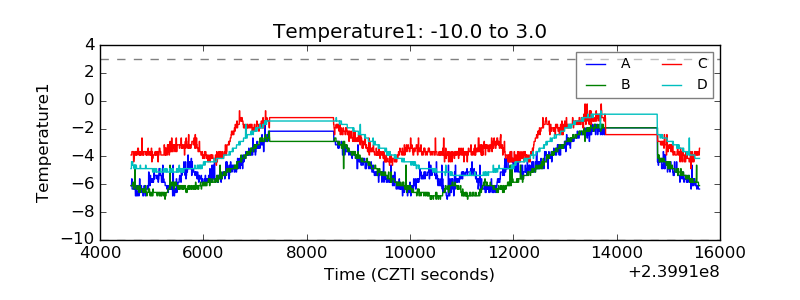 |
| Veto HV Monitor | 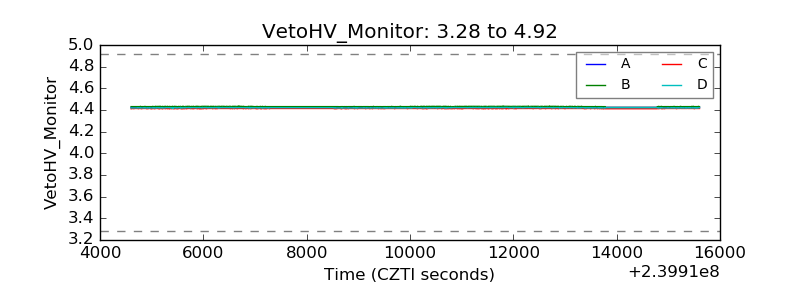 |
| Veto LLD | 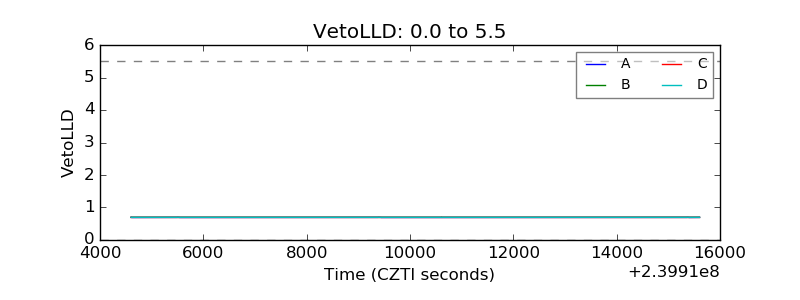 |
| Alpha Counter | 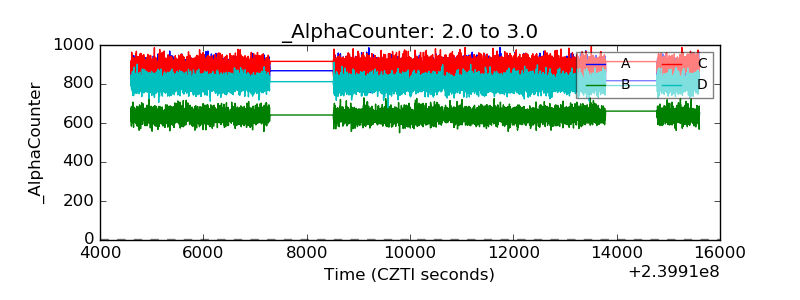 |
| _CPM_Rate | 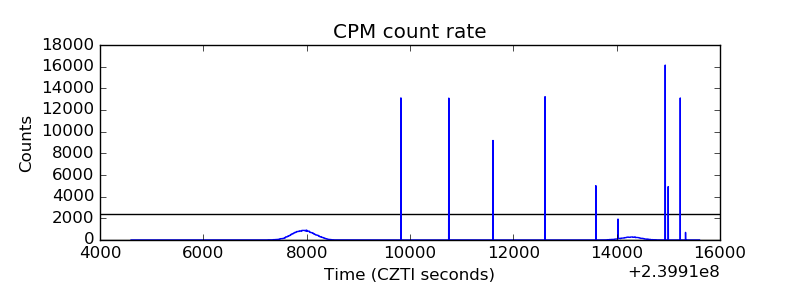 |
| CZT Counter | 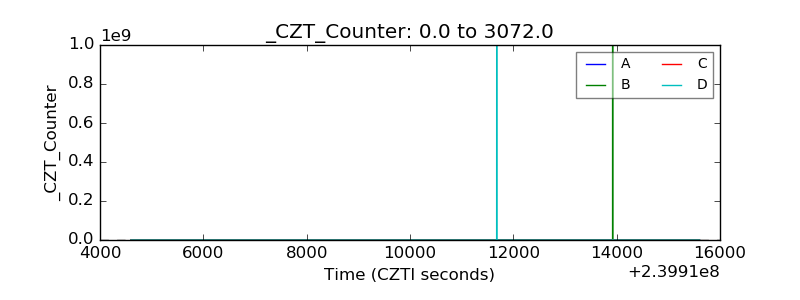 |
| +2.5 Volts monitor | 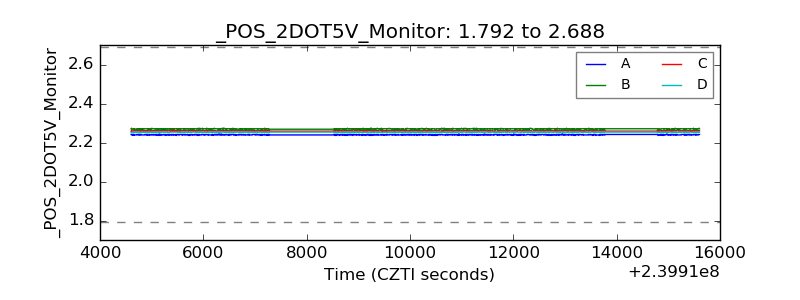 |
| +5 Volts monitor |  |
| _ROLL_ROT | 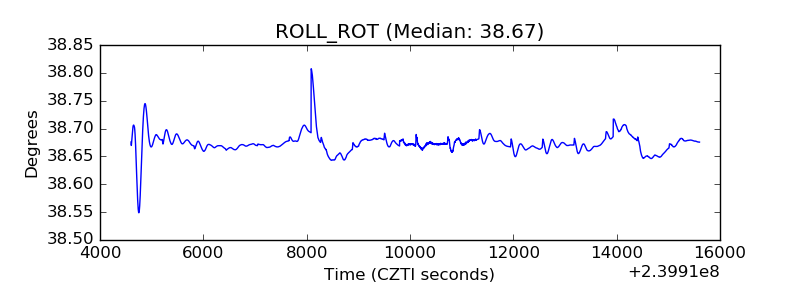 |
| _Roll_DEC | 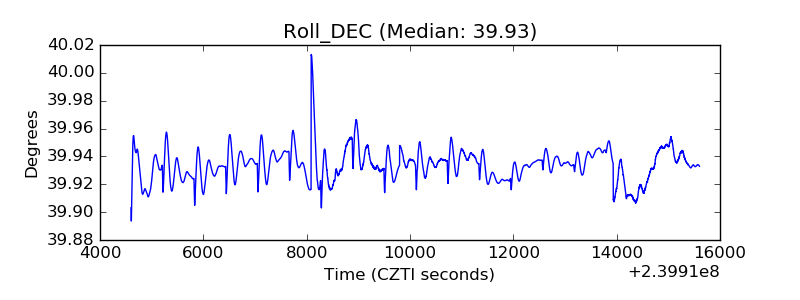 |
| _Roll_RA | 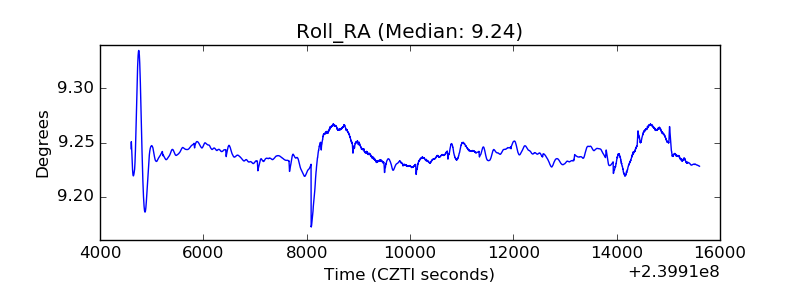 |
| Veto Counter | 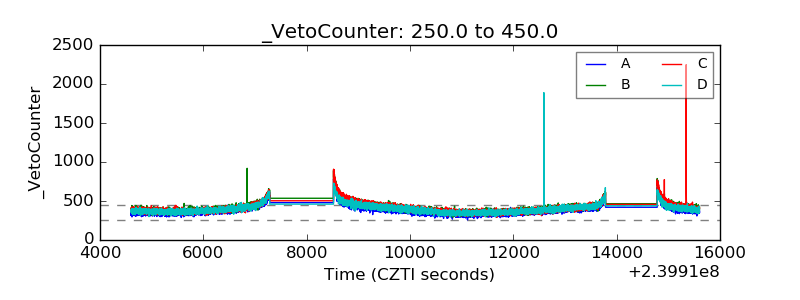 |