| Param | Original file | Final file |
|---|---|---|
| Filename | modeM0/AS1A03_044T04_9000001448cztM0_level2.fits | modeM0/AS1A03_044T04_9000001448cztM0_level2_quad_clean.evt |
| Size (bytes) | 128,194,560 | 125,625,600 |
| Size | 122.3 MB | 119.8 MB |
| Events in quadrant A | 765,213 | 733,847 |
| Events in quadrant B | 738,327 | 744,608 |
| Events in quadrant C | 761,005 | 709,191 |
| Events in quadrant D | 638,050 | 638,671 |
| Mode M0 | |||
|---|---|---|---|
| Quadrant | BADHDUFLAG | Total packets | Discarded packets |
| A | 0 | 29491 | 0 |
| B | 0 | 29617 | 0 |
| C | 0 | 29279 | 0 |
| D | 0 | 32621 | 0 |
| Mode M9 | |||
|---|---|---|---|
| Quadrant | BADHDUFLAG | Total packets | Discarded packets |
| A | 0 | 11 | 0 |
| B | 0 | 8 | 0 |
| C | 0 | 8 | 0 |
| D | 0 | 8 | 0 |
| Mode SS | |||
|---|---|---|---|
| Quadrant | BADHDUFLAG | Total packets | Discarded packets |
| A | 0 | 286 | 0 |
| B | 0 | 262 | 0 |
| C | 0 | 284 | 0 |
| D | 0 | 292 | 0 |
| Quadrant | Total seconds | Saturated seconds | Saturation percentage |
|---|---|---|---|
| A | 14222 | 132 | 0.928140% |
| B | 14193 | 157 | 1.106179% |
| C | 14317 | 63 | 0.440036% |
| D | 13896 | 194 | 1.396085% |
Noise dominated data is calculated using 1-second bins in cleaned event files. If a bin has >2000 counts, and if more than 50% of those come from <1% of pixels, then it is considered to be noise-dominated and hence unusable.
| Quadrant | # 1 sec bins | Bins with >0 counts | Bins with >2000 counts | High rate bins dominated by noise | Noise dominated (total time) | Noise dominated (detector-on time) | Marked lightcurve |
|---|---|---|---|---|---|---|---|
| A | 23142 | 16148 | 0 | 0 | 0.00% | 0.00% |  |
| B | 23142 | 16221 | 0 | 0 | 0.00% | 0.00% |  |
| C | 23142 | 16317 | 0 | 0 | 0.00% | 0.00% |  |
| D | 23142 | 15949 | 0 | 0 | 0.00% | 0.00% |  |
Top three noisy pixels from each quadrant. If the there are fewer than three noisy pixels in the level2.evt file, extra rows are filled as -1
| Pixel properties | Quadrant properties | ||||||
|---|---|---|---|---|---|---|---|
| Quadrant | DetID | PixID | Counts | Sigma | Mean | Median | Sigma |
| A | 14 | 188 | 756 | 11.1 | 198 | 185 | 51.5 |
| A | 0 | 29 | 724 | 10.47 | 198 | 185 | 51.5 |
| A | 14 | 204 | 640 | 8.84 | 198 | 185 | 51.5 |
| B | 2 | 9 | 666 | 11.44 | 194 | 184 | 42.1 |
| B | 5 | 128 | 503 | 7.57 | 194 | 184 | 42.1 |
| B | 2 | 8 | 494 | 7.36 | 194 | 184 | 42.1 |
| C | 1 | 80 | 580 | 7.22 | 200 | 185 | 54.7 |
| C | 12 | 241 | 563 | 6.9 | 200 | 185 | 54.7 |
| C | 1 | 81 | 539 | 6.47 | 200 | 185 | 54.7 |
| D | 4 | 246 | 534 | 7.25 | 181 | 164 | 51.0 |
| D | 3 | 31 | 500 | 6.59 | 181 | 164 | 51.0 |
| D | 3 | 14 | 478 | 6.15 | 181 | 164 | 51.0 |
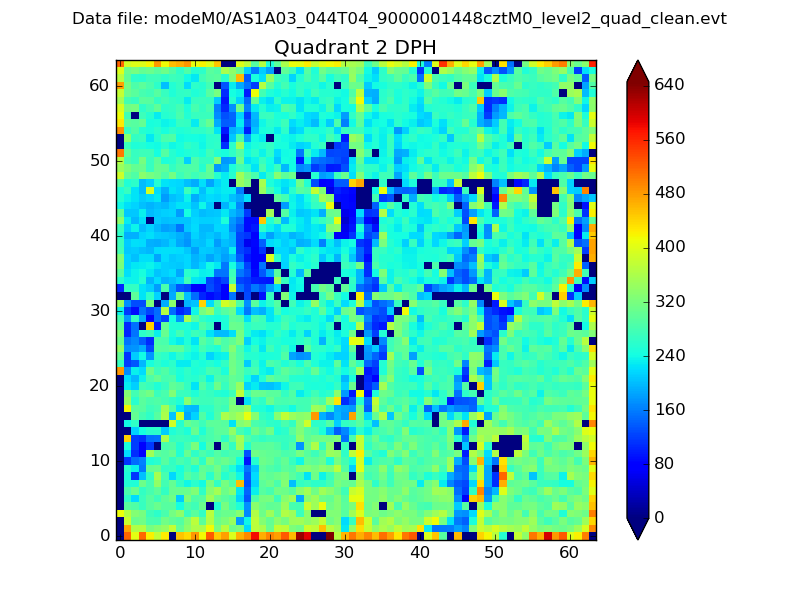
Histogram calculated using DETX and DETY for each event in the final _common_clean file
| Quadrant A |  |
 |
Quadrant B |
|---|---|---|---|
| Quadrant D |  |
 |
Quadrant C |
| Plot type | Count rate plots | Images |
|---|---|---|
| Comparison with Poisson distribution Blue bars denote a histogram of data divided into 1 sec bins. Red curve is a Poisson curve with rate = median count rate of data. |
 |
 |
| Quadrant-wise count rates Data is divided into 100 sec bins |
 |
|
| Module-wise count rates for Quadrant A Data is divided into 100 sec bins |
 |
 |
| Module-wise count rates for Quadrant B Data is divided into 100 sec bins |
 |
 |
| Module-wise count rates for Quadrant C Data is divided into 100 sec bins |
 |
 |
| Module-wise count rates for Quadrant D Data is divided into 100 sec bins |
 |
 |
| Parameter | Plot |
|---|---|
| CZT HV Monitor |  |
| D_VDD |  |
| Temperature 1 |  |
| Veto HV Monitor |  |
| Veto LLD |  |
| Alpha Counter |  |
| _CPM_Rate |  |
| CZT Counter |  |
| +2.5 Volts monitor |  |
| +5 Volts monitor |  |
| _ROLL_ROT |  |
| _Roll_DEC |  |
| _Roll_RA |  |
| Veto Counter |  |