| Param | Original file | Final file |
|---|---|---|
| Filename | modeM0/AS1A03_044T04_9000001448_10076cztM0_level2.evt | modeM0/AS1A03_044T04_9000001448_10076cztM0_level2_quad_clean.evt |
| Size (bytes) | 14,664,960 | 4,095,360 |
| Size | 14.0 MB | 3.9 MB |
| Events in quadrant A | 87,995 | 25,500 |
| Events in quadrant B | 94,668 | 25,582 |
| Events in quadrant C | 90,961 | 25,059 |
| Events in quadrant D | 152,297 | 24,060 |
| Mode M0 | |||
|---|---|---|---|
| Quadrant | BADHDUFLAG | Total packets | Discarded packets |
| A | 0 | 439 | 19 |
| B | 0 | 441 | 12 |
| C | 0 | 438 | 14 |
| D | 0 | 627 | 23 |
| Mode SS | |||
|---|---|---|---|
| Quadrant | BADHDUFLAG | Total packets | Discarded packets |
| A | 0 | 4 | 0 |
| B | 0 | 4 | 0 |
| C | 0 | 4 | 0 |
| D | 0 | 4 | 0 |
| Quadrant | Total seconds | Saturated seconds | Saturation percentage |
|---|---|---|---|
| A | 210 | 0 | 0.000000% |
| B | 213 | 0 | 0.000000% |
| C | 212 | 0 | 0.000000% |
| D | 212 | 0 | 0.000000% |
Noise dominated data is calculated using 1-second bins in cleaned event files. If a bin has >2000 counts, and if more than 50% of those come from <1% of pixels, then it is considered to be noise-dominated and hence unusable.
| Quadrant | # 1 sec bins | Bins with >0 counts | Bins with >2000 counts | High rate bins dominated by noise | Noise dominated (total time) | Noise dominated (detector-on time) | Marked lightcurve |
|---|---|---|---|---|---|---|---|
| A | 218 | 218 | 0 | 0 | 0.00% | 0.00% | 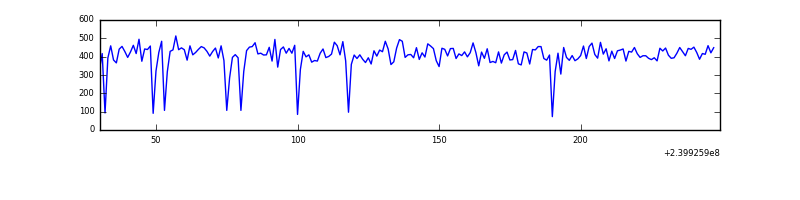 |
| B | 219 | 219 | 0 | 0 | 0.00% | 0.00% | 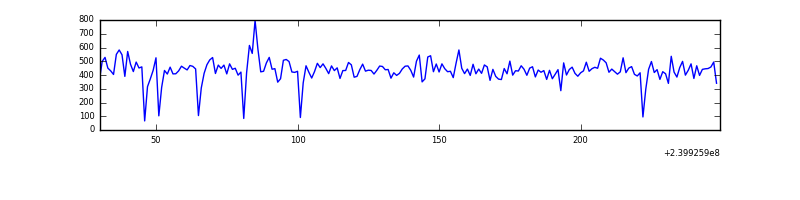 |
| C | 219 | 219 | 0 | 0 | 0.00% | 0.00% | 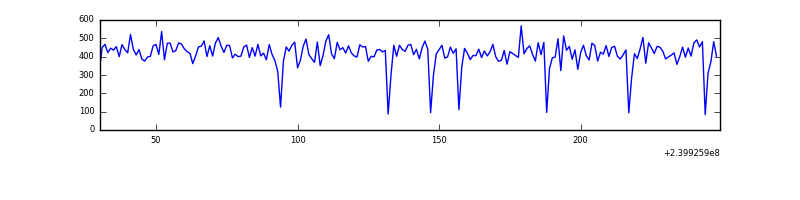 |
| D | 219 | 219 | 0 | 0 | 0.00% | 0.00% | 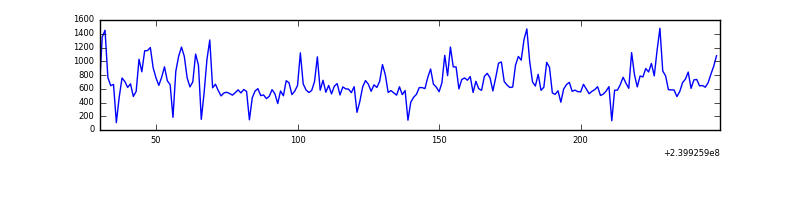 |
Top three noisy pixels from each quadrant. If the there are fewer than three noisy pixels in the level2.evt file, extra rows are filled as -1
| Pixel properties | Quadrant properties | ||||||
|---|---|---|---|---|---|---|---|
| Quadrant | DetID | PixID | Counts | Sigma | Mean | Median | Sigma |
| A | 8 | 15 | 440 | 62.16 | 22 | 22 | 6.7 |
| A | 0 | 226 | 189 | 24.83 | 22 | 22 | 6.7 |
| A | 12 | 194 | 175 | 22.75 | 22 | 22 | 6.7 |
| B | 0 | 197 | 1116 | 160.96 | 23 | 22 | 6.8 |
| B | 0 | 219 | 583 | 82.54 | 23 | 22 | 6.8 |
| B | 12 | 111 | 483 | 67.83 | 23 | 22 | 6.8 |
| C | 13 | 61 | 182 | 21.46 | 23 | 23 | 7.4 |
| C | 14 | 67 | 171 | 19.98 | 23 | 23 | 7.4 |
| C | -1 | -1 | -1 | -1.0 | 23 | 23 | 7.4 |
| D | 10 | 199 | 26379 | 3590.87 | 22 | 21 | 7.3 |
| D | 8 | 195 | 19058 | 2593.49 | 22 | 21 | 7.3 |
| D | 2 | 16 | 14734 | 2004.42 | 22 | 21 | 7.3 |
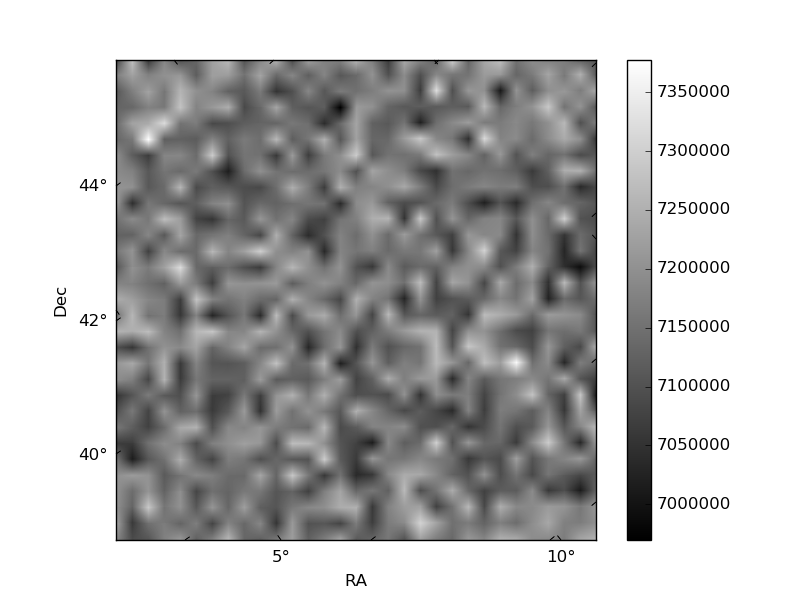
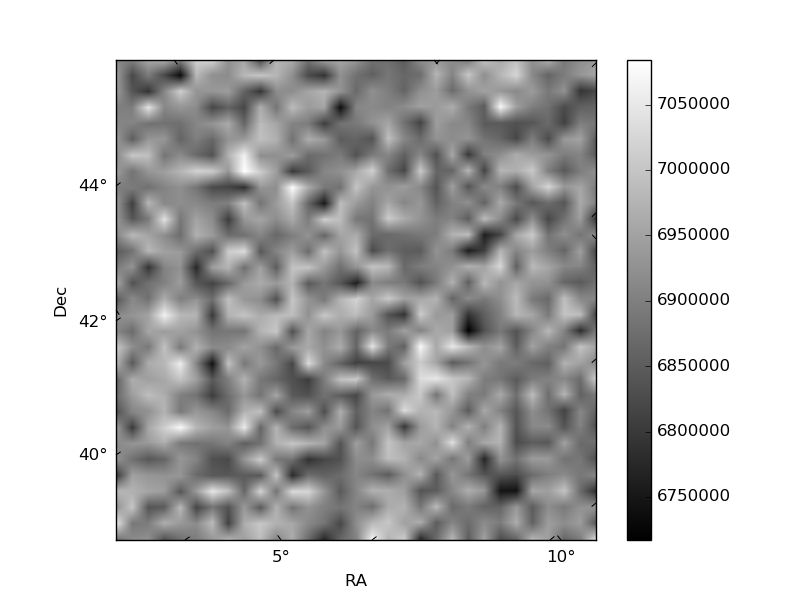
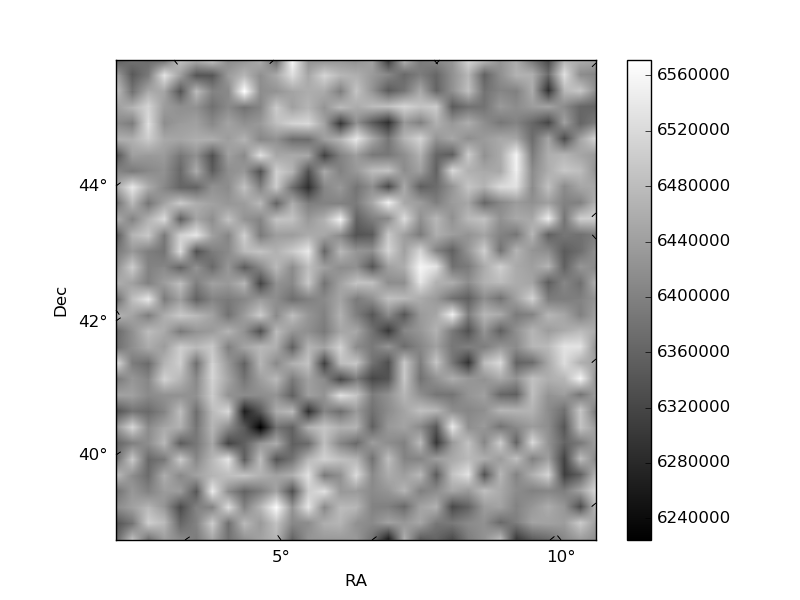
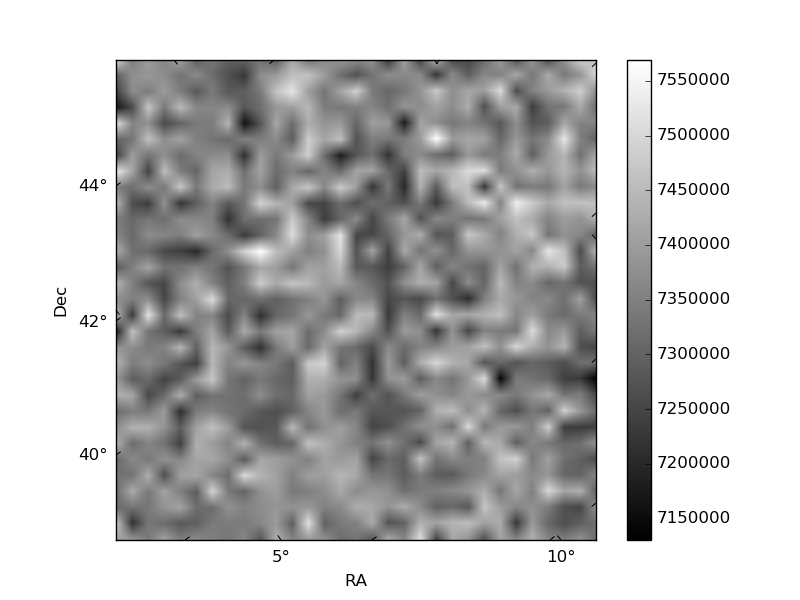
Histogram calculated using DETX and DETY for each event in the final _common_clean file
| Quadrant A | 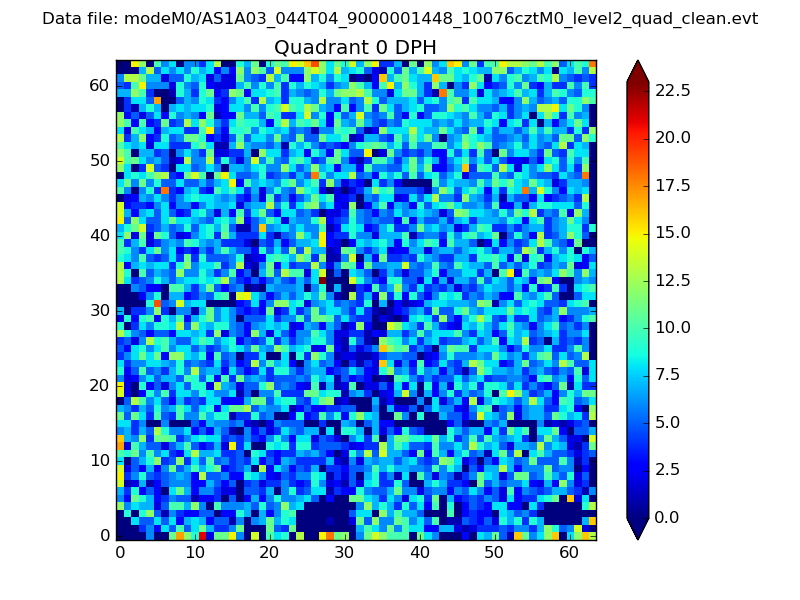 |
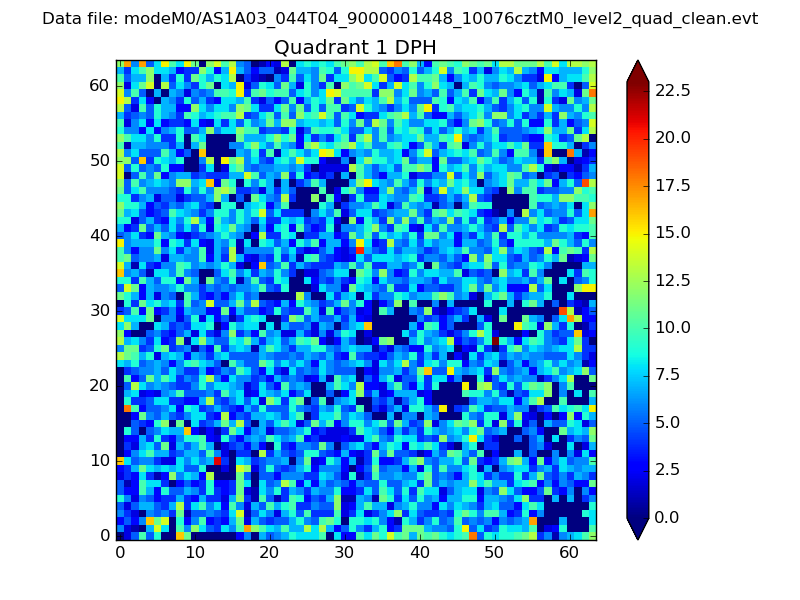 |
Quadrant B |
|---|---|---|---|
| Quadrant D | 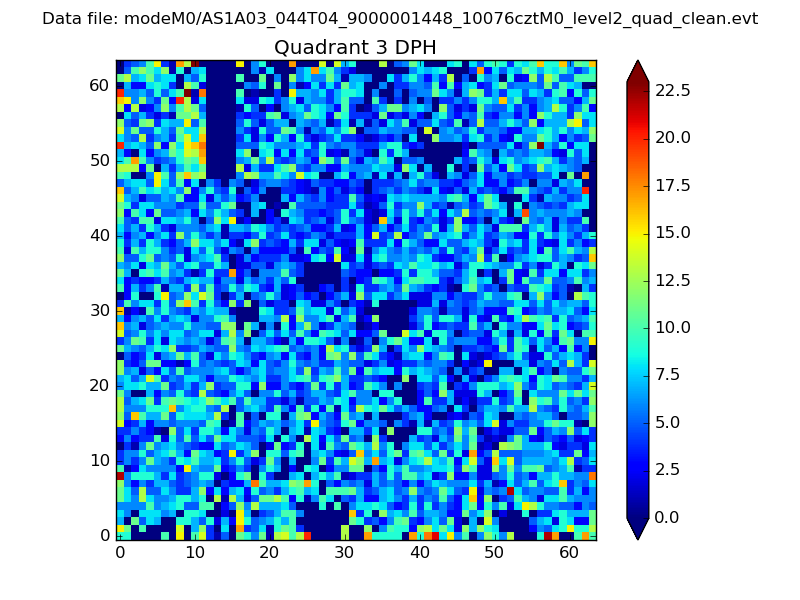 |
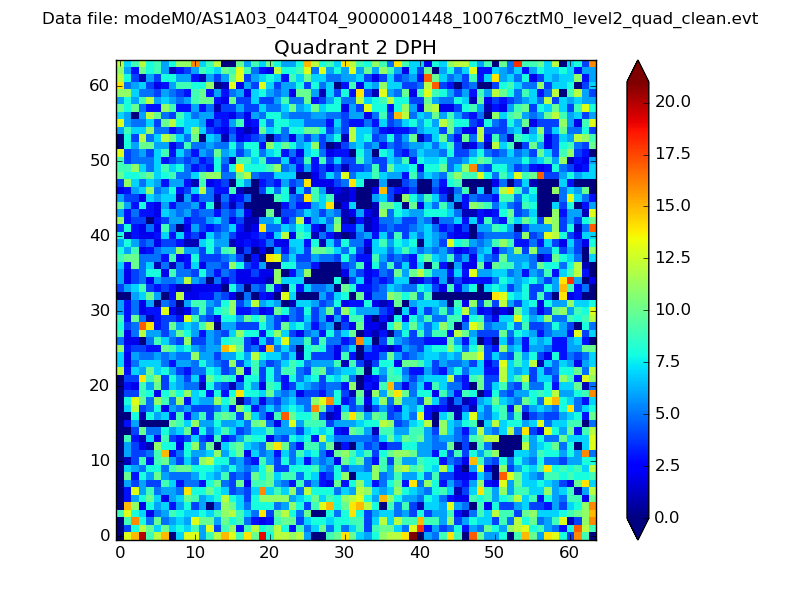 |
Quadrant C |
| Plot type | Count rate plots | Images |
|---|---|---|
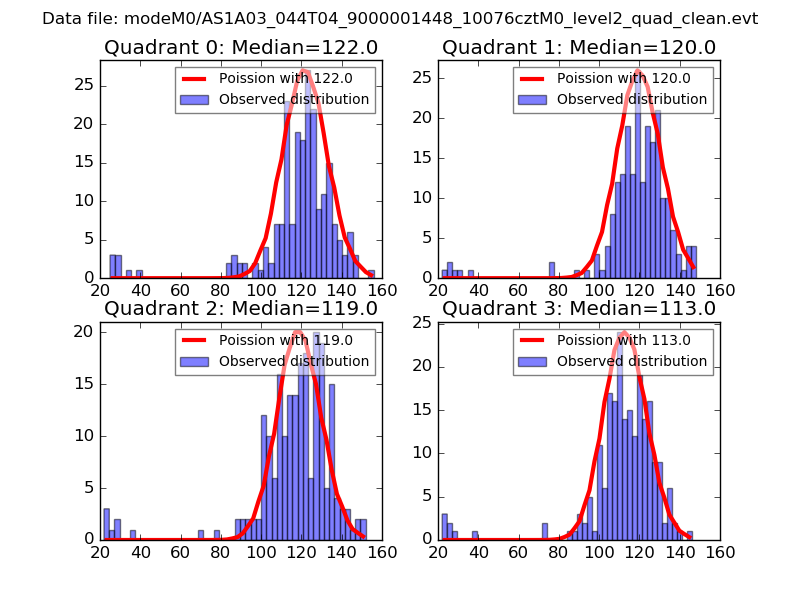
| Comparison with Poisson distribution Blue bars denote a histogram of data divided into 1 sec bins. Red curve is a Poisson curve with rate = median count rate of data. |
 |
 |
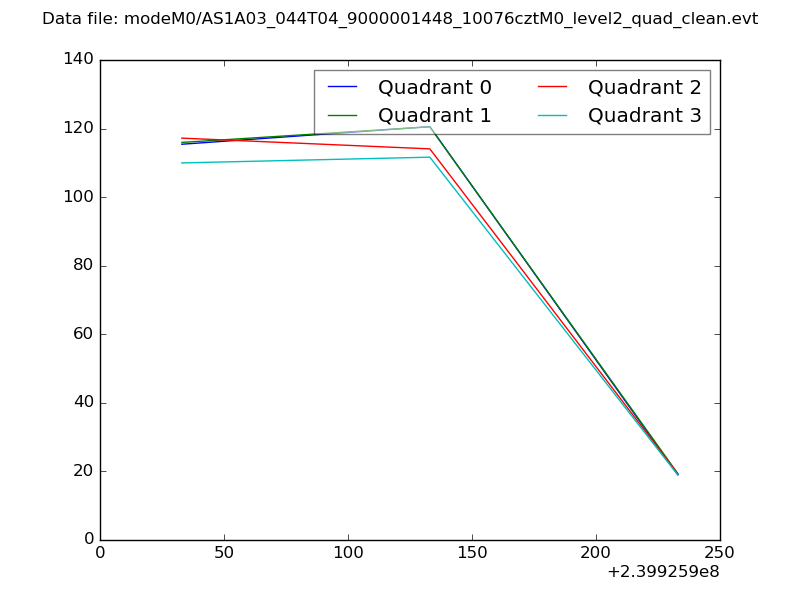
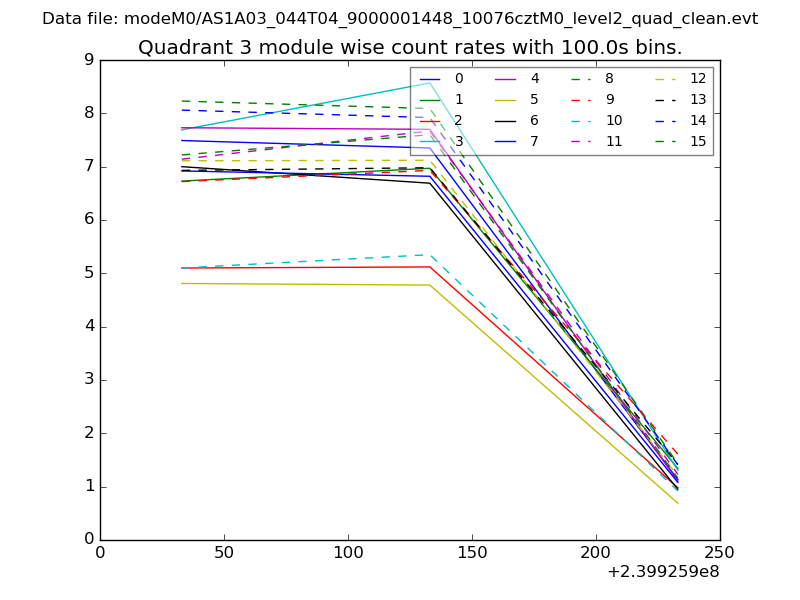
| Quadrant-wise count rates Data is divided into 100 sec bins |
 |
|
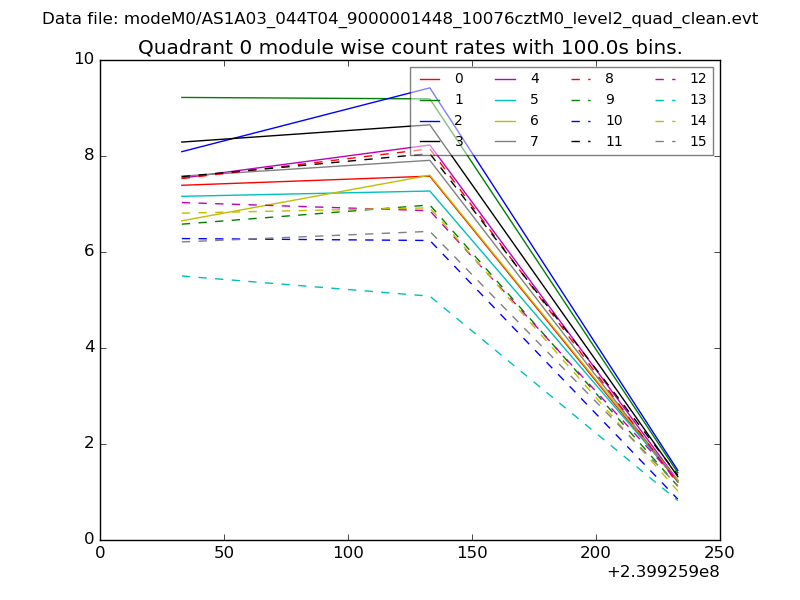
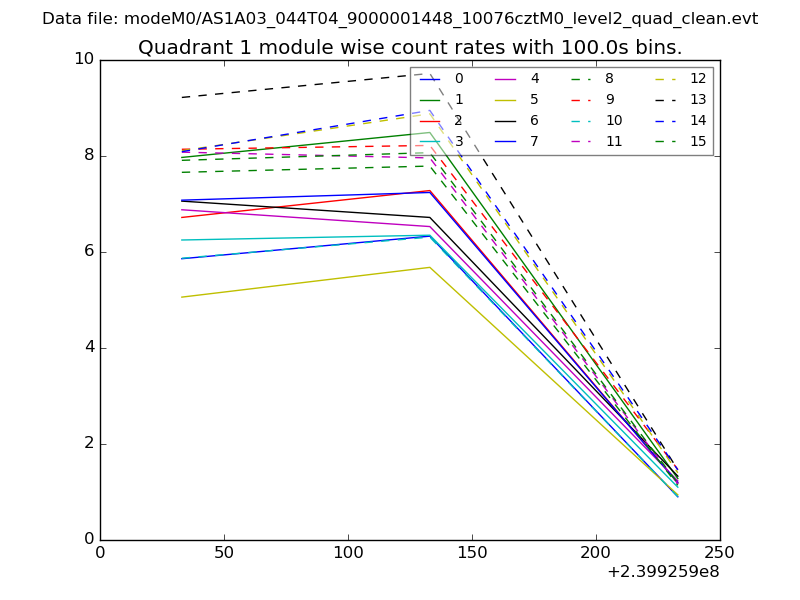
| Module-wise count rates for Quadrant A Data is divided into 100 sec bins |
 |
 |
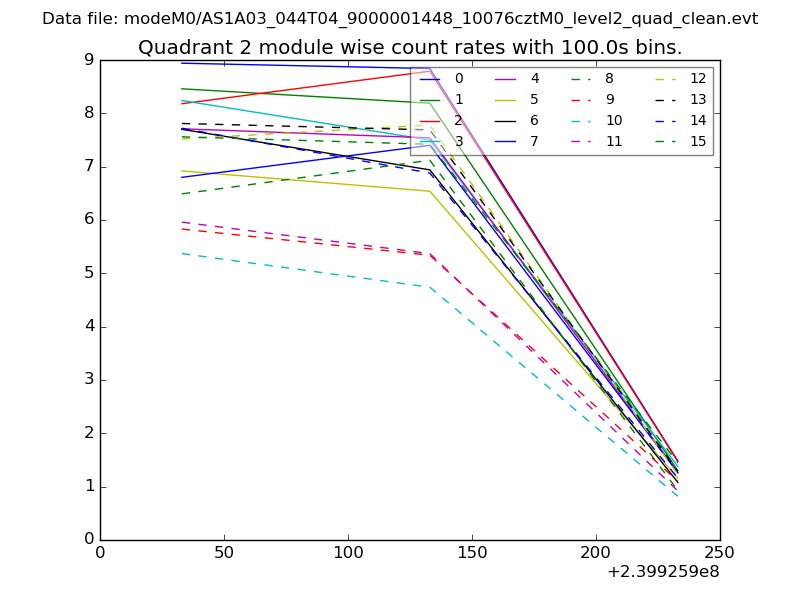
| Module-wise count rates for Quadrant B Data is divided into 100 sec bins |
 |
 |
| Module-wise count rates for Quadrant C Data is divided into 100 sec bins |
 |
 |
| Module-wise count rates for Quadrant D Data is divided into 100 sec bins |
 |
 |
| Parameter | Plot |
|---|---|
| CZT HV Monitor | 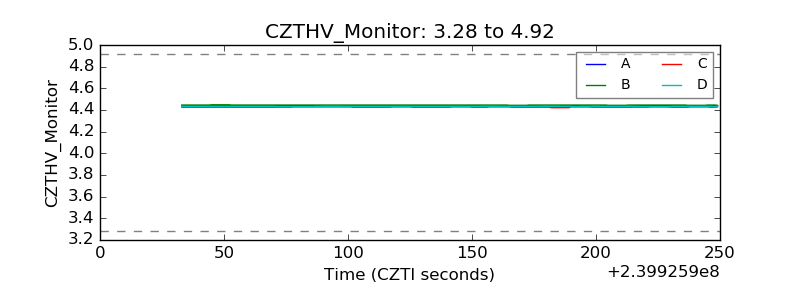 |
| D_VDD | 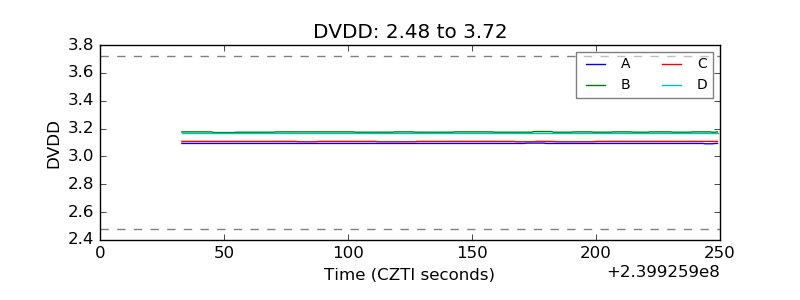 |
| Temperature 1 | 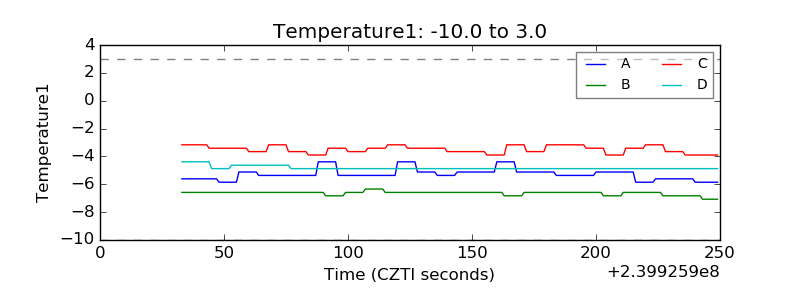 |
| Veto HV Monitor | 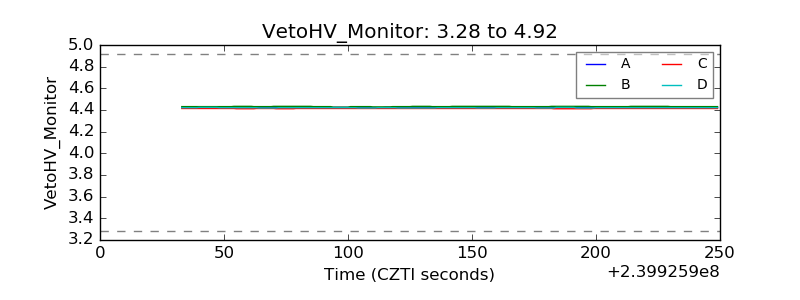 |
| Veto LLD | 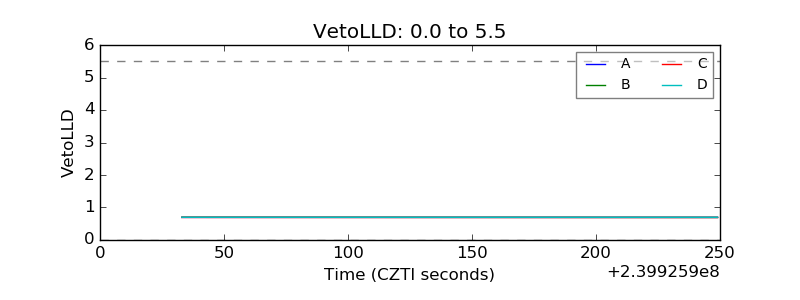 |
| Alpha Counter | 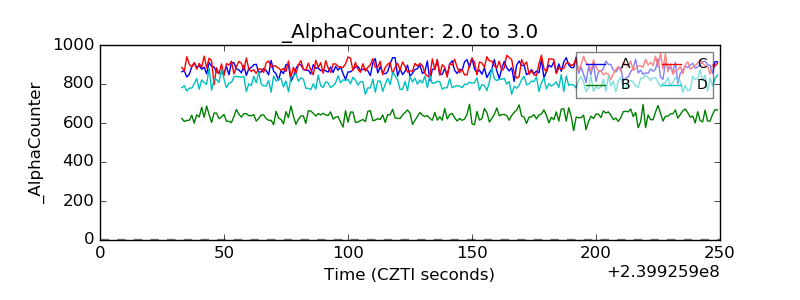 |
| _CPM_Rate | 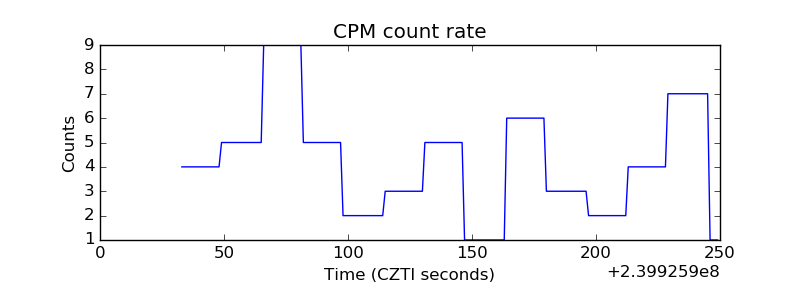 |
| CZT Counter | 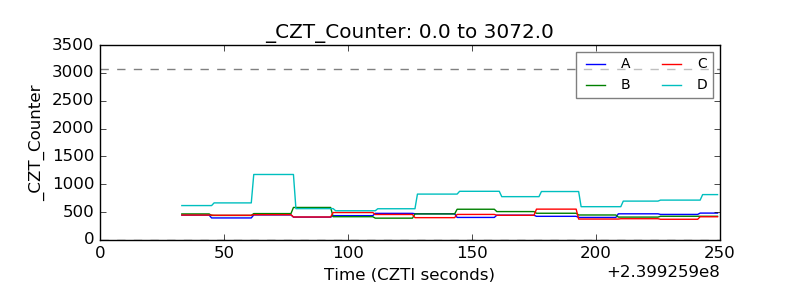 |
| +2.5 Volts monitor |  |
| +5 Volts monitor | 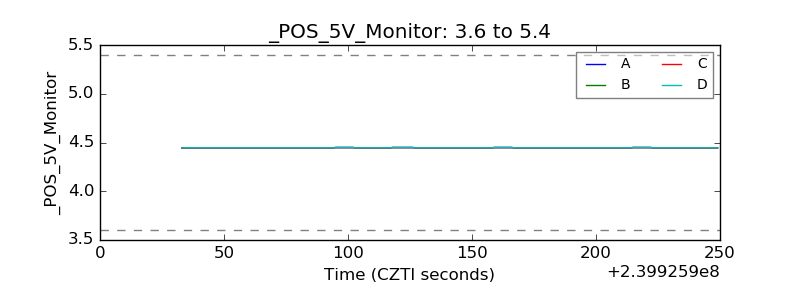 |
| _ROLL_ROT | 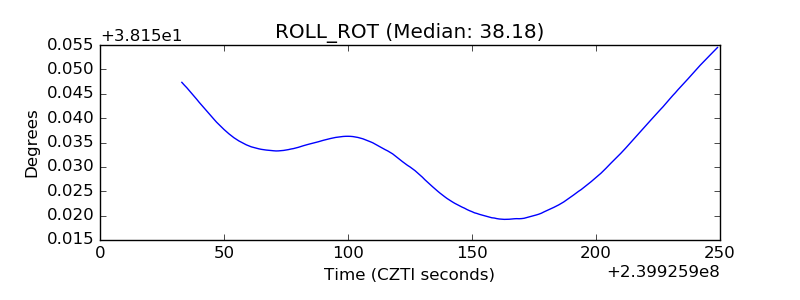 |
| _Roll_DEC | 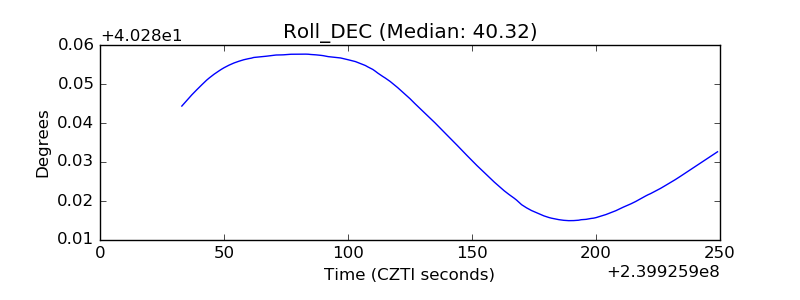 |
| _Roll_RA | 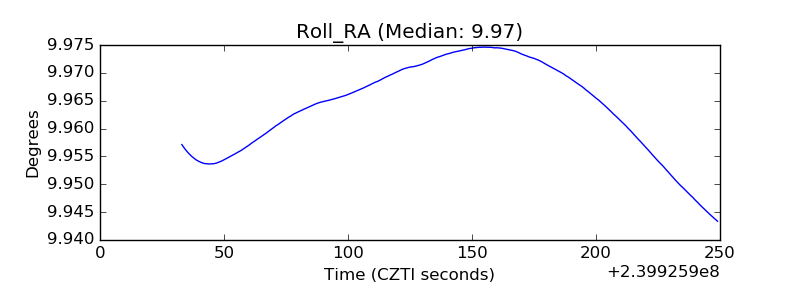 |
| Veto Counter | 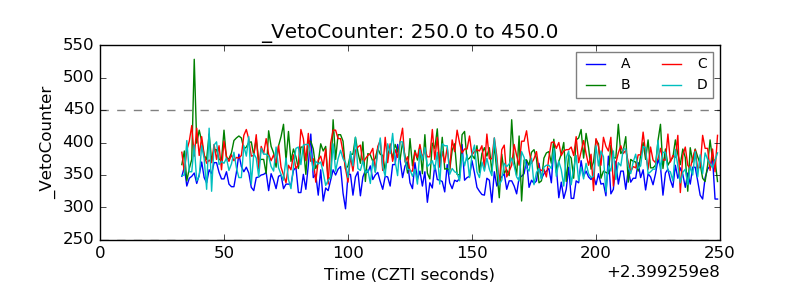 |