| Param | Original file | Final file |
|---|---|---|
| Filename | modeM0/AS1A03_044T04_9000001448_10078cztM0_level2.evt | modeM0/AS1A03_044T04_9000001448_10078cztM0_level2_quad_clean.evt |
| Size (bytes) | 38,030,400 | 8,665,920 |
| Size | 36.3 MB | 8.3 MB |
| Events in quadrant A | 276,396 | 53,935 |
| Events in quadrant B | 280,676 | 57,742 |
| Events in quadrant C | 264,527 | 54,248 |
| Events in quadrant D | 285,070 | 45,851 |
| Mode M0 | |||
|---|---|---|---|
| Quadrant | BADHDUFLAG | Total packets | Discarded packets |
| A | 0 | 15913 | 14644 |
| B | 0 | 16039 | 14768 |
| C | 0 | 15480 | 14232 |
| D | 0 | 18198 | 17013 |
| Mode M9 | |||
|---|---|---|---|
| Quadrant | BADHDUFLAG | Total packets | Discarded packets |
| A | 0 | 9 | 6 |
| B | 0 | 8 | 4 |
| C | 0 | 9 | 7 |
| D | 0 | 9 | 9 |
| Mode SS | |||
|---|---|---|---|
| Quadrant | BADHDUFLAG | Total packets | Discarded packets |
| A | 0 | 152 | 138 |
| B | 0 | 150 | 135 |
| C | 0 | 153 | 145 |
| D | 0 | 155 | 143 |
| Quadrant | Total seconds | Saturated seconds | Saturation percentage |
|---|---|---|---|
| A | 617 | 3 | 0.486224% |
| B | 618 | 8 | 1.294498% |
| C | 619 | 0 | 0.000000% |
| D | 550 | 2 | 0.363636% |
Noise dominated data is calculated using 1-second bins in cleaned event files. If a bin has >2000 counts, and if more than 50% of those come from <1% of pixels, then it is considered to be noise-dominated and hence unusable.
| Quadrant | # 1 sec bins | Bins with >0 counts | Bins with >2000 counts | High rate bins dominated by noise | Noise dominated (total time) | Noise dominated (detector-on time) | Marked lightcurve |
|---|---|---|---|---|---|---|---|
| A | 7527 | 1094 | 0 | 0 | 0.00% | 0.00% | 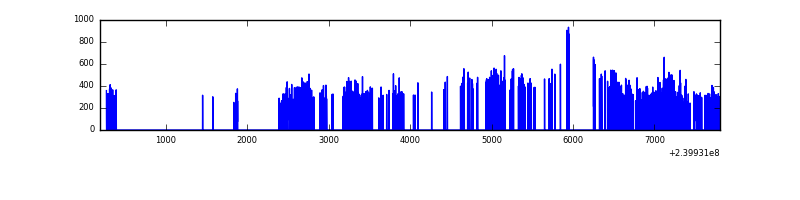 |
| B | 7536 | 1114 | 0 | 0 | 0.00% | 0.00% | 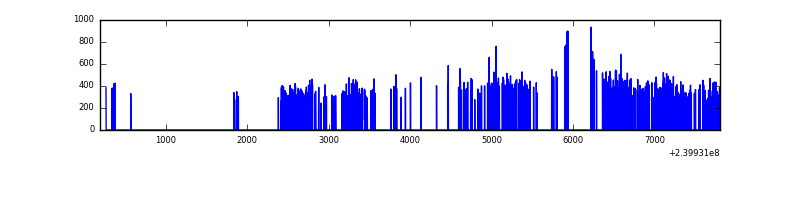 |
| C | 7609 | 1103 | 0 | 0 | 0.00% | 0.00% | 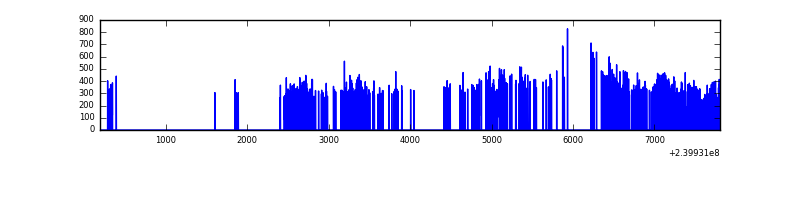 |
| D | 7507 | 980 | 0 | 0 | 0.00% | 0.00% | 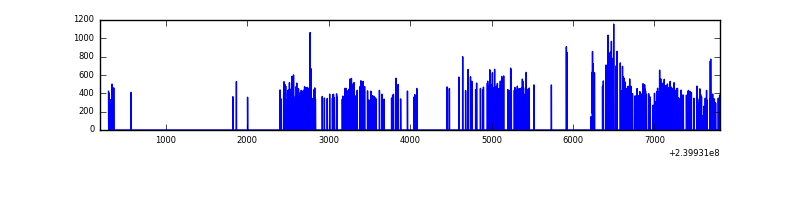 |
Top three noisy pixels from each quadrant. If the there are fewer than three noisy pixels in the level2.evt file, extra rows are filled as -1
| Pixel properties | Quadrant properties | ||||||
|---|---|---|---|---|---|---|---|
| Quadrant | DetID | PixID | Counts | Sigma | Mean | Median | Sigma |
| A | 0 | 8 | 9513 | 591.11 | 68 | 67 | 16.0 |
| A | 8 | 15 | 1432 | 85.42 | 68 | 67 | 16.0 |
| A | 13 | 253 | 1014 | 59.26 | 68 | 67 | 16.0 |
| B | 0 | 214 | 1592 | 94.1 | 70 | 68 | 16.2 |
| B | 12 | 111 | 1559 | 92.06 | 70 | 68 | 16.2 |
| B | 4 | 239 | 1538 | 90.77 | 70 | 68 | 16.2 |
| C | 13 | 61 | 526 | 25.59 | 67 | 67 | 17.9 |
| C | 14 | 67 | 516 | 25.03 | 67 | 67 | 17.9 |
| C | 8 | 222 | 402 | 18.68 | 67 | 67 | 17.9 |
| D | 8 | 195 | 32013 | 1888.56 | 58 | 56 | 16.9 |
| D | 2 | 152 | 11693 | 687.71 | 58 | 56 | 16.9 |
| D | 10 | 199 | 9164 | 538.26 | 58 | 56 | 16.9 |
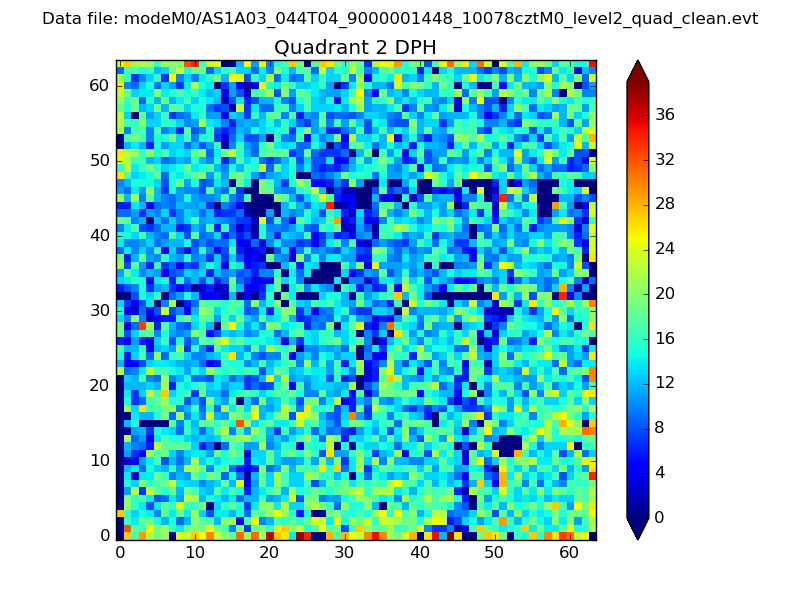
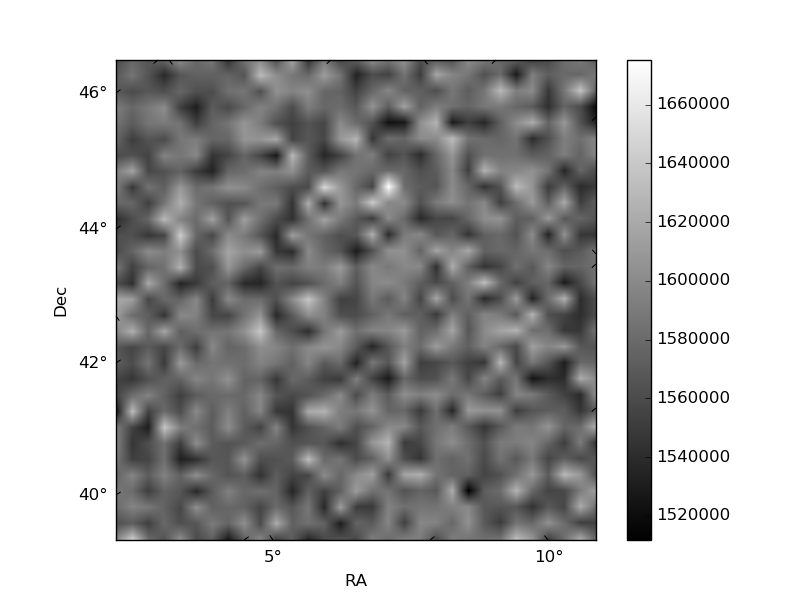
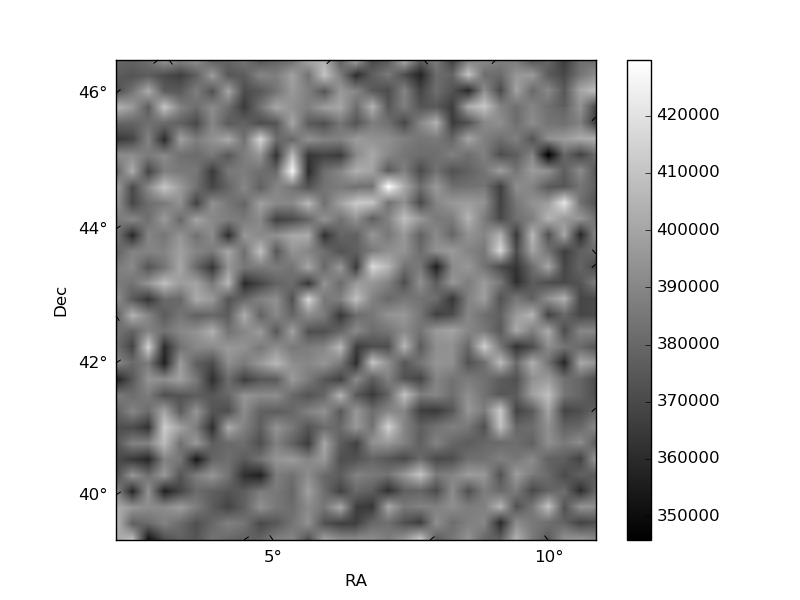
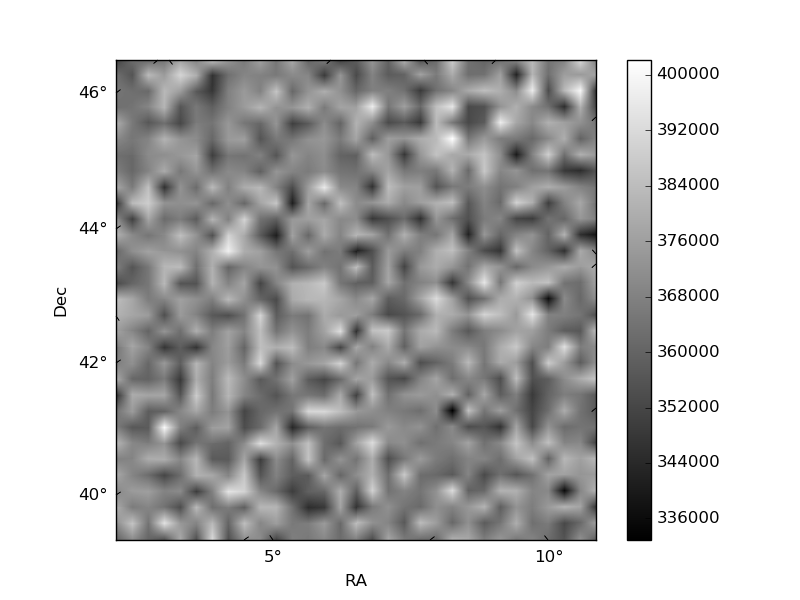
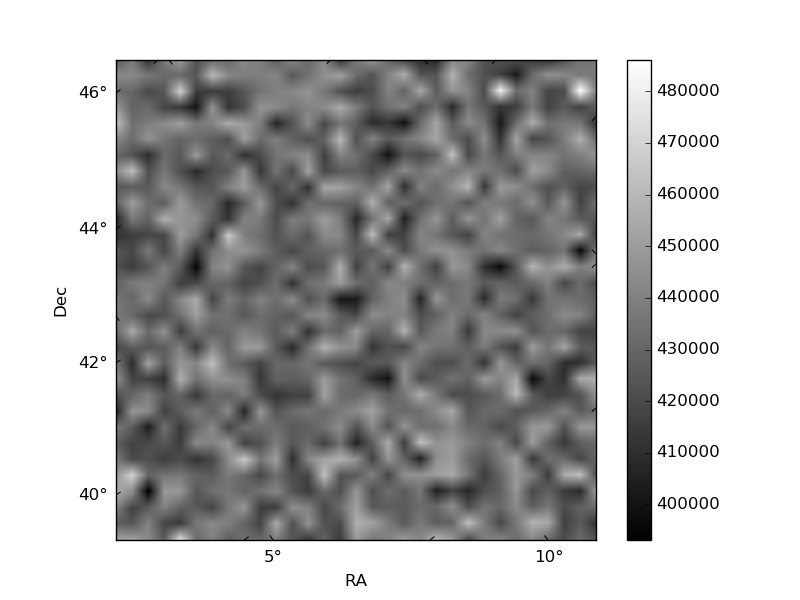
Histogram calculated using DETX and DETY for each event in the final _common_clean file
| Quadrant A | 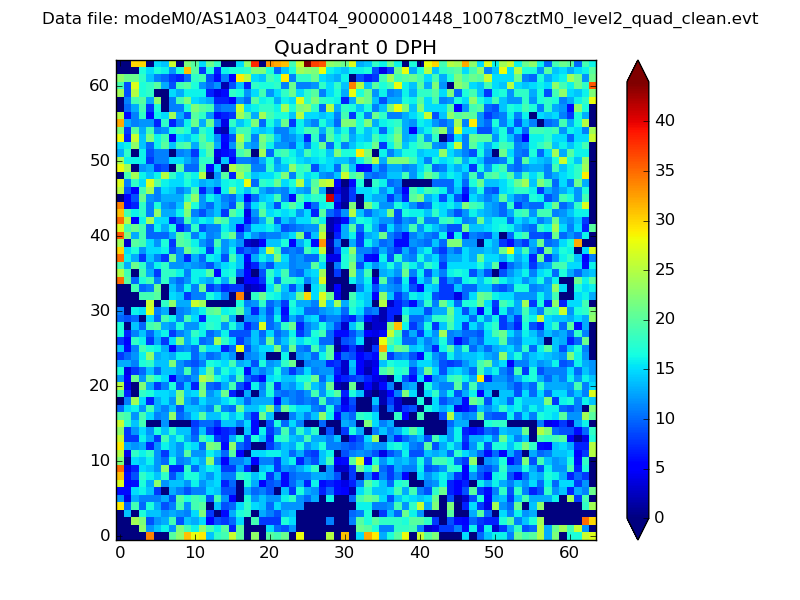 |
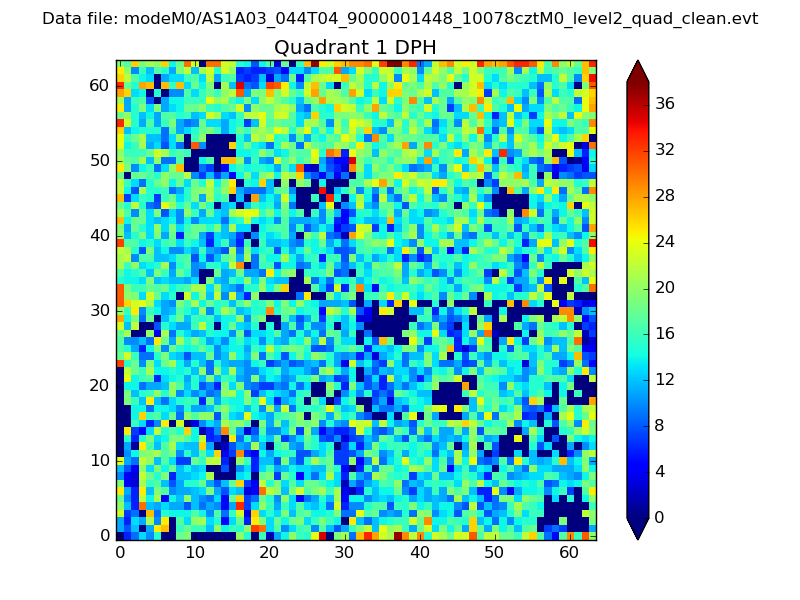 |
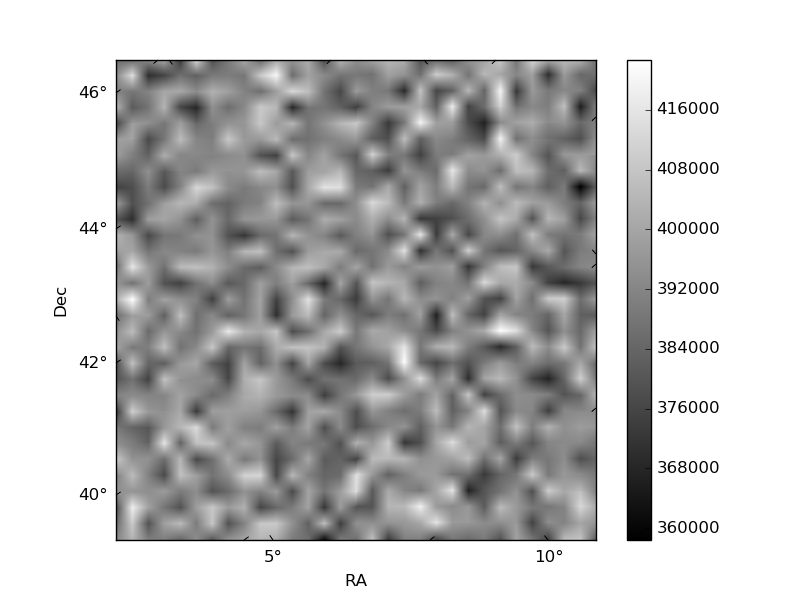
Quadrant B |
|---|---|---|---|
| Quadrant D | 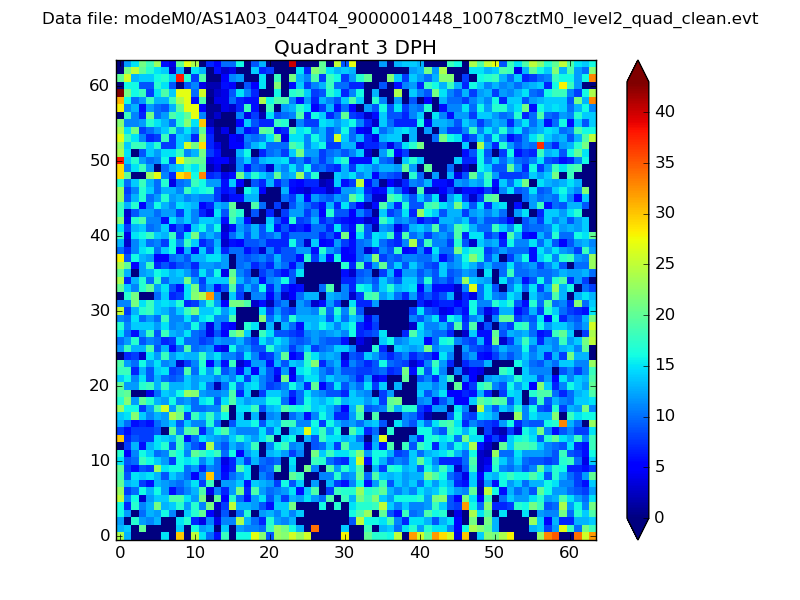 |
 |
Quadrant C |
| Plot type | Count rate plots | Images |
|---|---|---|
| Comparison with Poisson distribution Blue bars denote a histogram of data divided into 1 sec bins. Red curve is a Poisson curve with rate = median count rate of data. |
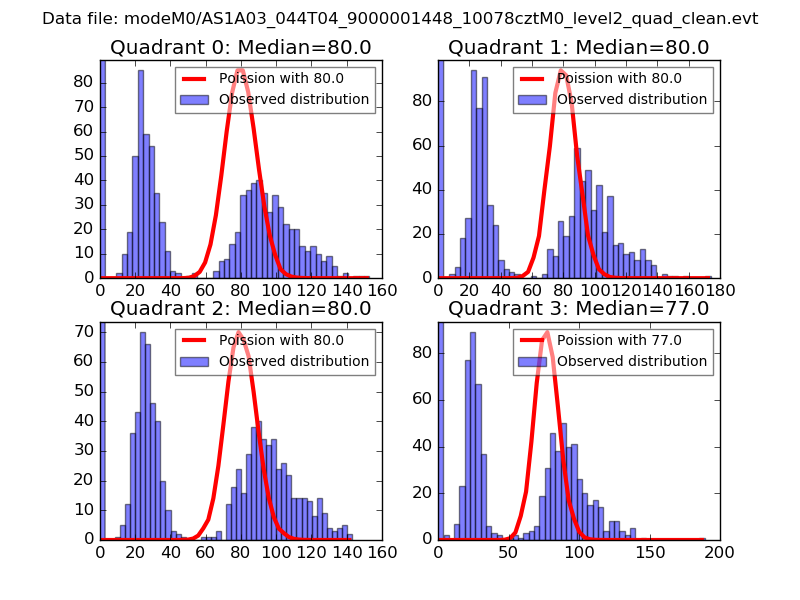 |
 |
| Quadrant-wise count rates Data is divided into 100 sec bins |
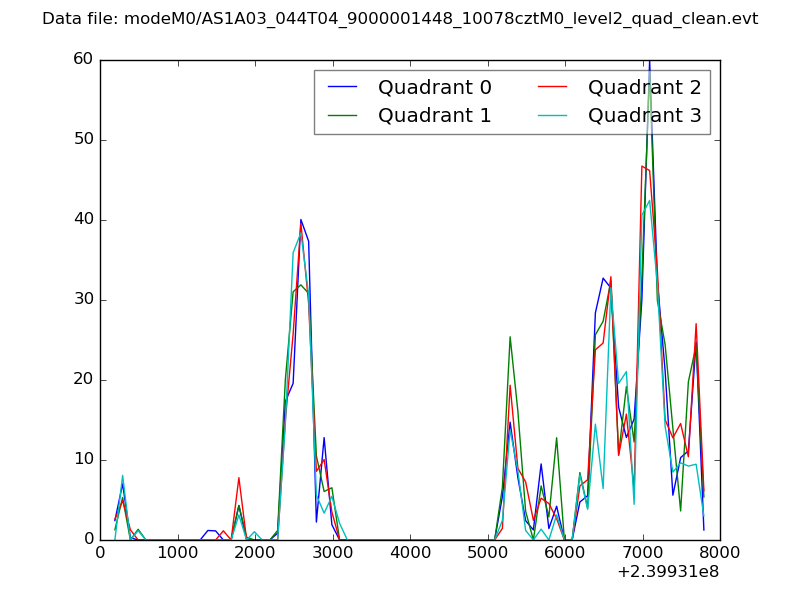 |
|
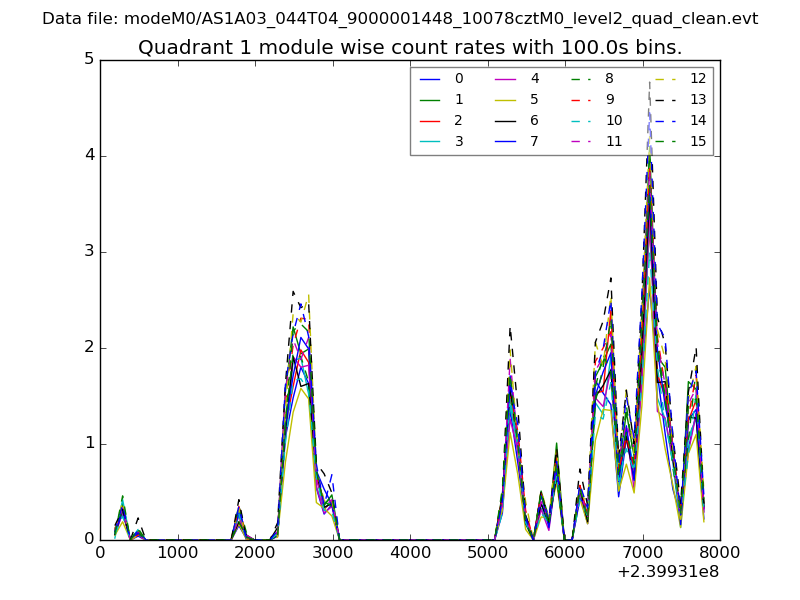
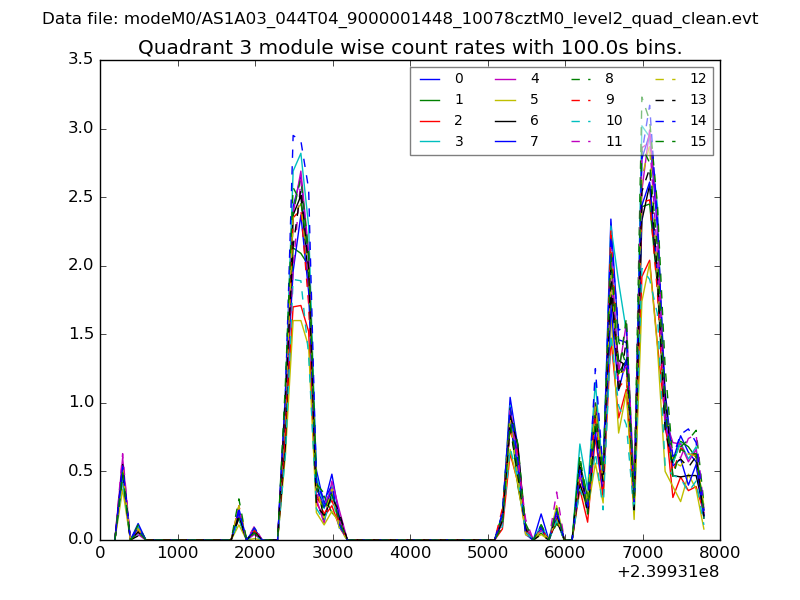
| Module-wise count rates for Quadrant A Data is divided into 100 sec bins |
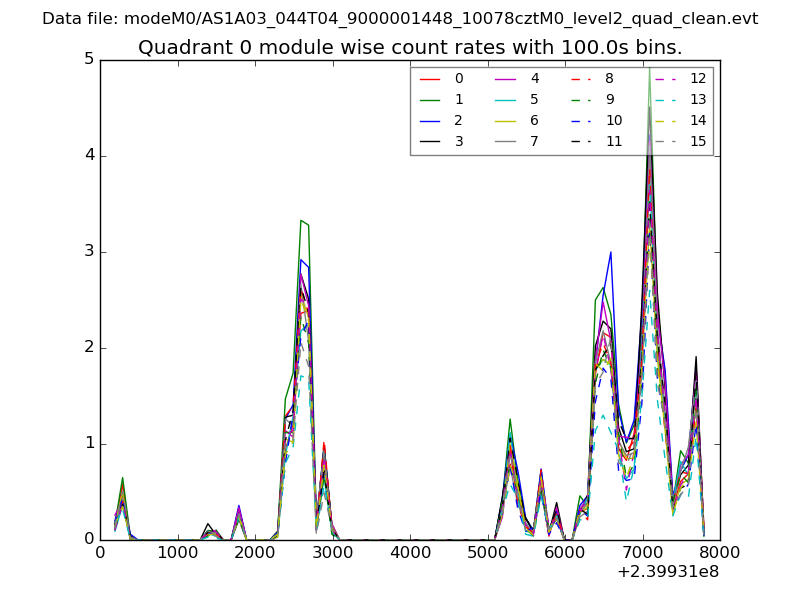 |
 |
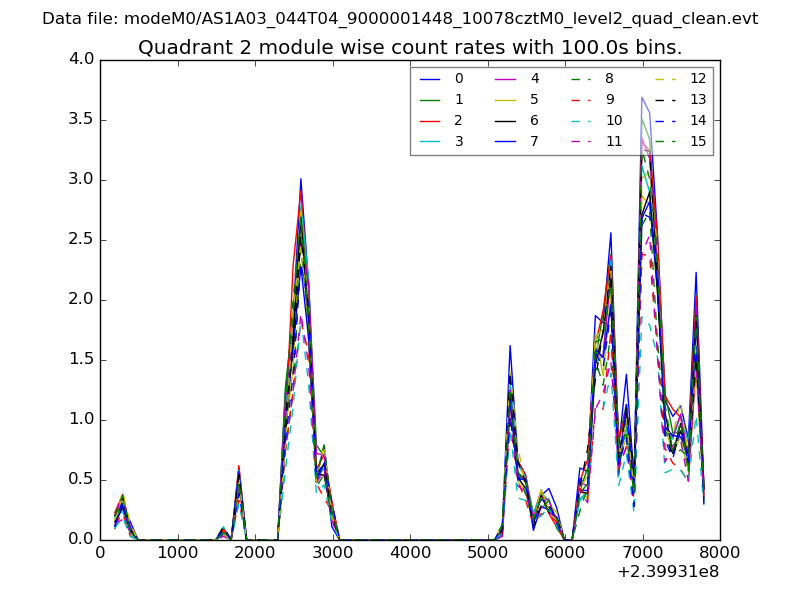
| Module-wise count rates for Quadrant B Data is divided into 100 sec bins |
 |
 |
| Module-wise count rates for Quadrant C Data is divided into 100 sec bins |
 |
 |
| Module-wise count rates for Quadrant D Data is divided into 100 sec bins |
 |
 |
| Parameter | Plot |
|---|---|
| CZT HV Monitor | 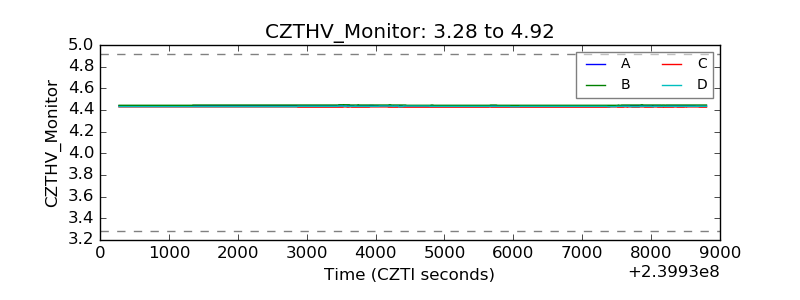 |
| D_VDD |  |
| Temperature 1 | 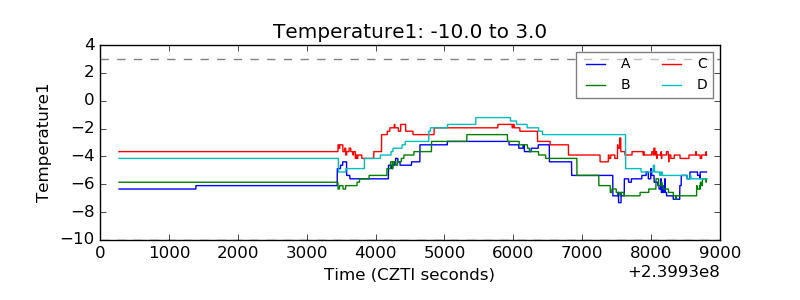 |
| Veto HV Monitor | 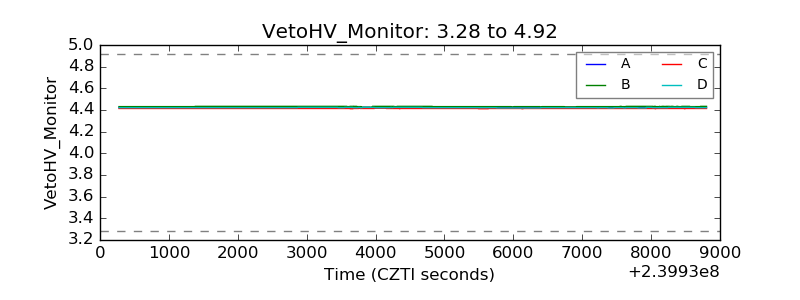 |
| Veto LLD | 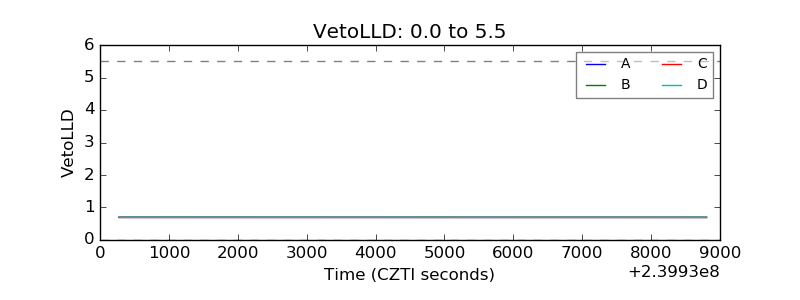 |
| Alpha Counter | 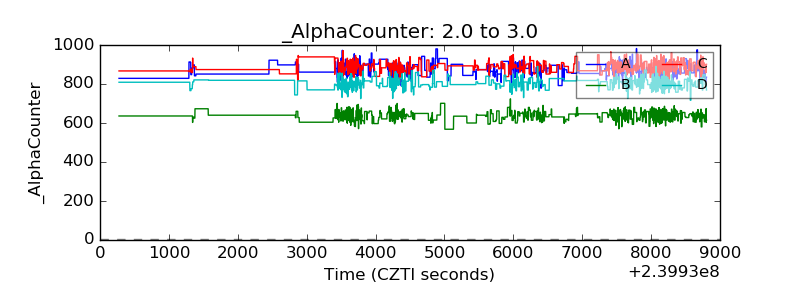 |
| _CPM_Rate | 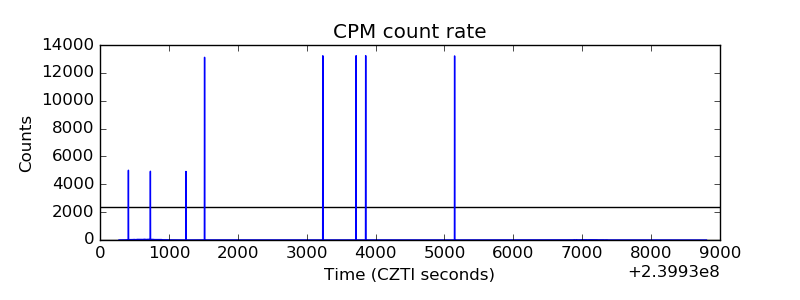 |
| CZT Counter | 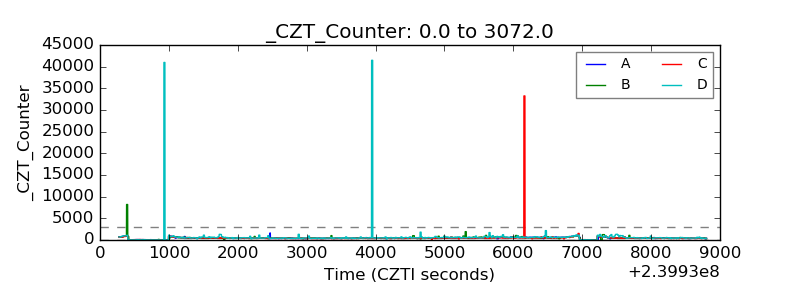 |
| +2.5 Volts monitor | 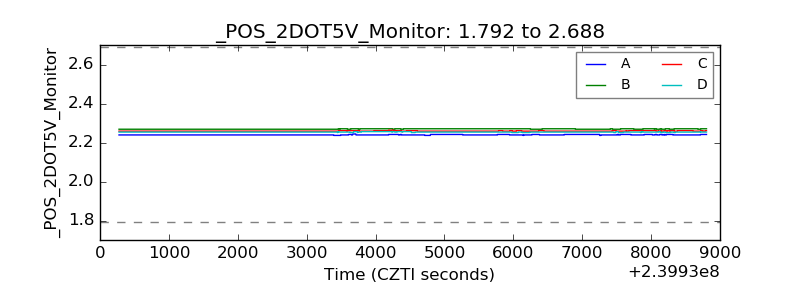 |
| +5 Volts monitor | 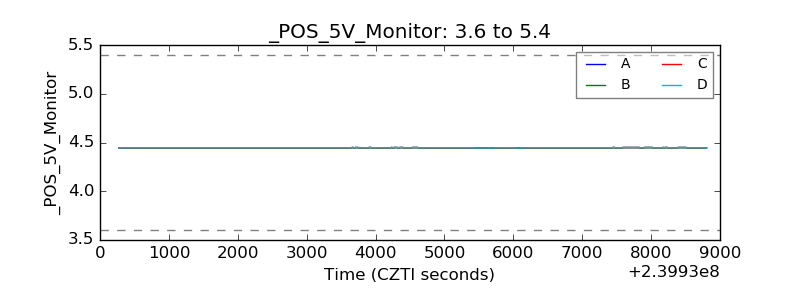 |
| _ROLL_ROT | 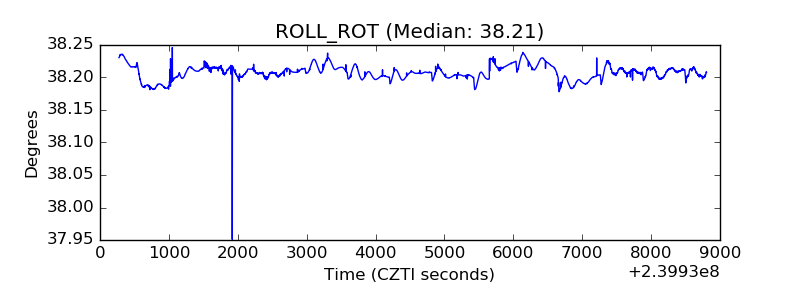 |
| _Roll_DEC | 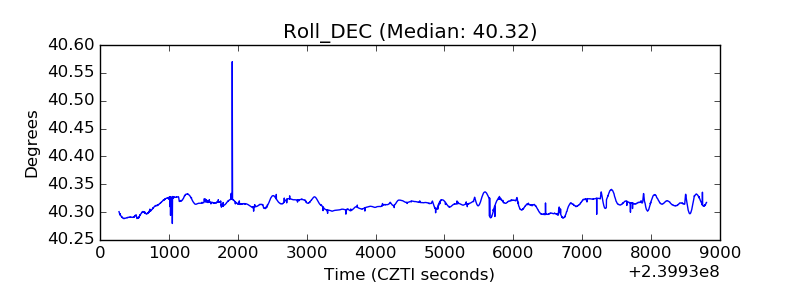 |
| _Roll_RA | 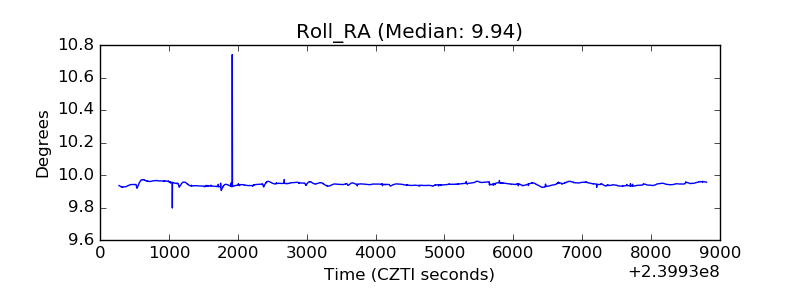 |
| Veto Counter | 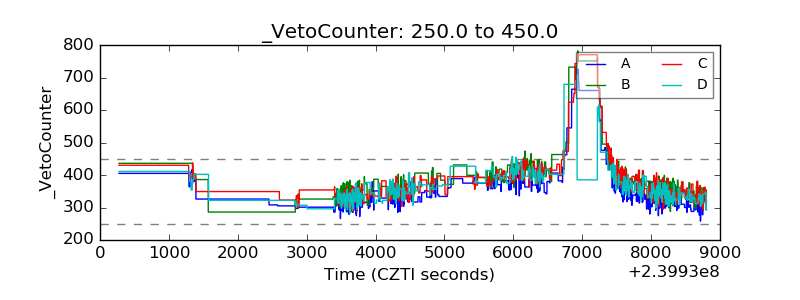 |