| Param | Original file | Final file |
|---|---|---|
| Filename | modeM0/AS1A03_044T04_9000001448_10082cztM0_level2.evt | modeM0/AS1A03_044T04_9000001448_10082cztM0_level2_quad_clean.evt |
| Size (bytes) | 24,160,320 | 4,625,280 |
| Size | 23.0 MB | 4.4 MB |
| Events in quadrant A | 174,818 | 27,343 |
| Events in quadrant B | 173,740 | 26,855 |
| Events in quadrant C | 177,707 | 27,449 |
| Events in quadrant D | 176,044 | 23,680 |
| Mode M0 | |||
|---|---|---|---|
| Quadrant | BADHDUFLAG | Total packets | Discarded packets |
| A | 0 | 37076 | 36300 |
| B | 0 | 37157 | 36384 |
| C | 0 | 36173 | 35358 |
| D | 0 | 42531 | 41814 |
| Mode M9 | |||
|---|---|---|---|
| Quadrant | BADHDUFLAG | Total packets | Discarded packets |
| A | 0 | 11 | 11 |
| B | 0 | 15 | 14 |
| C | 0 | 12 | 12 |
| D | 0 | 12 | 12 |
| Mode SS | |||
|---|---|---|---|
| Quadrant | BADHDUFLAG | Total packets | Discarded packets |
| A | 0 | 366 | 359 |
| B | 0 | 359 | 351 |
| C | 0 | 355 | 348 |
| D | 0 | 378 | 370 |
| Quadrant | Total seconds | Saturated seconds | Saturation percentage |
|---|---|---|---|
| A | 383 | 0 | 0.000000% |
| B | 382 | 1 | 0.261780% |
| C | 407 | 0 | 0.000000% |
| D | 325 | 0 | 0.000000% |
Noise dominated data is calculated using 1-second bins in cleaned event files. If a bin has >2000 counts, and if more than 50% of those come from <1% of pixels, then it is considered to be noise-dominated and hence unusable.
| Quadrant | # 1 sec bins | Bins with >0 counts | Bins with >2000 counts | High rate bins dominated by noise | Noise dominated (total time) | Noise dominated (detector-on time) | Marked lightcurve |
|---|---|---|---|---|---|---|---|
| A | 15416 | 672 | 0 | 0 | 0.00% | 0.00% | 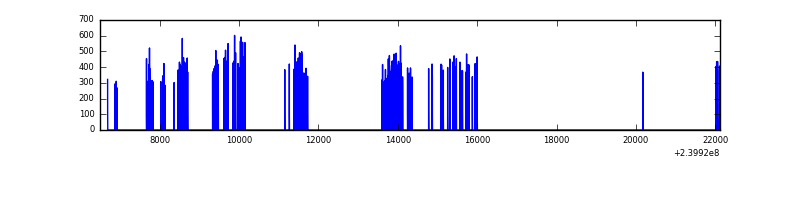 |
| B | 15161 | 675 | 0 | 0 | 0.00% | 0.00% | 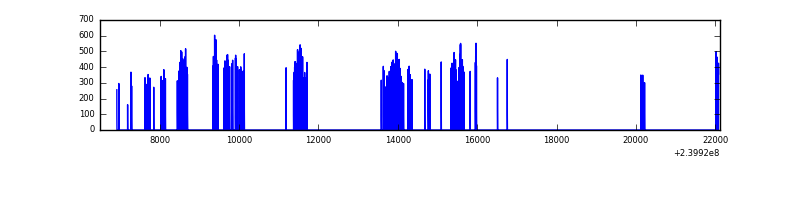 |
| C | 15620 | 704 | 0 | 0 | 0.00% | 0.00% | 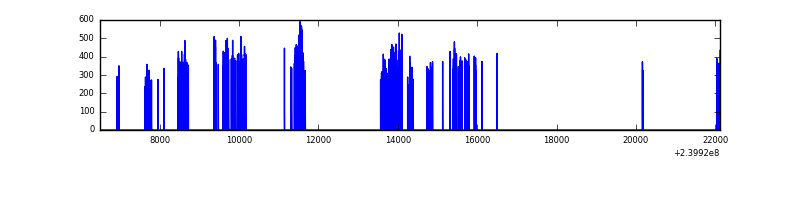 |
| D | 15284 | 577 | 0 | 0 | 0.00% | 0.00% | 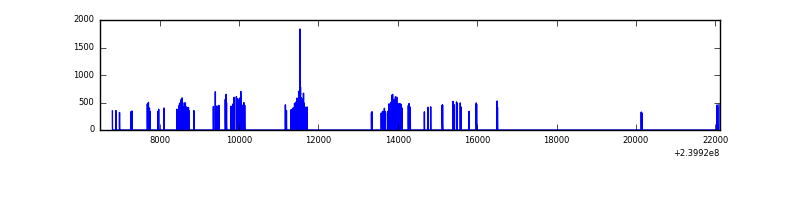 |
Top three noisy pixels from each quadrant. If the there are fewer than three noisy pixels in the level2.evt file, extra rows are filled as -1
| Pixel properties | Quadrant properties | ||||||
|---|---|---|---|---|---|---|---|
| Quadrant | DetID | PixID | Counts | Sigma | Mean | Median | Sigma |
| A | 0 | 8 | 5314 | 478.1 | 43 | 42 | 11.0 |
| A | 8 | 15 | 3180 | 284.58 | 43 | 42 | 11.0 |
| A | 13 | 253 | 800 | 68.74 | 43 | 42 | 11.0 |
| B | 0 | 214 | 3297 | 305.01 | 43 | 42 | 10.7 |
| B | 4 | 81 | 952 | 85.27 | 43 | 42 | 10.7 |
| B | 12 | 111 | 927 | 82.93 | 43 | 42 | 10.7 |
| C | 14 | 234 | 507 | 37.36 | 45 | 45 | 12.4 |
| C | 4 | 175 | 457 | 33.31 | 45 | 45 | 12.4 |
| C | 14 | 67 | 330 | 23.04 | 45 | 45 | 12.4 |
| D | 8 | 195 | 20423 | 1918.03 | 34 | 33 | 10.6 |
| D | 10 | 199 | 9325 | 874.07 | 34 | 33 | 10.6 |
| D | 2 | 152 | 8091 | 757.99 | 34 | 33 | 10.6 |
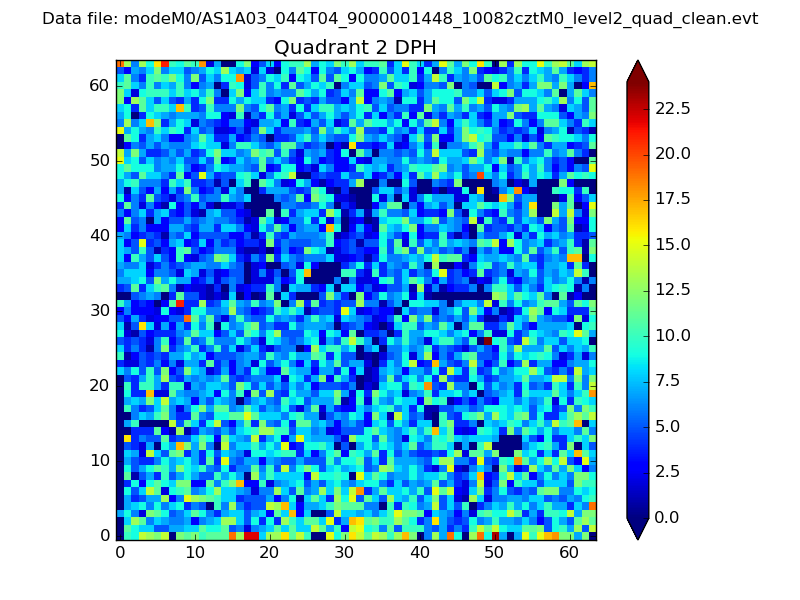
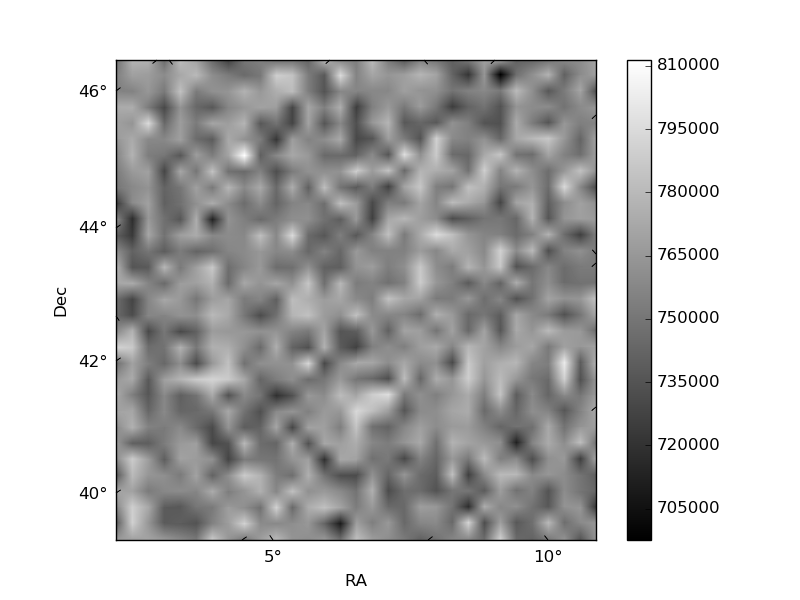
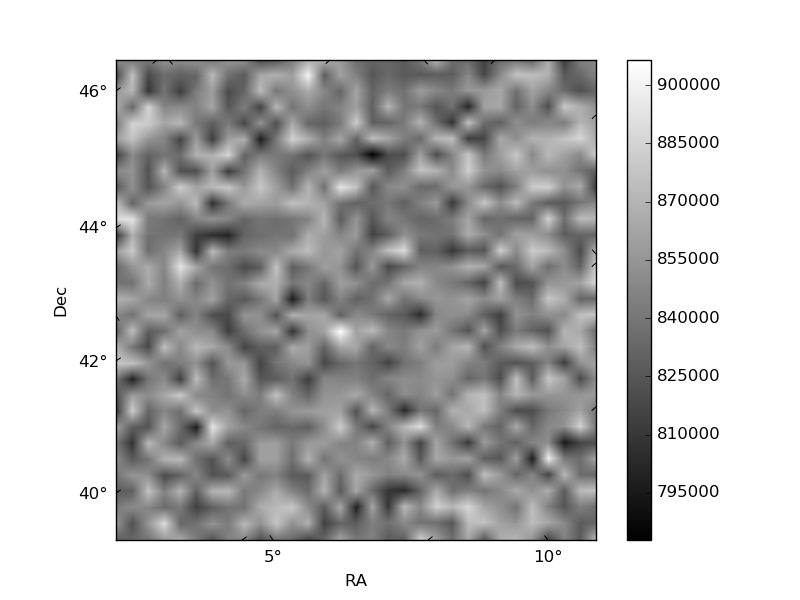
Histogram calculated using DETX and DETY for each event in the final _common_clean file
| Quadrant A | 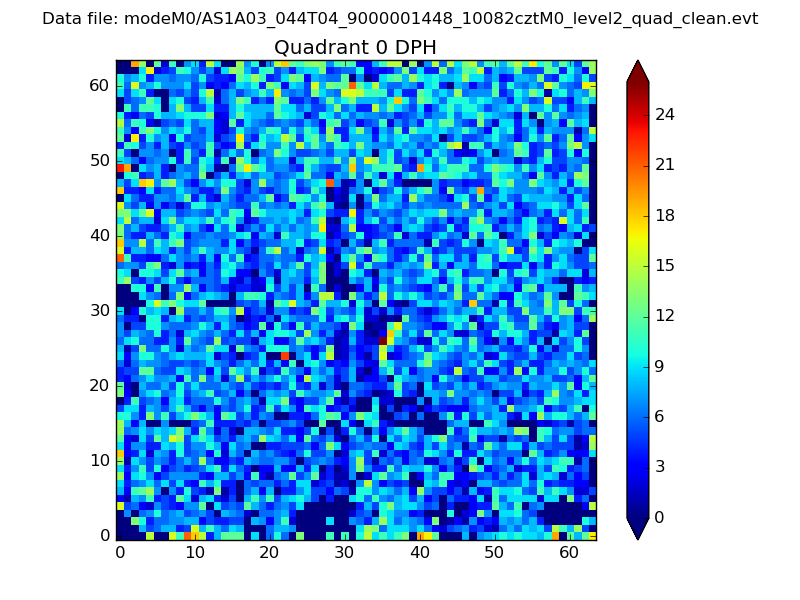 |
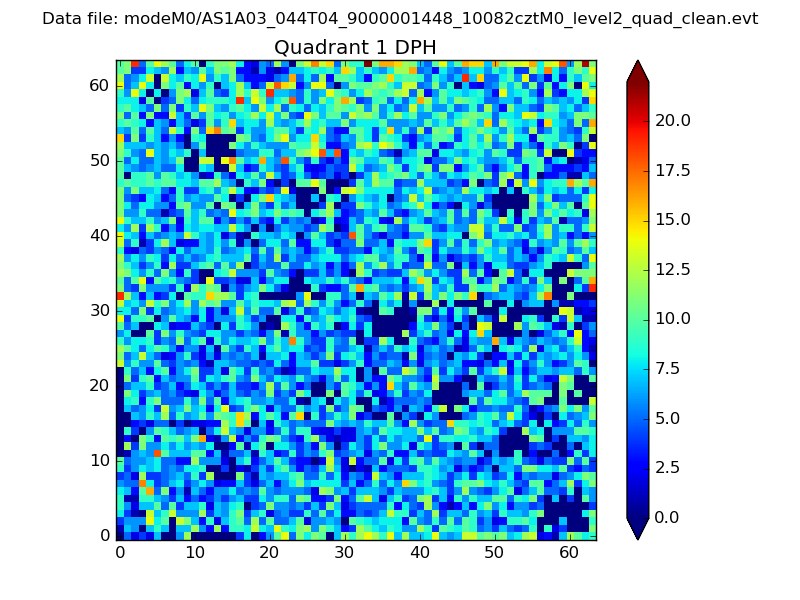 |
Quadrant B |
|---|---|---|---|
| Quadrant D | 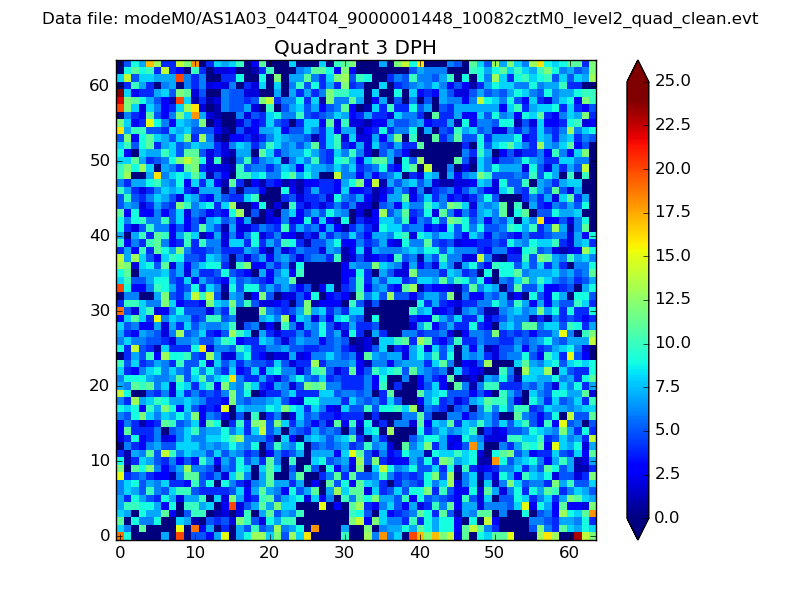 |
 |
Quadrant C |
| Plot type | Count rate plots | Images |
|---|---|---|
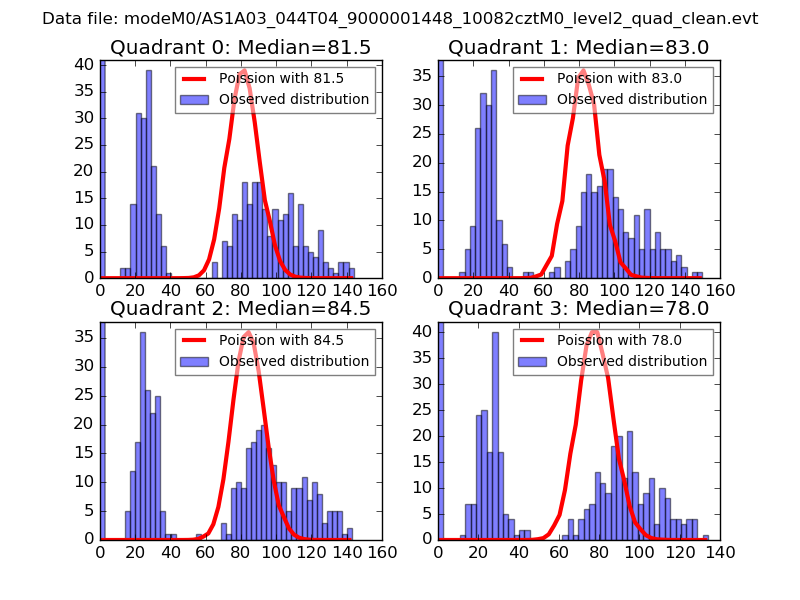
| Comparison with Poisson distribution Blue bars denote a histogram of data divided into 1 sec bins. Red curve is a Poisson curve with rate = median count rate of data. |
 |
 |
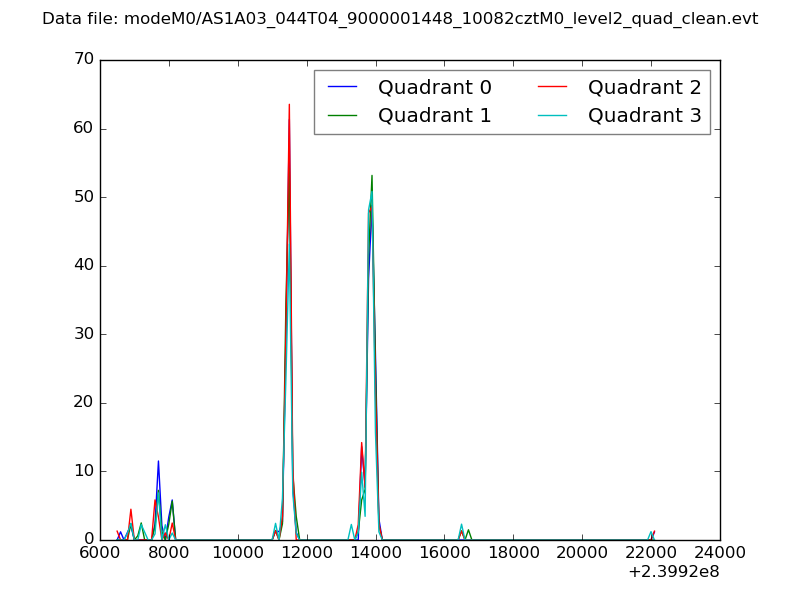
| Quadrant-wise count rates Data is divided into 100 sec bins |
 |
|
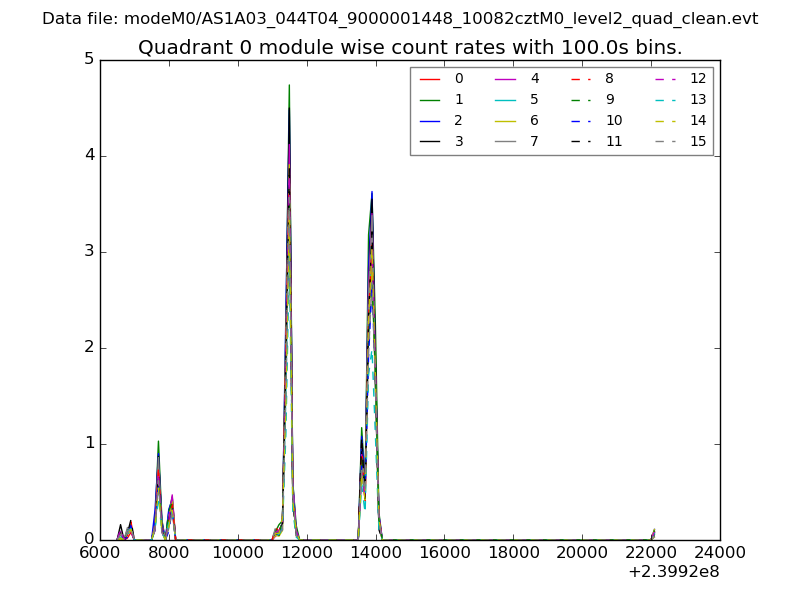
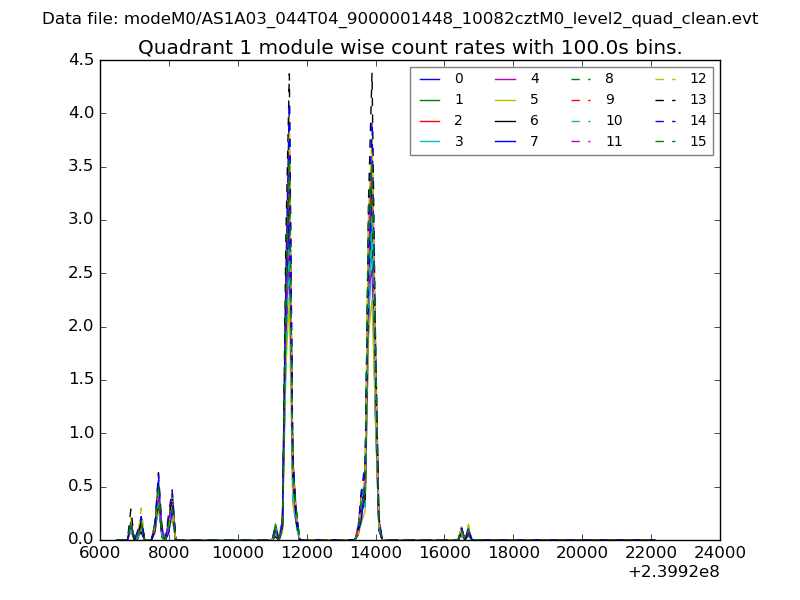
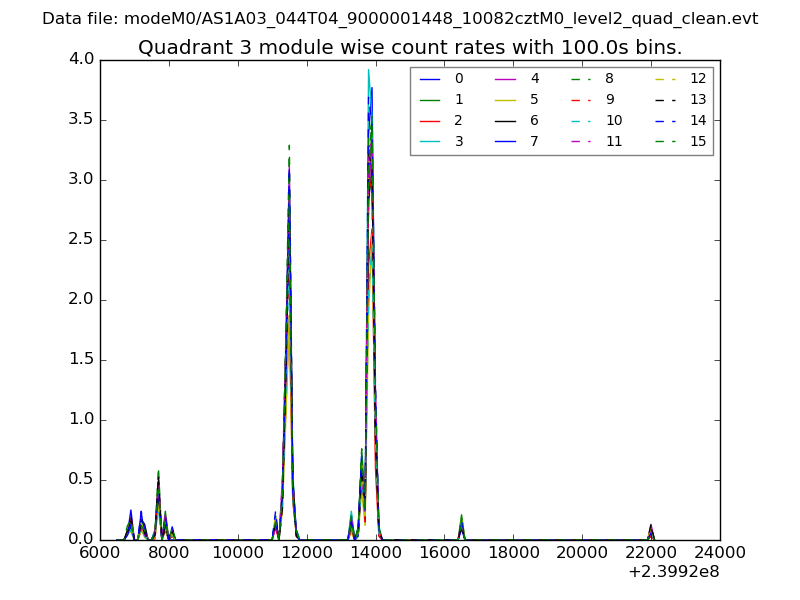
| Module-wise count rates for Quadrant A Data is divided into 100 sec bins |
 |
 |
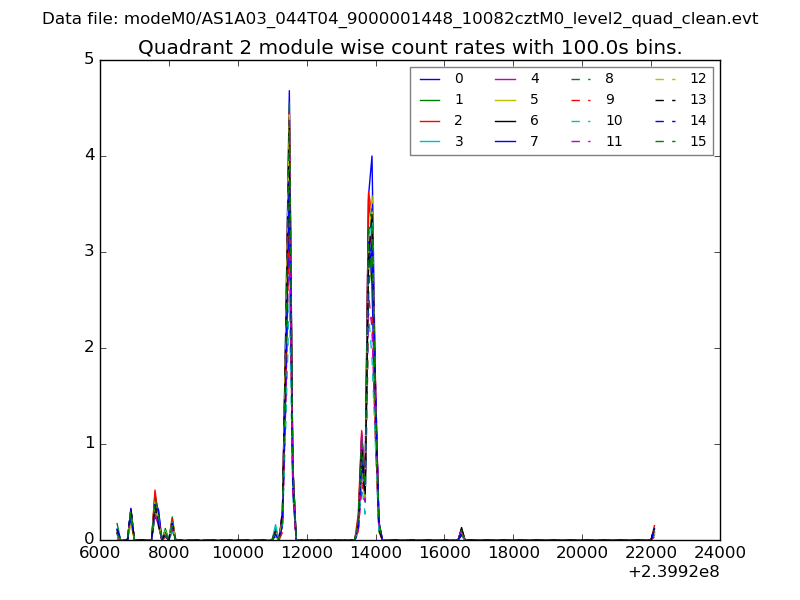
| Module-wise count rates for Quadrant B Data is divided into 100 sec bins |
 |
 |
| Module-wise count rates for Quadrant C Data is divided into 100 sec bins |
 |
 |
| Module-wise count rates for Quadrant D Data is divided into 100 sec bins |
 |
 |
| Parameter | Plot |
|---|---|
| CZT HV Monitor | 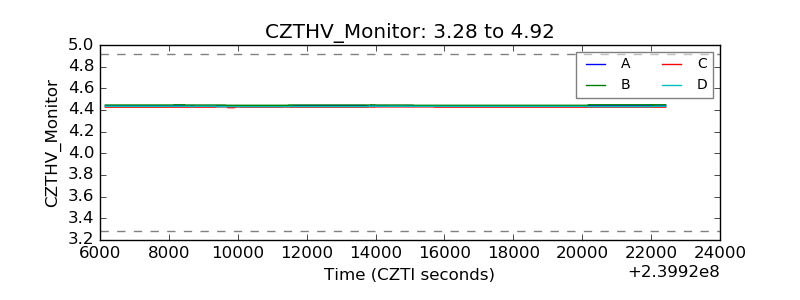 |
| D_VDD | 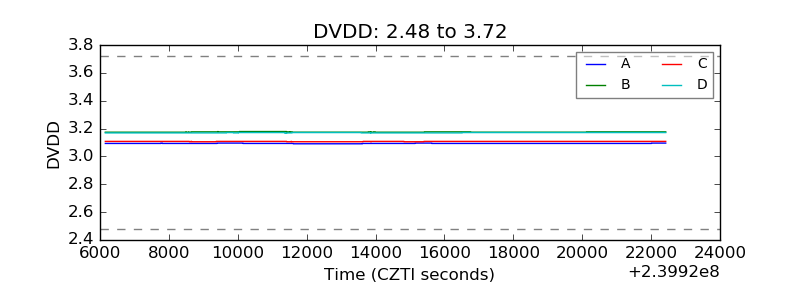 |
| Temperature 1 | 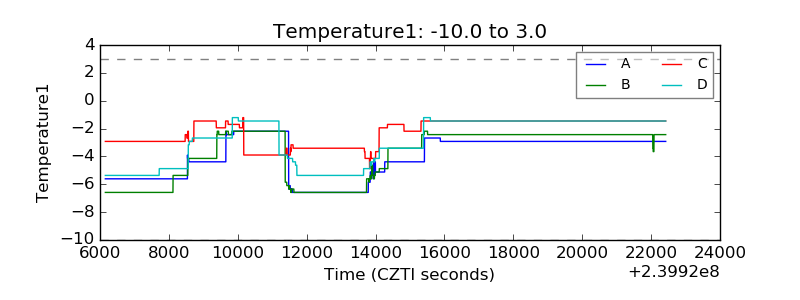 |
| Veto HV Monitor | 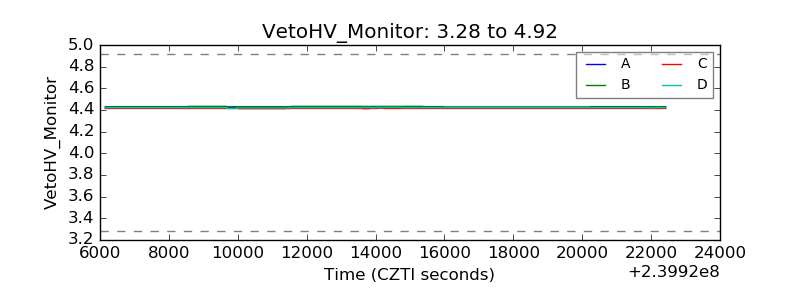 |
| Veto LLD | 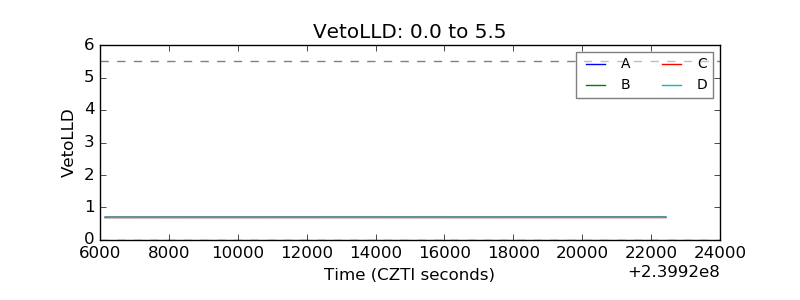 |
| Alpha Counter | 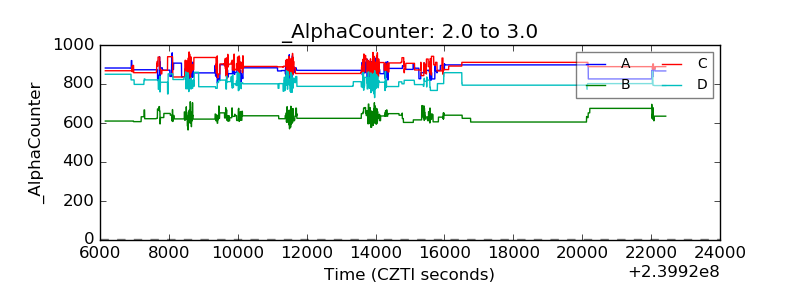 |
| _CPM_Rate | 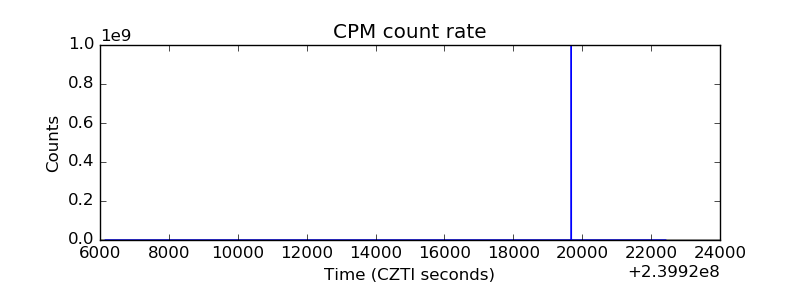 |
| CZT Counter | 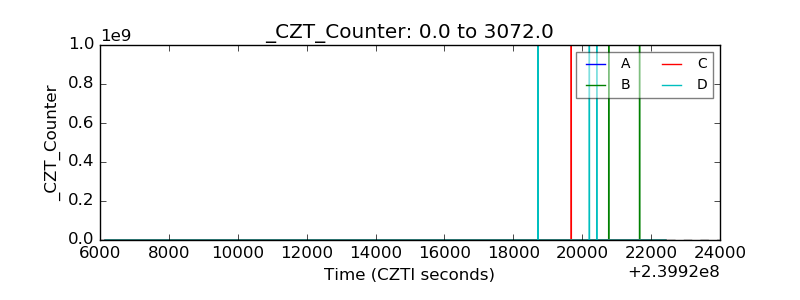 |
| +2.5 Volts monitor | 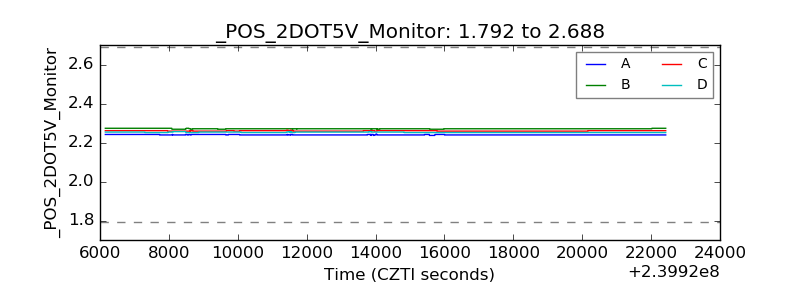 |
| +5 Volts monitor |  |
| _ROLL_ROT | 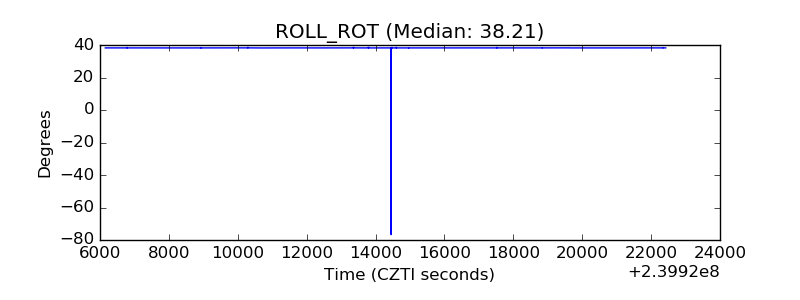 |
| _Roll_DEC | 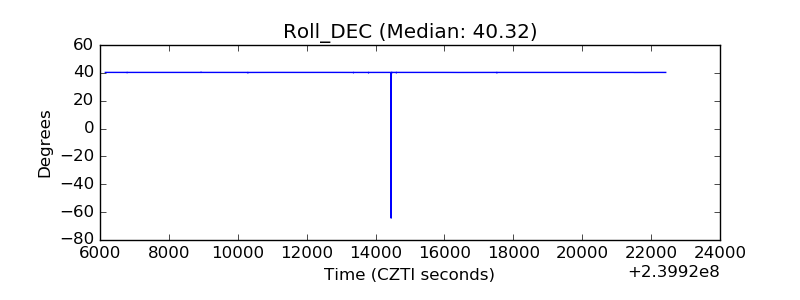 |
| _Roll_RA | 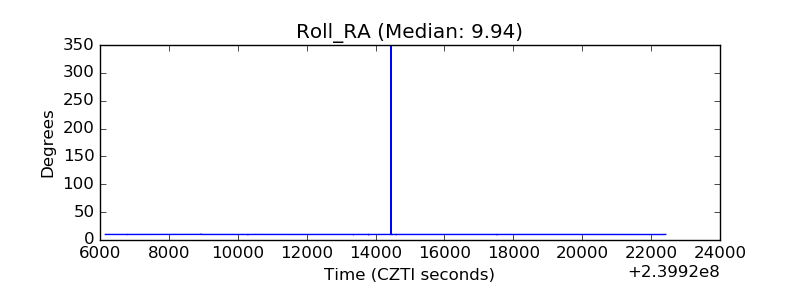 |
| Veto Counter | 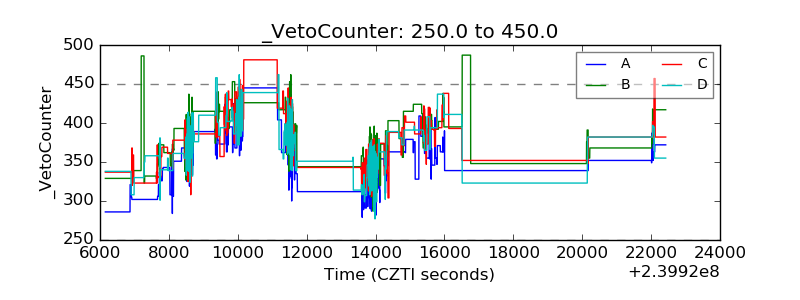 |