| Param | Original file | Final file |
|---|---|---|
| Filename | modeM0/AS1A03_044T04_9000001448_10083cztM0_level2.evt | modeM0/AS1A03_044T04_9000001448_10083cztM0_level2_quad_clean.evt |
| Size (bytes) | 1,039,432,320 | 187,424,640 |
| Size | 991.3 MB | 178.7 MB |
| Events in quadrant A | 7,282,804 | 1,158,885 |
| Events in quadrant B | 7,442,601 | 1,174,088 |
| Events in quadrant C | 7,044,068 | 1,161,314 |
| Events in quadrant D | 8,641,699 | 1,096,663 |
| Mode M0 | |||
|---|---|---|---|
| Quadrant | BADHDUFLAG | Total packets | Discarded packets |
| A | 0 | 45859 | 13074 |
| B | 0 | 46167 | 13281 |
| C | 0 | 44922 | 12419 |
| D | 0 | 52390 | 16471 |
| Mode M9 | |||
|---|---|---|---|
| Quadrant | BADHDUFLAG | Total packets | Discarded packets |
| A | 0 | 12 | 1 |
| B | 0 | 11 | 3 |
| C | 0 | 12 | 4 |
| D | 0 | 12 | 2 |
| Mode SS | |||
|---|---|---|---|
| Quadrant | BADHDUFLAG | Total packets | Discarded packets |
| A | 0 | 442 | 138 |
| B | 0 | 441 | 148 |
| C | 0 | 443 | 122 |
| D | 0 | 443 | 97 |
| Quadrant | Total seconds | Saturated seconds | Saturation percentage |
|---|---|---|---|
| A | 15808 | 138 | 0.872976% |
| B | 15753 | 170 | 1.079160% |
| C | 15873 | 68 | 0.428400% |
| D | 15352 | 200 | 1.302762% |
Noise dominated data is calculated using 1-second bins in cleaned event files. If a bin has >2000 counts, and if more than 50% of those come from <1% of pixels, then it is considered to be noise-dominated and hence unusable.
| Quadrant | # 1 sec bins | Bins with >0 counts | Bins with >2000 counts | High rate bins dominated by noise | Noise dominated (total time) | Noise dominated (detector-on time) | Marked lightcurve |
|---|---|---|---|---|---|---|---|
| A | 23120 | 18452 | 3 | 3 | 0.01% | 0.02% | 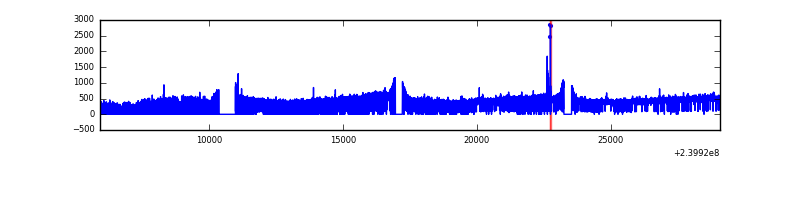 |
| B | 23132 | 18439 | 2 | 2 | 0.01% | 0.01% | 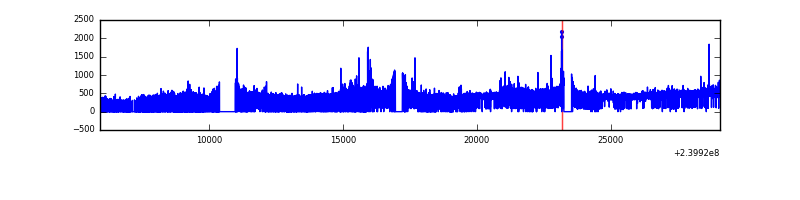 |
| C | 23131 | 18570 | 3 | 3 | 0.01% | 0.02% | 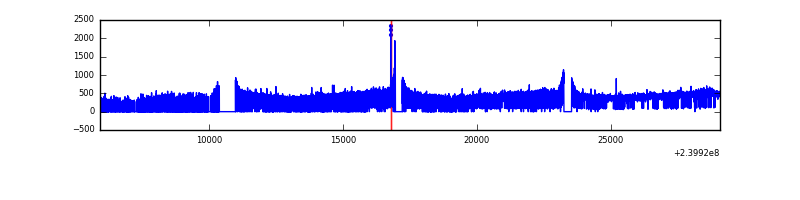 |
| D | 23102 | 18055 | 85 | 85 | 0.37% | 0.47% | 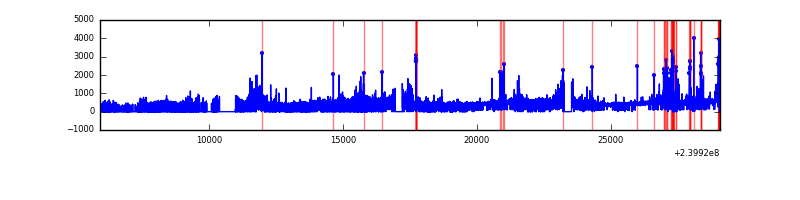 |
Top three noisy pixels from each quadrant. If the there are fewer than three noisy pixels in the level2.evt file, extra rows are filled as -1
| Pixel properties | Quadrant properties | ||||||
|---|---|---|---|---|---|---|---|
| Quadrant | DetID | PixID | Counts | Sigma | Mean | Median | Sigma |
| A | 0 | 8 | 118666 | 313.71 | 1837 | 1793 | 372.5 |
| A | 8 | 15 | 51982 | 134.72 | 1837 | 1793 | 372.5 |
| A | 4 | 2 | 28537 | 71.79 | 1837 | 1793 | 372.5 |
| B | 0 | 214 | 122943 | 339.39 | 1841 | 1792 | 357.0 |
| B | 4 | 239 | 48871 | 131.89 | 1841 | 1792 | 357.0 |
| B | 0 | 219 | 47430 | 127.85 | 1841 | 1792 | 357.0 |
| C | 14 | 234 | 18673 | 40.45 | 1796 | 1803 | 417.1 |
| C | 13 | 61 | 13236 | 27.41 | 1796 | 1803 | 417.1 |
| C | 14 | 67 | 12471 | 25.58 | 1796 | 1803 | 417.1 |
| D | 8 | 195 | 837352 | 1923.75 | 1716 | 1673 | 434.4 |
| D | 10 | 199 | 531497 | 1219.66 | 1716 | 1673 | 434.4 |
| D | 2 | 152 | 244232 | 558.37 | 1716 | 1673 | 434.4 |
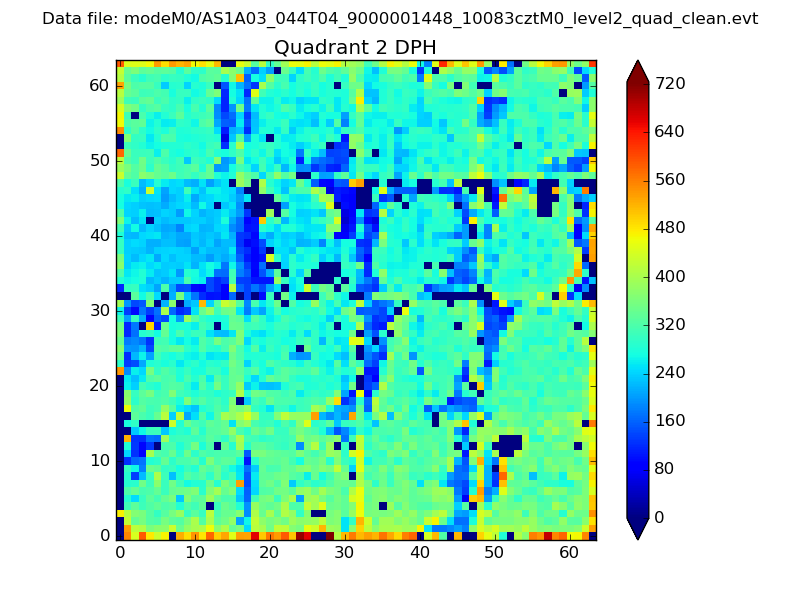
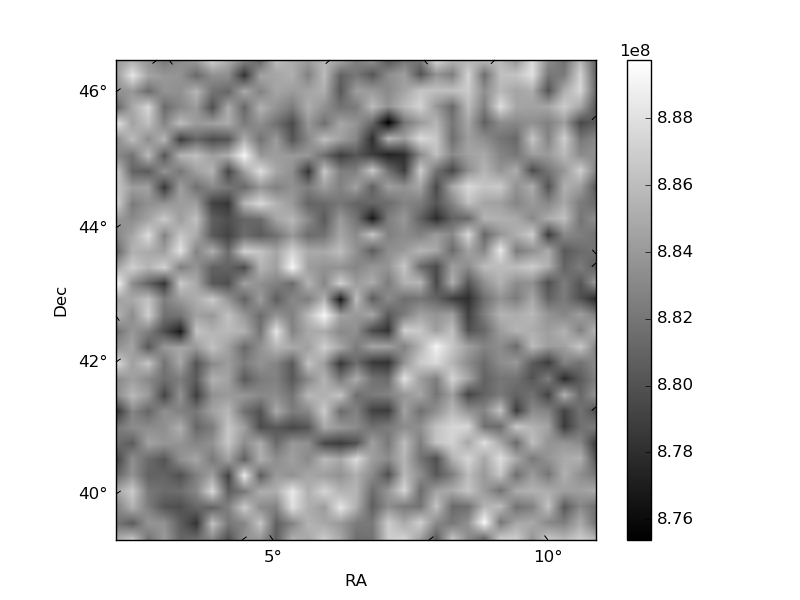
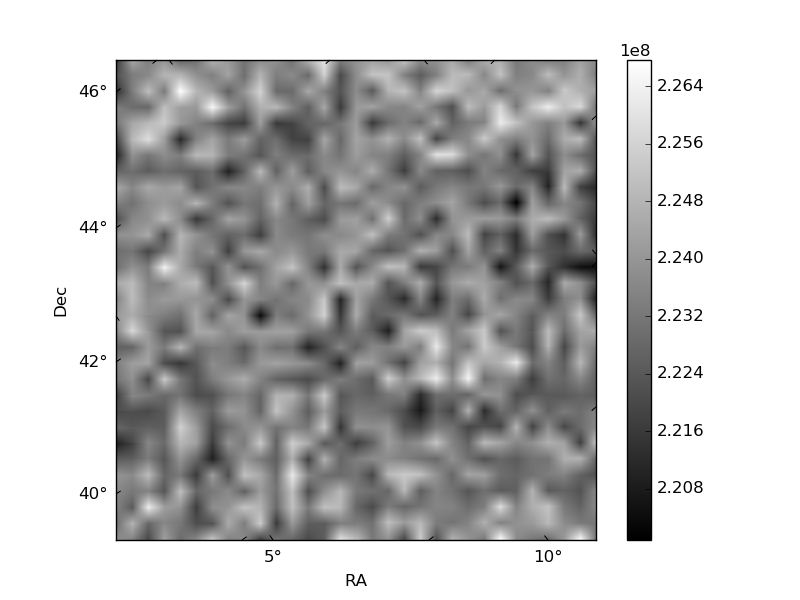
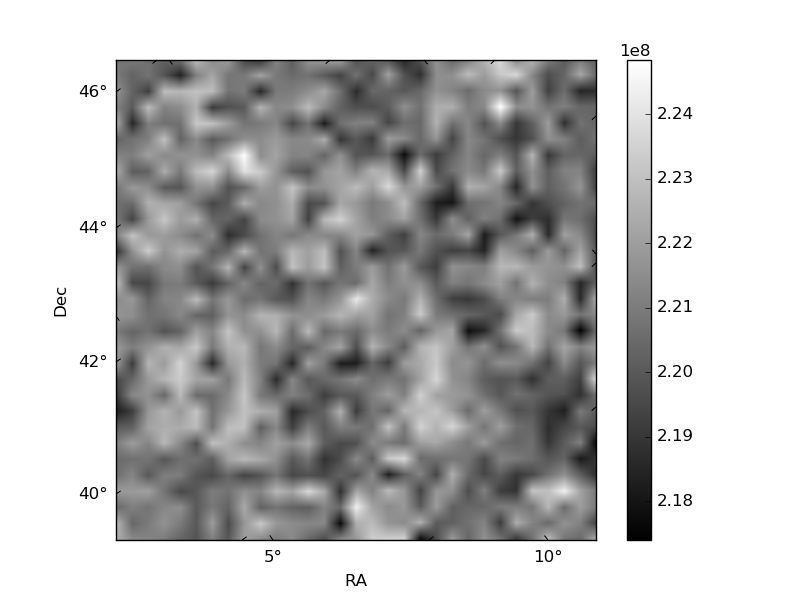
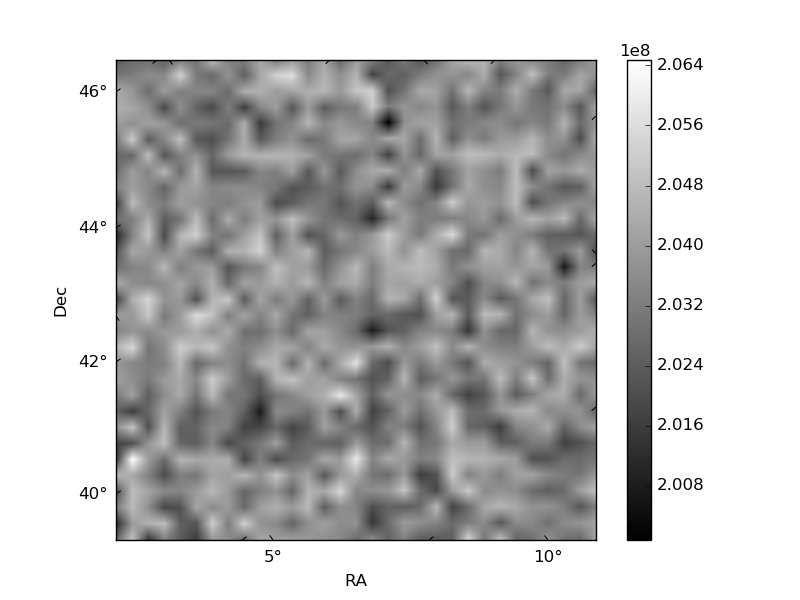
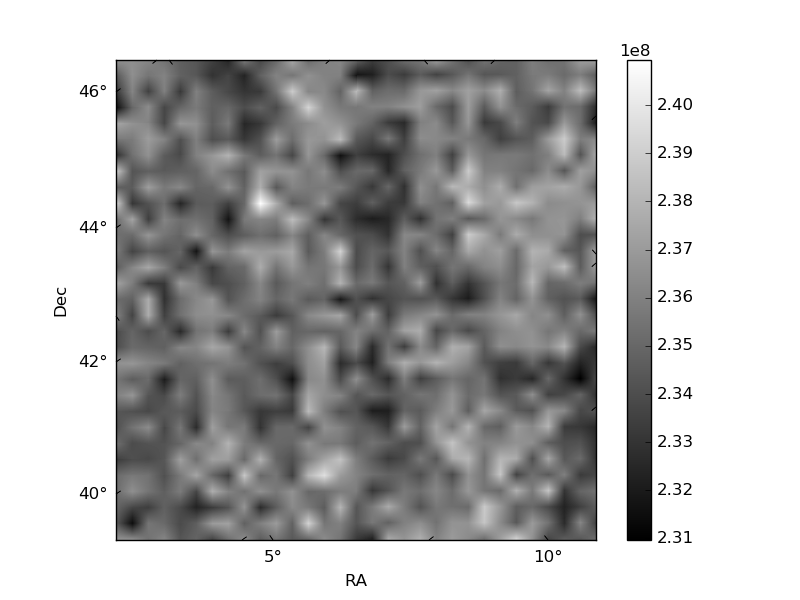
Histogram calculated using DETX and DETY for each event in the final _common_clean file
| Quadrant A | 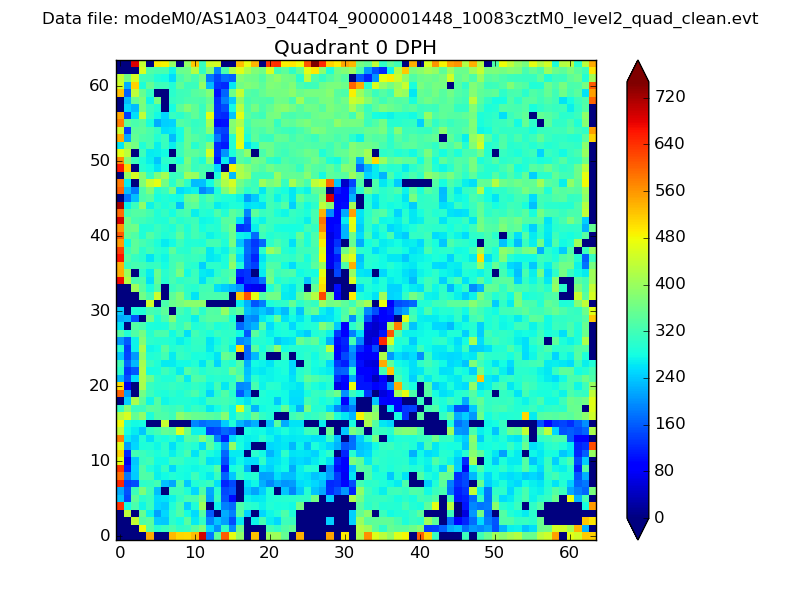 |
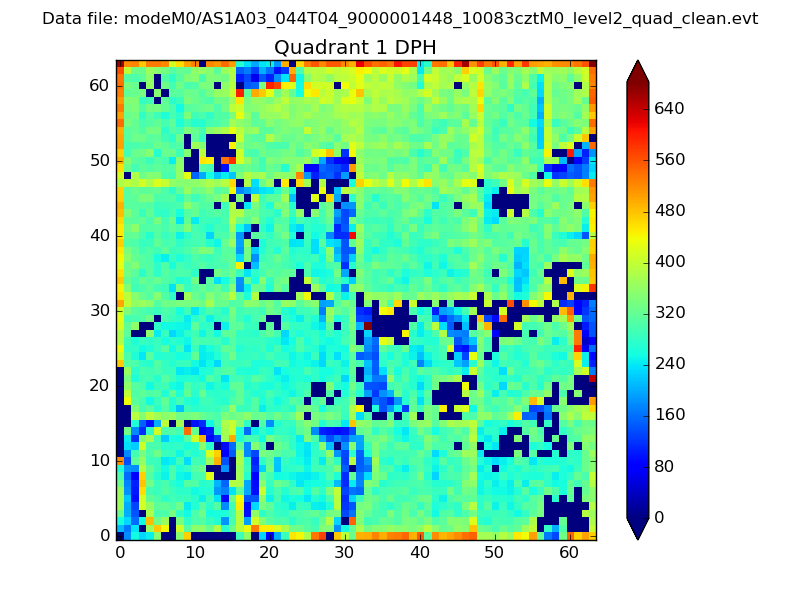 |
Quadrant B |
|---|---|---|---|
| Quadrant D | 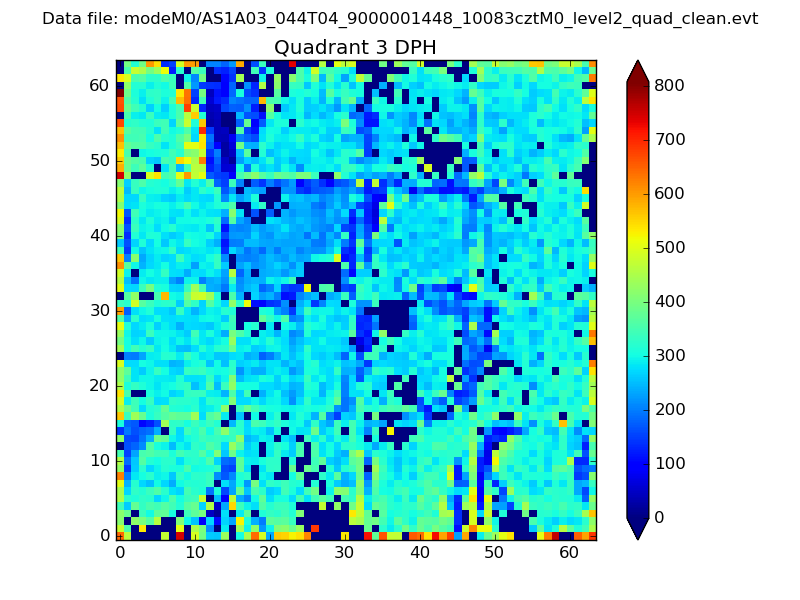 |
 |
Quadrant C |
| Plot type | Count rate plots | Images |
|---|---|---|
| Comparison with Poisson distribution Blue bars denote a histogram of data divided into 1 sec bins. Red curve is a Poisson curve with rate = median count rate of data. |
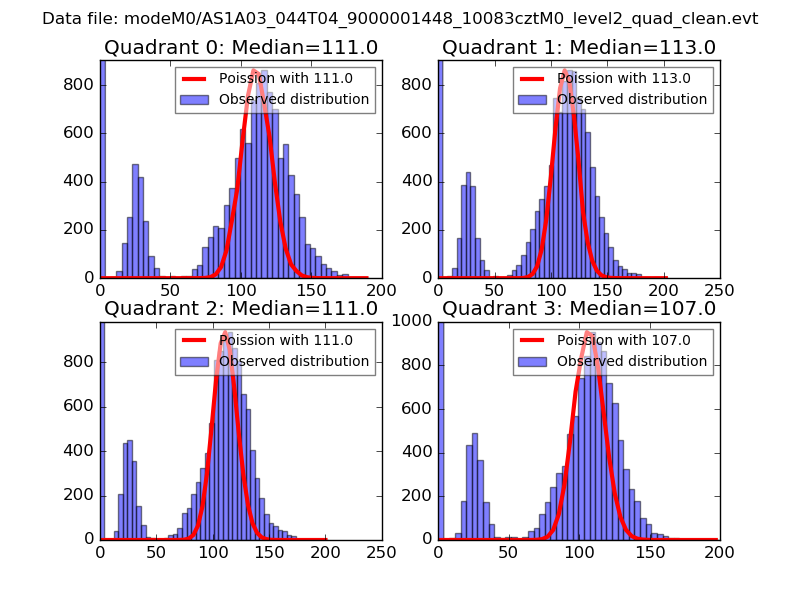 |
 |
| Quadrant-wise count rates Data is divided into 100 sec bins |
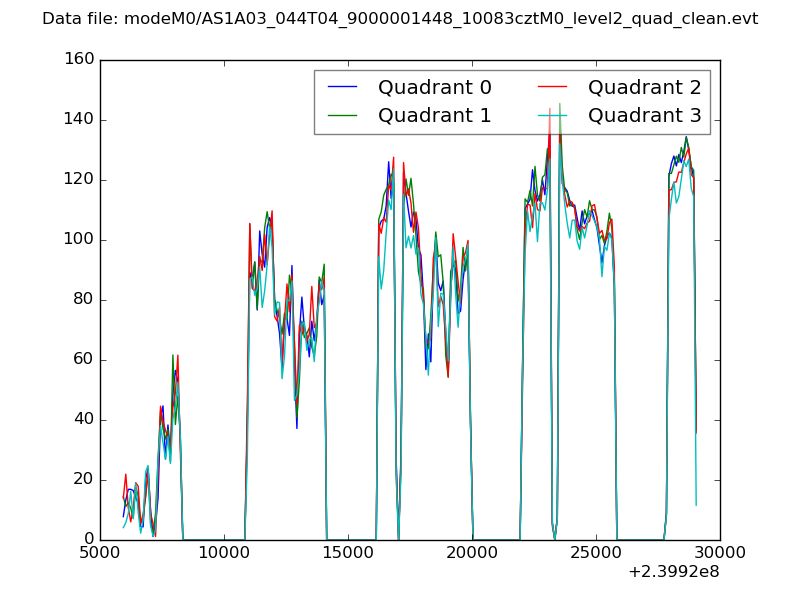 |
|
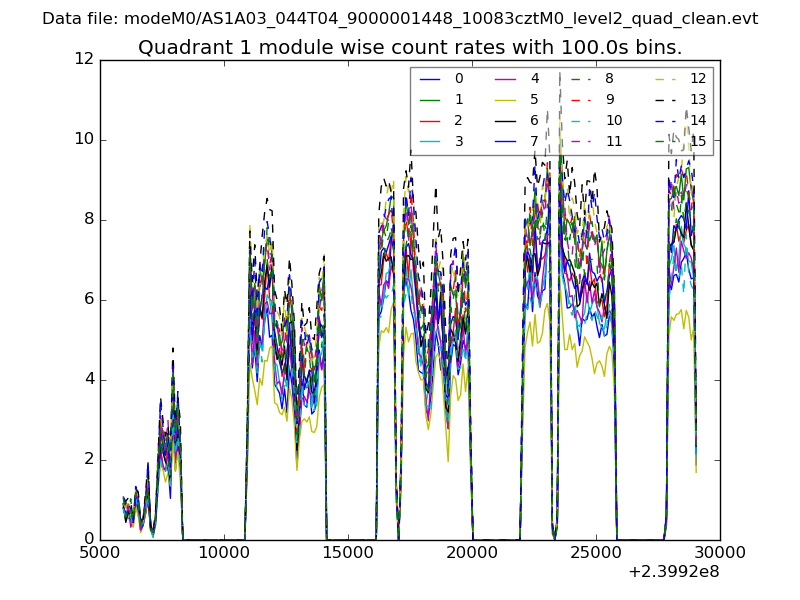
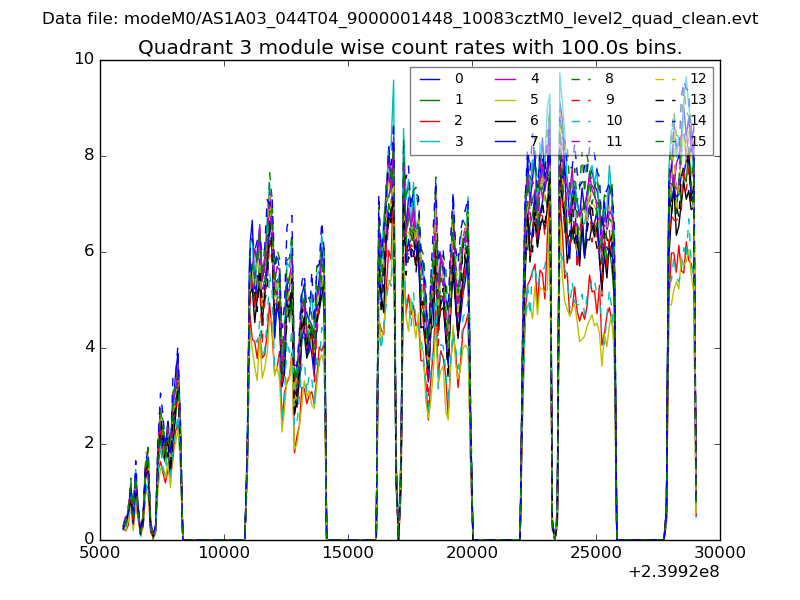
| Module-wise count rates for Quadrant A Data is divided into 100 sec bins |
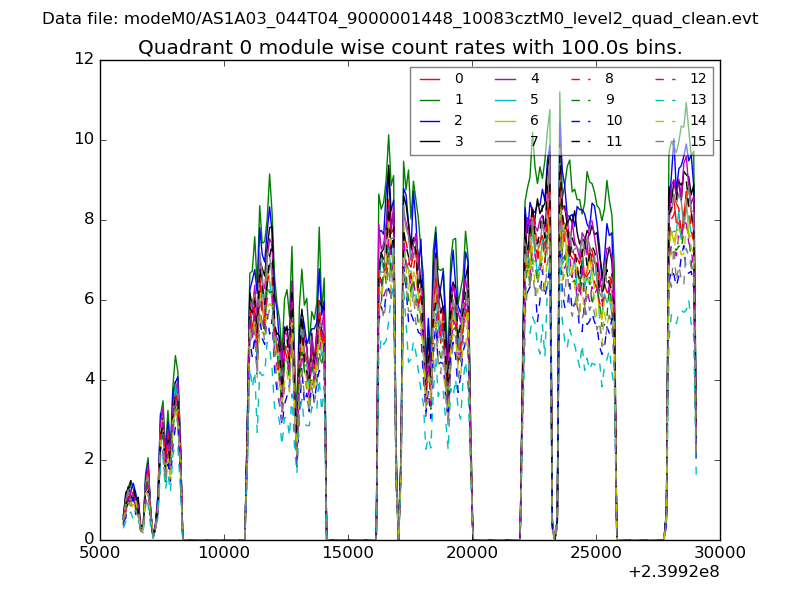 |
 |
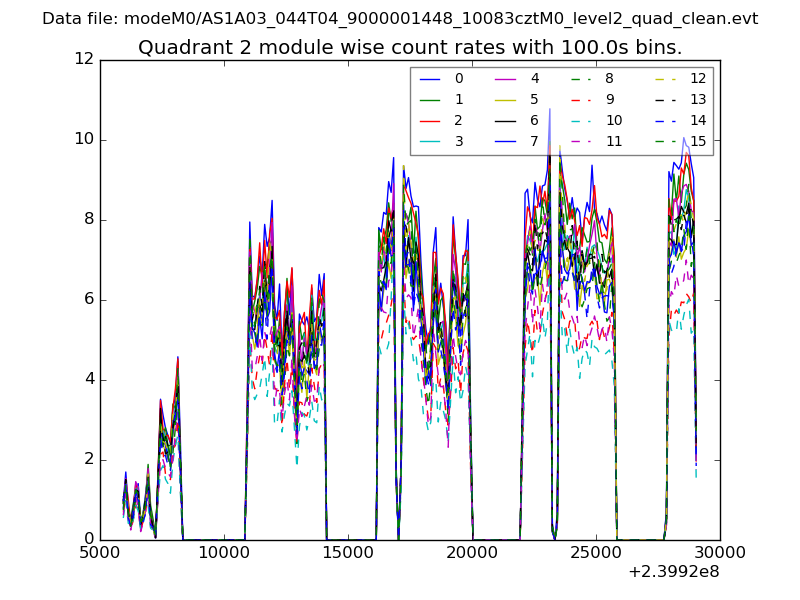
| Module-wise count rates for Quadrant B Data is divided into 100 sec bins |
 |
 |
| Module-wise count rates for Quadrant C Data is divided into 100 sec bins |
 |
 |
| Module-wise count rates for Quadrant D Data is divided into 100 sec bins |
 |
 |
| Parameter | Plot |
|---|---|
| CZT HV Monitor | 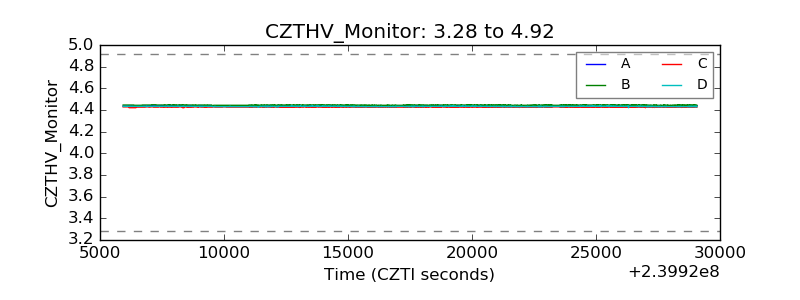 |
| D_VDD | 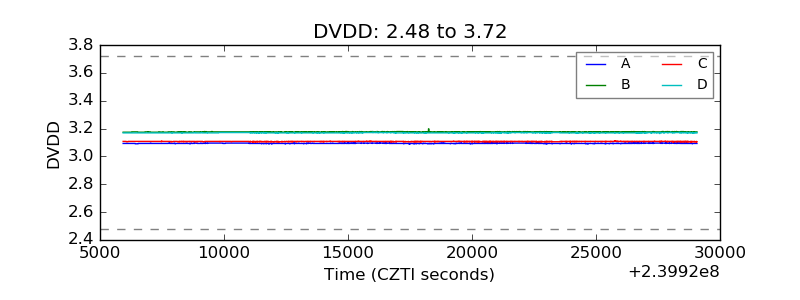 |
| Temperature 1 | 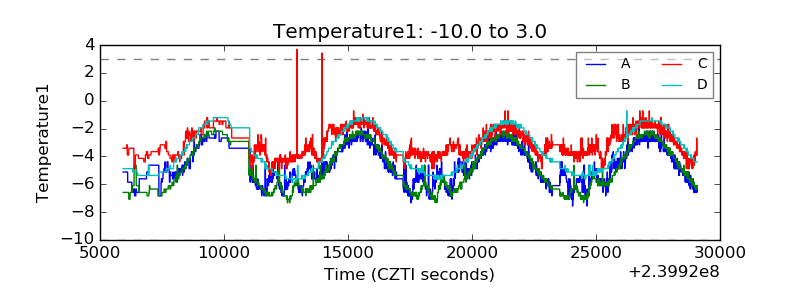 |
| Veto HV Monitor | 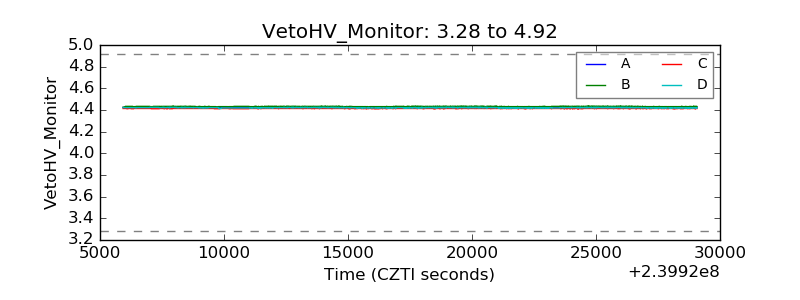 |
| Veto LLD | 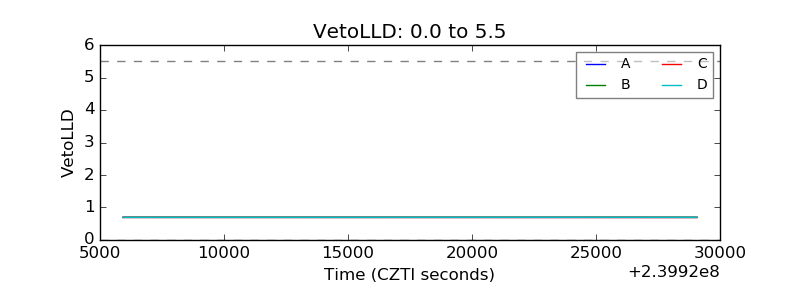 |
| Alpha Counter | 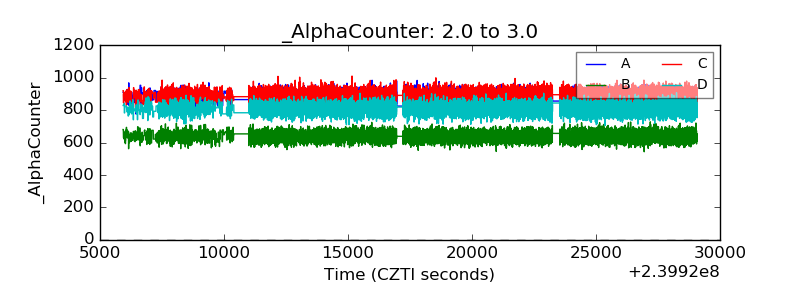 |
| _CPM_Rate | 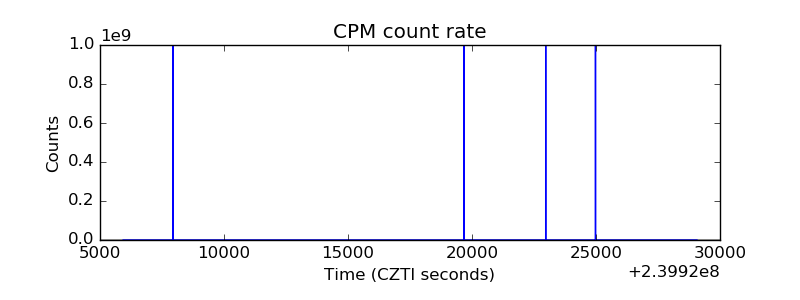 |
| CZT Counter | 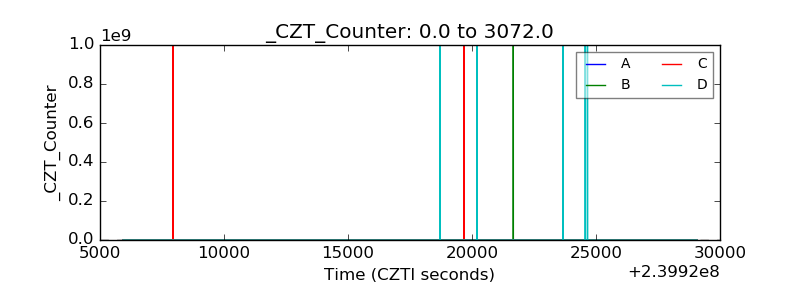 |
| +2.5 Volts monitor |  |
| +5 Volts monitor | 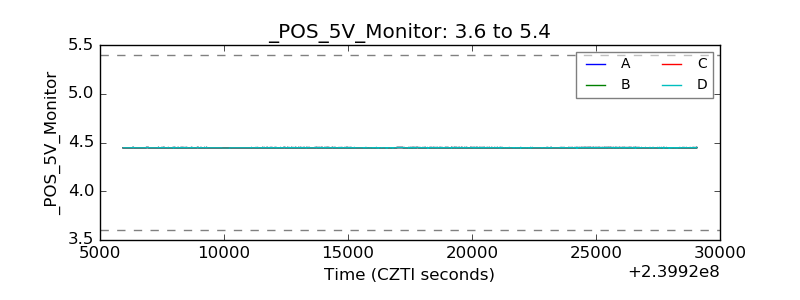 |
| _ROLL_ROT | 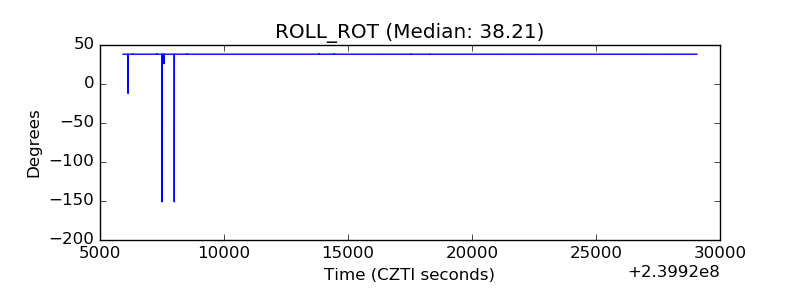 |
| _Roll_DEC | 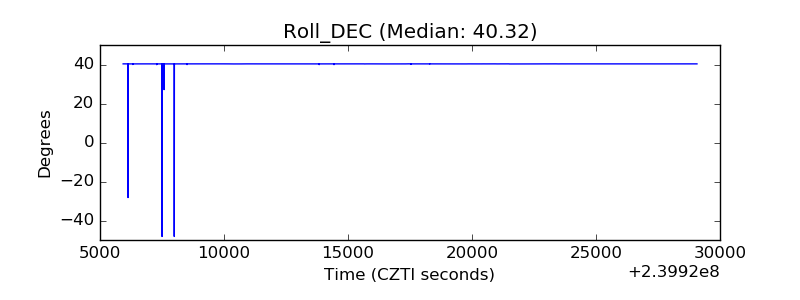 |
| _Roll_RA | 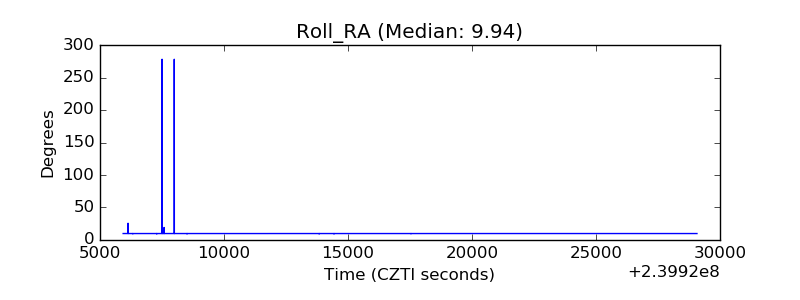 |
| Veto Counter | 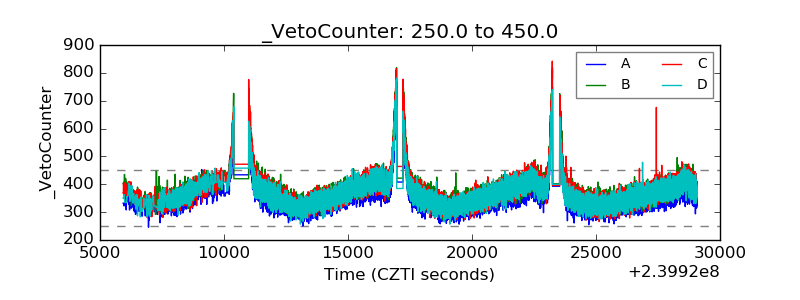 |