| Param | Original file | Final file |
|---|---|---|
| Filename | modeM0/AS1A03_044T04_9000001448_10085cztM0_level2.evt | modeM0/AS1A03_044T04_9000001448_10085cztM0_level2_quad_clean.evt |
| Size (bytes) | 1,468,704,960 | 260,346,240 |
| Size | 1.4 GB | 248.3 MB |
| Events in quadrant A | 10,183,345 | 1,599,586 |
| Events in quadrant B | 10,424,634 | 1,629,131 |
| Events in quadrant C | 9,697,189 | 1,598,081 |
| Events in quadrant D | 12,687,894 | 1,544,625 |
| Mode M0 | |||
|---|---|---|---|
| Quadrant | BADHDUFLAG | Total packets | Discarded packets |
| A | 0 | 46005 | 2 |
| B | 0 | 46321 | 2 |
| C | 0 | 45051 | 2 |
| D | 0 | 52540 | 4 |
| Mode M9 | |||
|---|---|---|---|
| Quadrant | BADHDUFLAG | Total packets | Discarded packets |
| A | 0 | 12 | 0 |
| B | 0 | 12 | 0 |
| C | 0 | 12 | 0 |
| D | 0 | 12 | 0 |
| Mode SS | |||
|---|---|---|---|
| Quadrant | BADHDUFLAG | Total packets | Discarded packets |
| A | 0 | 444 | 0 |
| B | 0 | 444 | 0 |
| C | 0 | 444 | 0 |
| D | 0 | 444 | 0 |
| Quadrant | Total seconds | Saturated seconds | Saturation percentage |
|---|---|---|---|
| A | 21997 | 173 | 0.786471% |
| B | 21997 | 260 | 1.181979% |
| C | 21997 | 95 | 0.431877% |
| D | 21996 | 320 | 1.454810% |
Noise dominated data is calculated using 1-second bins in cleaned event files. If a bin has >2000 counts, and if more than 50% of those come from <1% of pixels, then it is considered to be noise-dominated and hence unusable.
| Quadrant | # 1 sec bins | Bins with >0 counts | Bins with >2000 counts | High rate bins dominated by noise | Noise dominated (total time) | Noise dominated (detector-on time) | Marked lightcurve |
|---|---|---|---|---|---|---|---|
| A | 23142 | 21999 | 6 | 6 | 0.03% | 0.03% | 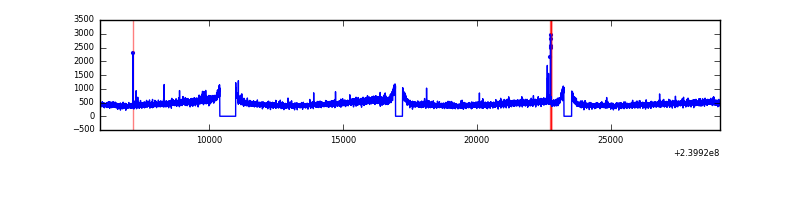 |
| B | 23142 | 22000 | 11 | 11 | 0.05% | 0.05% | 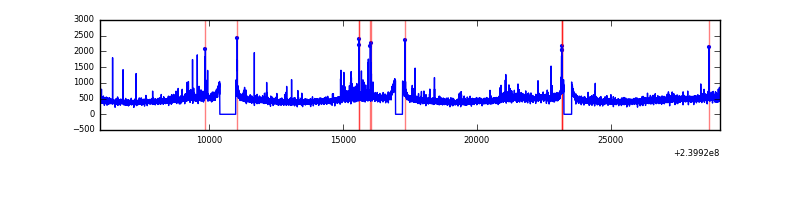 |
| C | 23142 | 22000 | 3 | 3 | 0.01% | 0.01% | 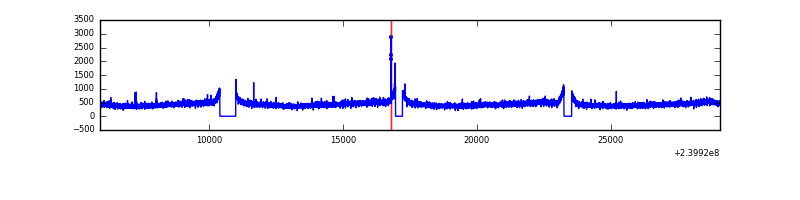 |
| D | 23142 | 21999 | 151 | 151 | 0.65% | 0.69% | 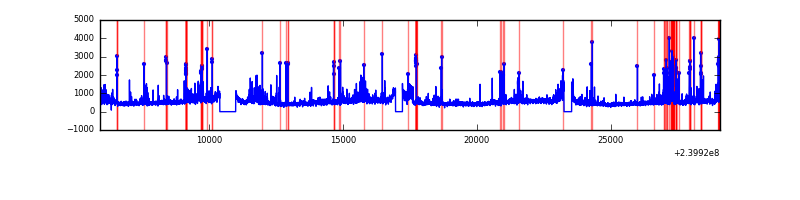 |
Top three noisy pixels from each quadrant. If the there are fewer than three noisy pixels in the level2.evt file, extra rows are filled as -1
| Pixel properties | Quadrant properties | ||||||
|---|---|---|---|---|---|---|---|
| Quadrant | DetID | PixID | Counts | Sigma | Mean | Median | Sigma |
| A | 0 | 8 | 220342 | 424.14 | 2542 | 2487 | 513.6 |
| A | 8 | 15 | 118425 | 225.72 | 2542 | 2487 | 513.6 |
| A | 4 | 2 | 37153 | 67.49 | 2542 | 2487 | 513.6 |
| B | 0 | 214 | 195516 | 392.8 | 2561 | 2493 | 491.4 |
| B | 4 | 239 | 84417 | 166.71 | 2561 | 2493 | 491.4 |
| B | 4 | 81 | 67464 | 132.21 | 2561 | 2493 | 491.4 |
| C | 14 | 234 | 24819 | 39.01 | 2473 | 2482 | 572.6 |
| C | 14 | 67 | 20211 | 30.96 | 2473 | 2482 | 572.6 |
| C | 13 | 61 | 18232 | 27.51 | 2473 | 2482 | 572.6 |
| D | 8 | 195 | 1283529 | 2063.29 | 2446 | 2383 | 620.9 |
| D | 10 | 199 | 760173 | 1220.42 | 2446 | 2383 | 620.9 |
| D | 2 | 152 | 449057 | 719.37 | 2446 | 2383 | 620.9 |
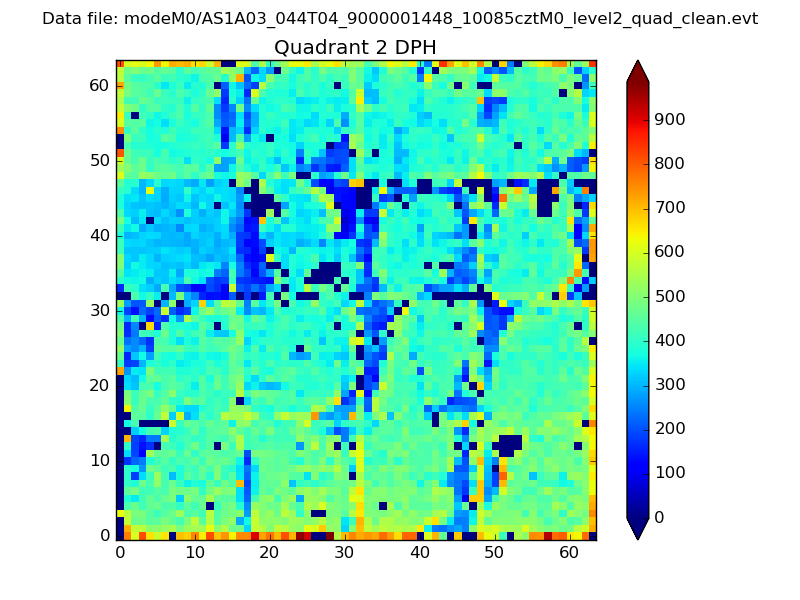
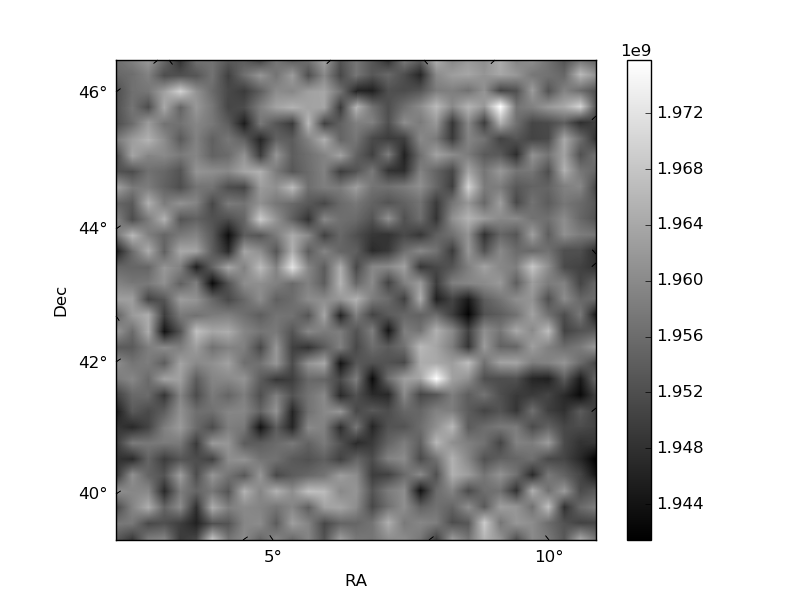
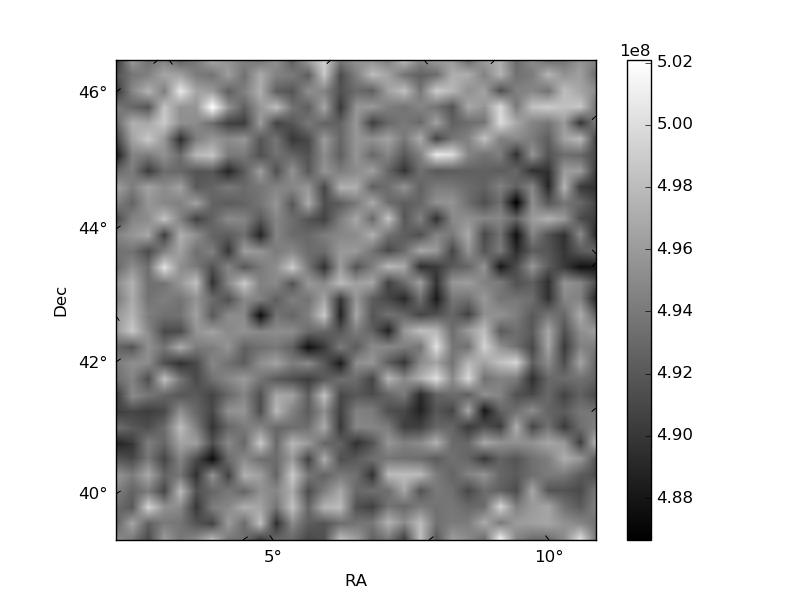
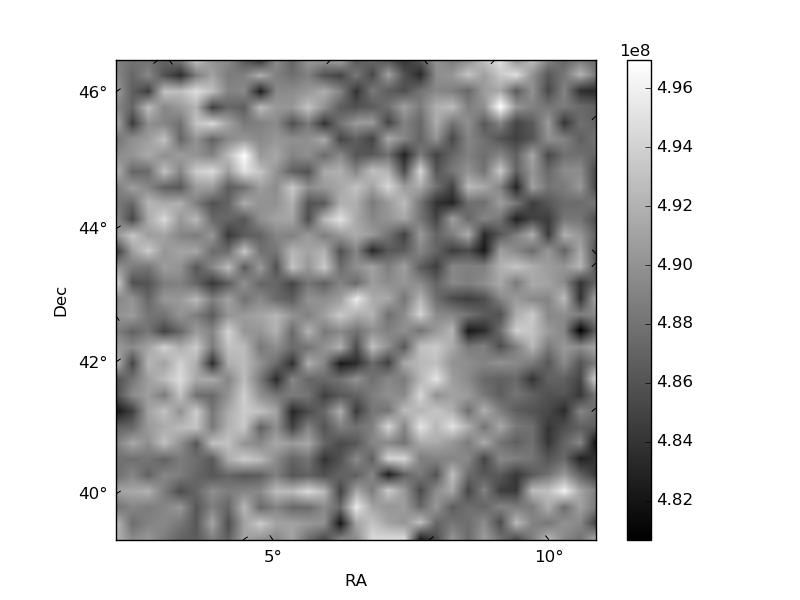
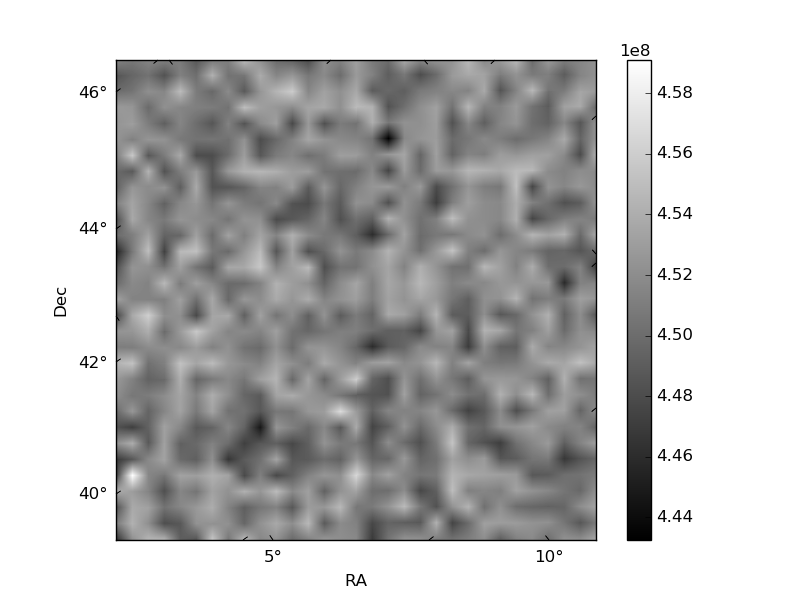
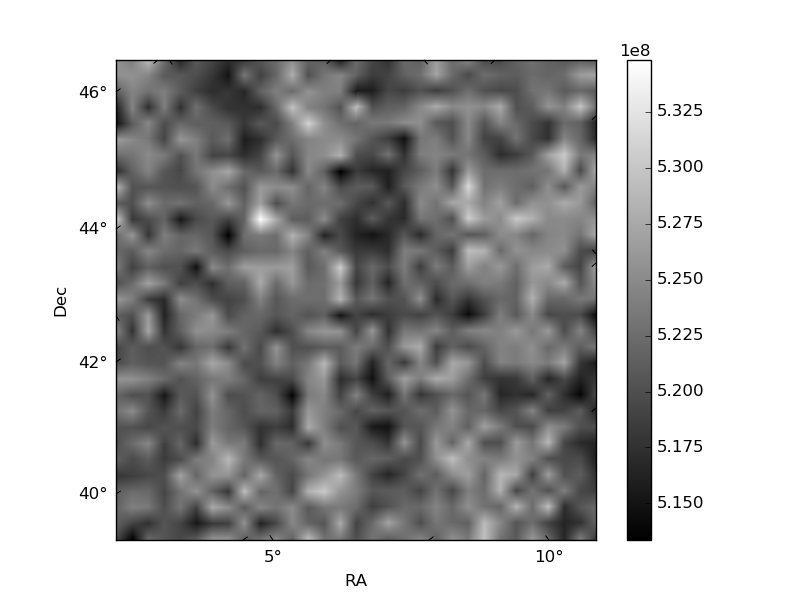
Histogram calculated using DETX and DETY for each event in the final _common_clean file
| Quadrant A | 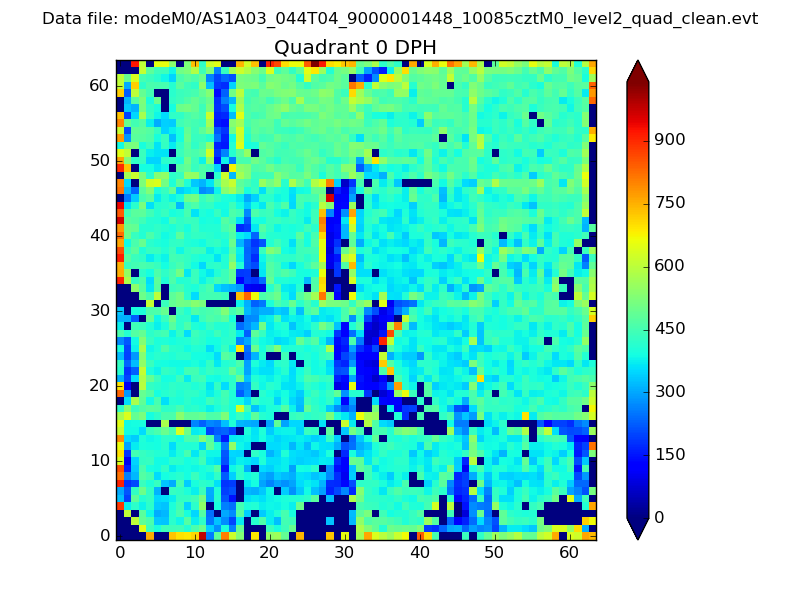 |
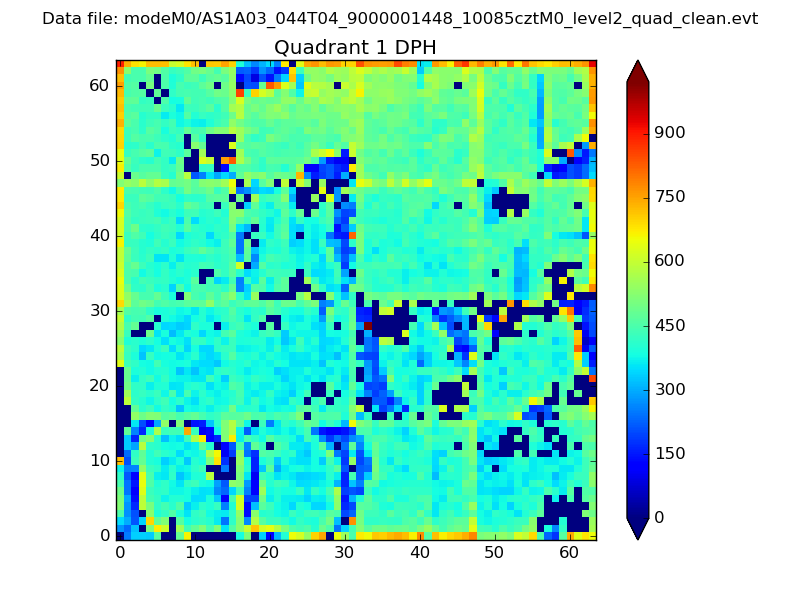 |
Quadrant B |
|---|---|---|---|
| Quadrant D | 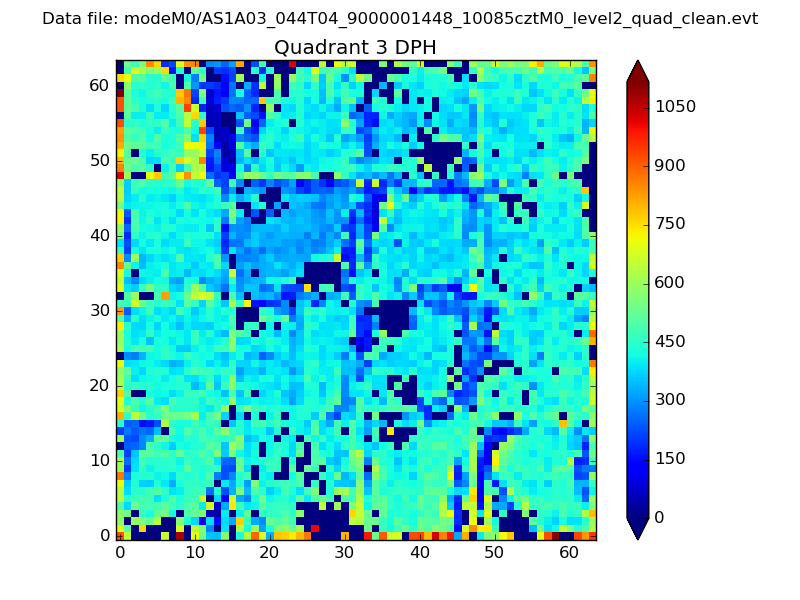 |
 |
Quadrant C |
| Plot type | Count rate plots | Images |
|---|---|---|
| Comparison with Poisson distribution Blue bars denote a histogram of data divided into 1 sec bins. Red curve is a Poisson curve with rate = median count rate of data. |
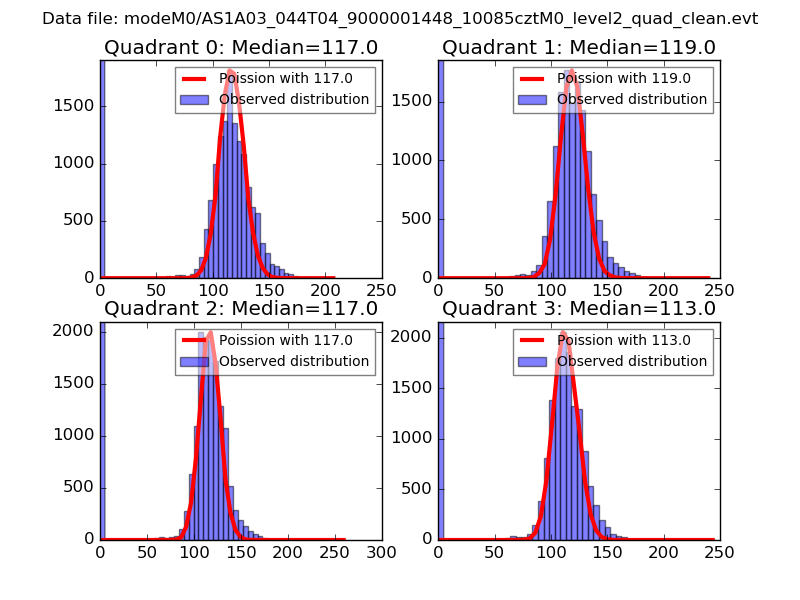 |
 |
| Quadrant-wise count rates Data is divided into 100 sec bins |
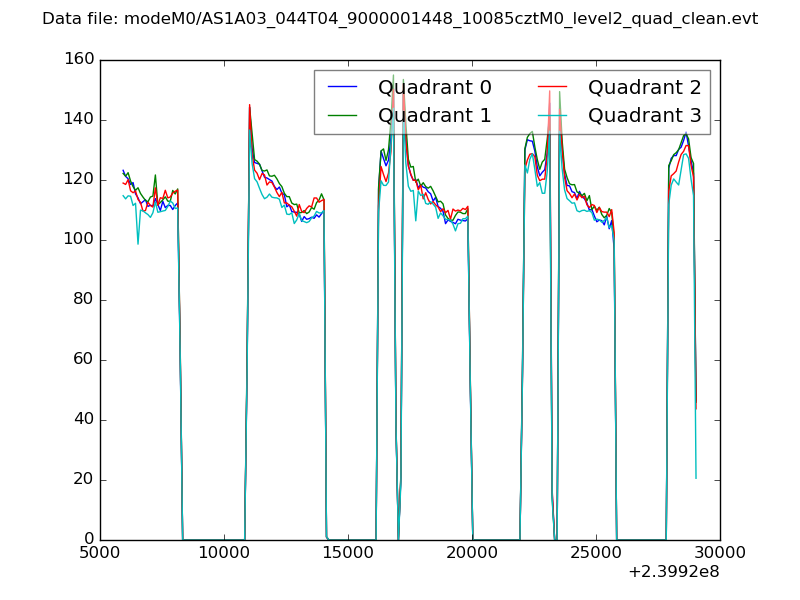 |
|
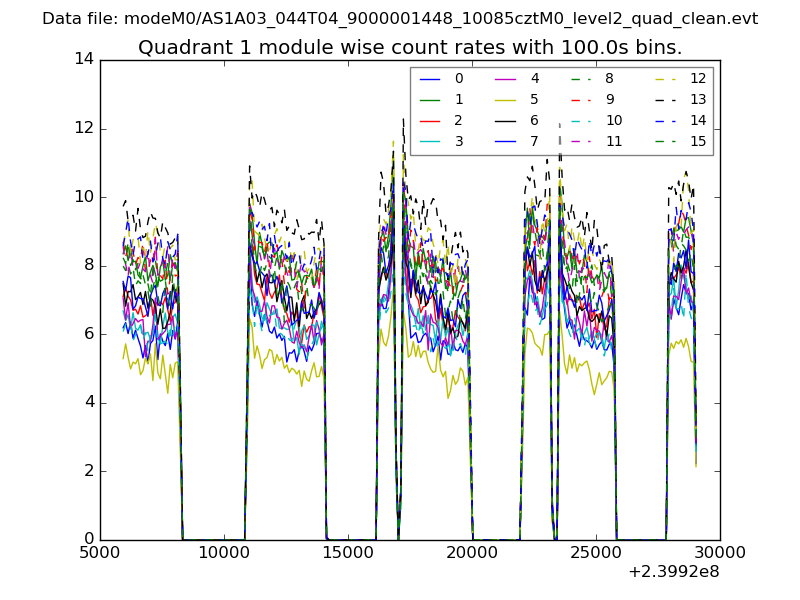
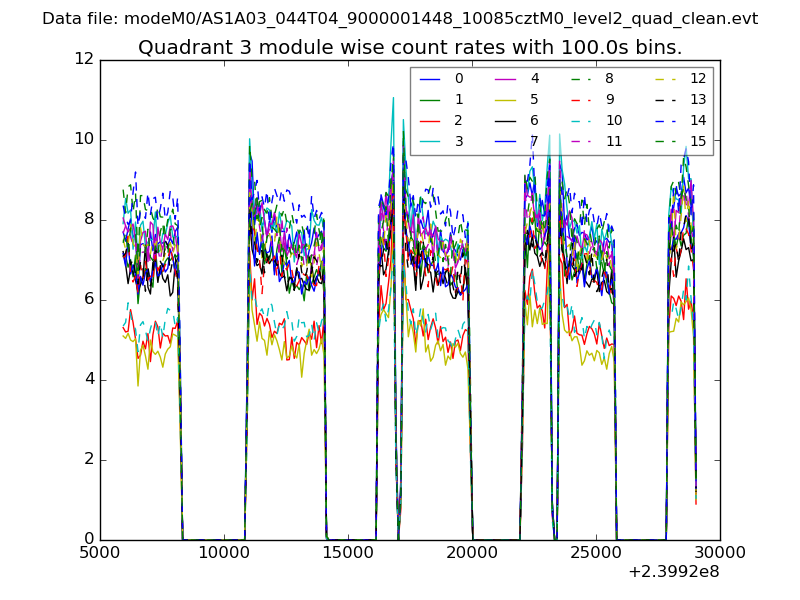
| Module-wise count rates for Quadrant A Data is divided into 100 sec bins |
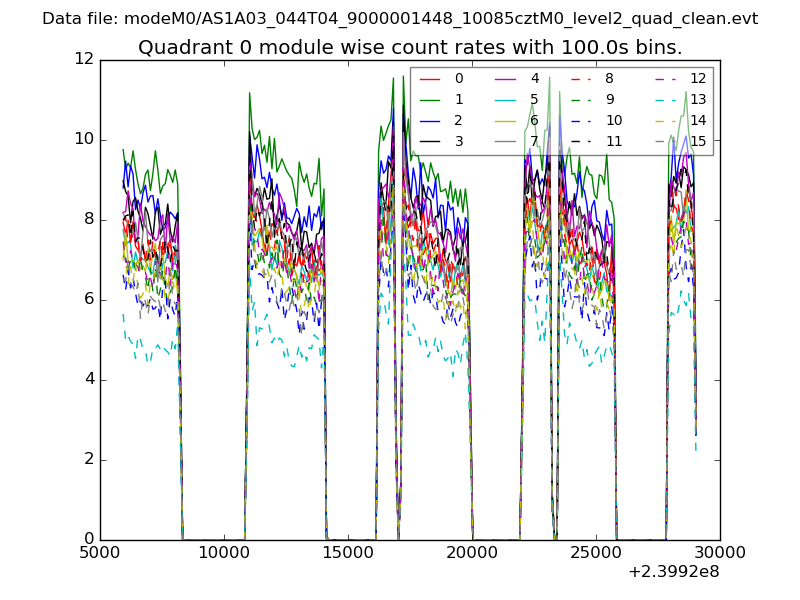 |
 |
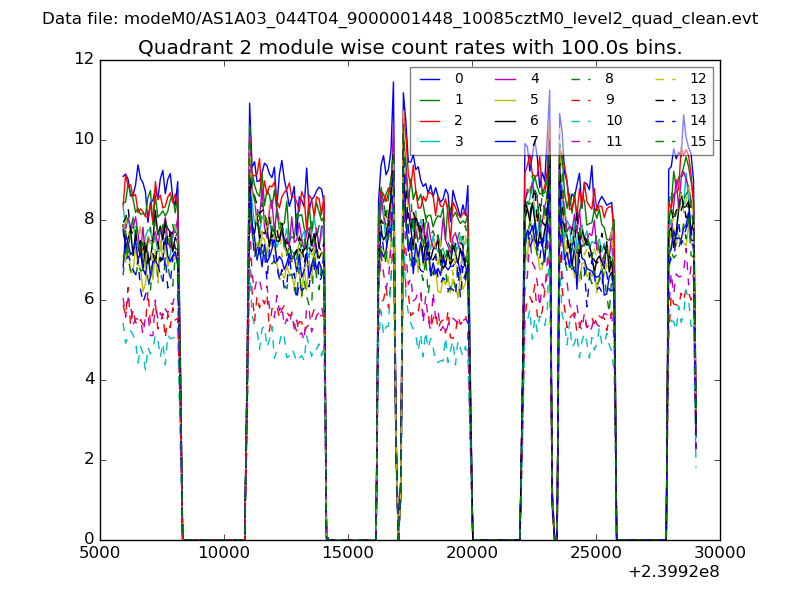
| Module-wise count rates for Quadrant B Data is divided into 100 sec bins |
 |
 |
| Module-wise count rates for Quadrant C Data is divided into 100 sec bins |
 |
 |
| Module-wise count rates for Quadrant D Data is divided into 100 sec bins |
 |
 |
| Parameter | Plot |
|---|---|
| CZT HV Monitor | 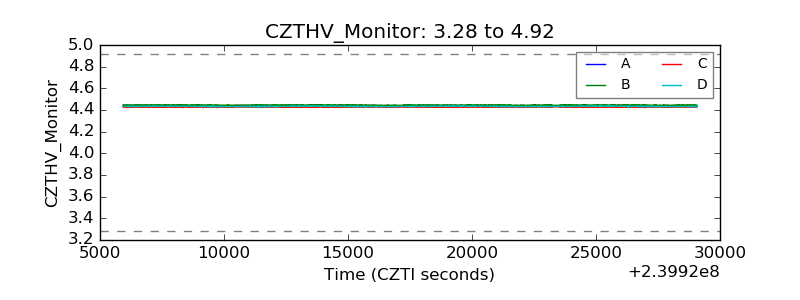 |
| D_VDD | 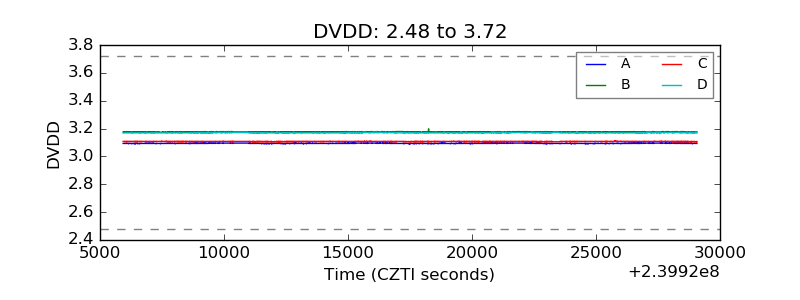 |
| Temperature 1 | 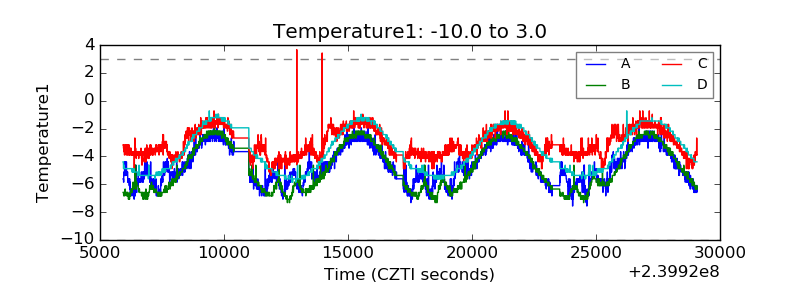 |
| Veto HV Monitor | 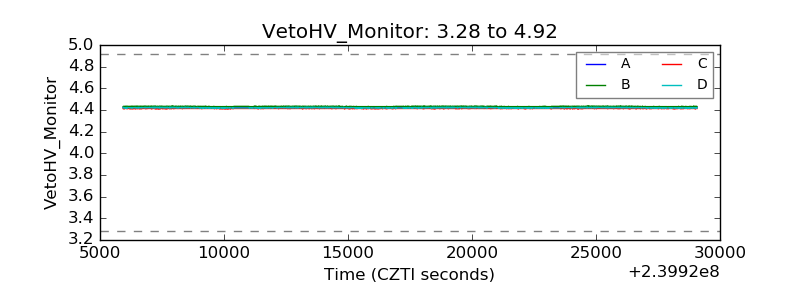 |
| Veto LLD | 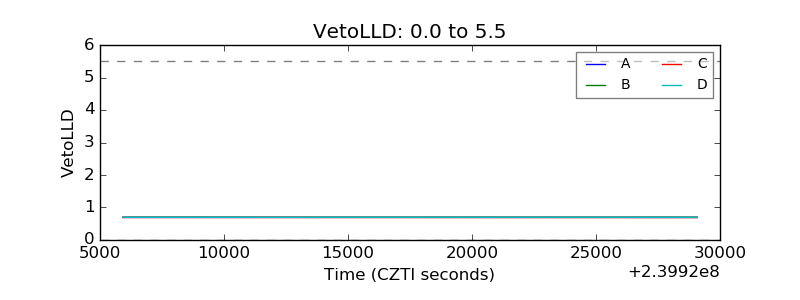 |
| Alpha Counter | 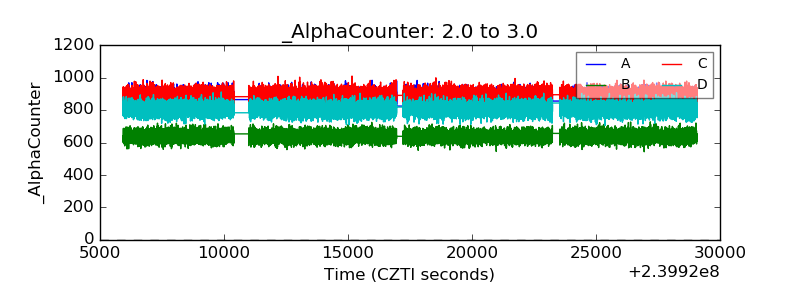 |
| _CPM_Rate | 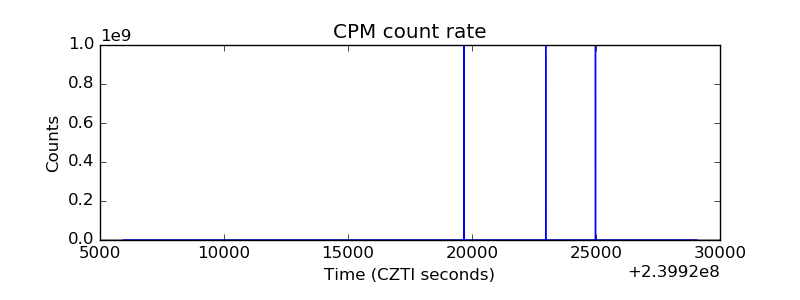 |
| CZT Counter | 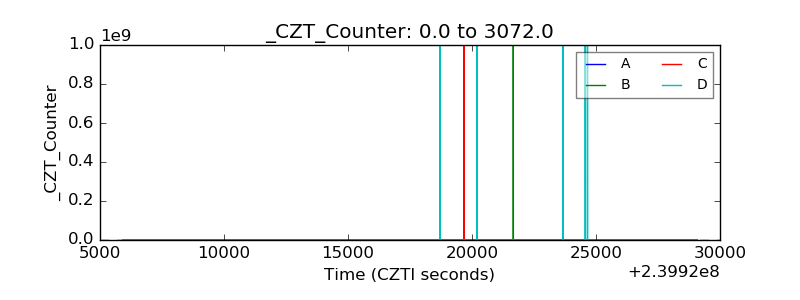 |
| +2.5 Volts monitor | 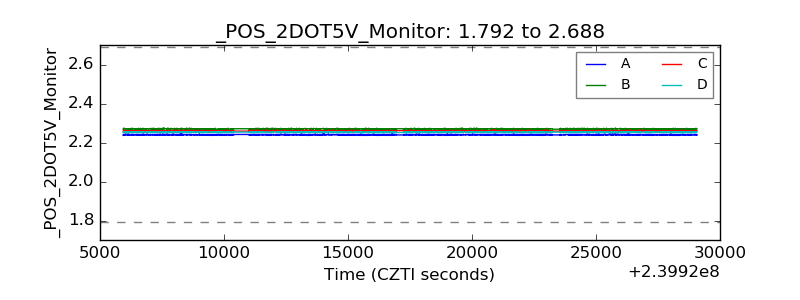 |
| +5 Volts monitor |  |
| _ROLL_ROT | 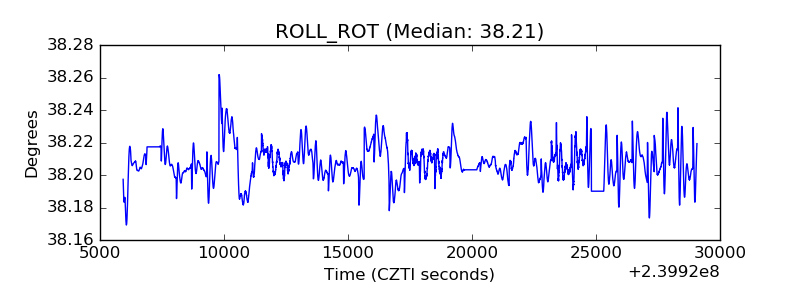 |
| _Roll_DEC | 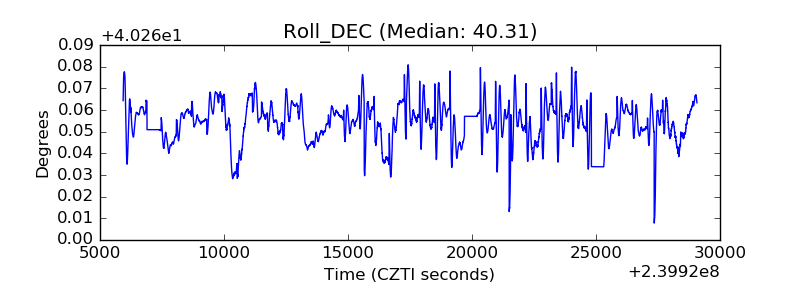 |
| _Roll_RA | 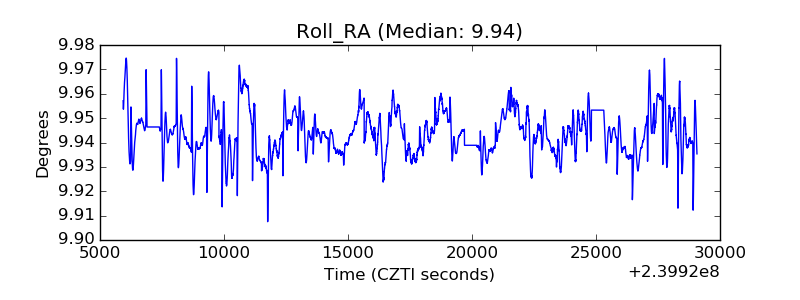 |
| Veto Counter | 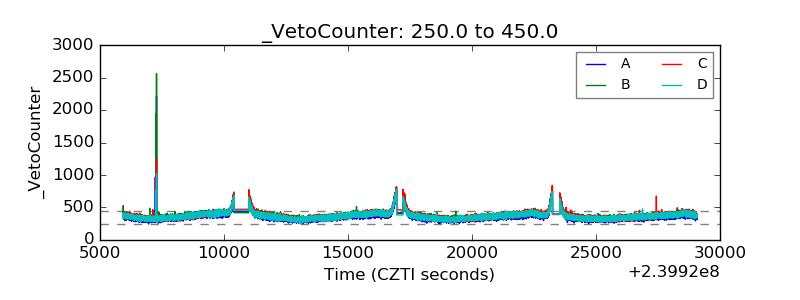 |