| Param | Original file | Final file |
|---|---|---|
| Filename | modeM0/AS1G07_039T01_9000001444_10068cztM0_level2.evt | modeM0/AS1G07_039T01_9000001444_10068cztM0_level2_quad_clean.evt |
| Size (bytes) | 331,269,120 | 58,818,240 |
| Size | 315.9 MB | 56.1 MB |
| Events in quadrant A | 2,348,988 | 363,743 |
| Events in quadrant B | 2,390,625 | 367,760 |
| Events in quadrant C | 2,260,492 | 368,430 |
| Events in quadrant D | 2,692,590 | 332,881 |
| Mode M0 | |||
|---|---|---|---|
| Quadrant | BADHDUFLAG | Total packets | Discarded packets |
| A | 0 | 13955 | 3757 |
| B | 0 | 14025 | 3823 |
| C | 0 | 13864 | 3768 |
| D | 0 | 15915 | 4982 |
| Mode M9 | |||
|---|---|---|---|
| Quadrant | BADHDUFLAG | Total packets | Discarded packets |
| A | 0 | 13 | 5 |
| B | 0 | 13 | 2 |
| C | 0 | 13 | 4 |
| D | 0 | 13 | 4 |
| Mode SS | |||
|---|---|---|---|
| Quadrant | BADHDUFLAG | Total packets | Discarded packets |
| A | 0 | 138 | 46 |
| B | 0 | 139 | 33 |
| C | 0 | 140 | 32 |
| D | 0 | 140 | 36 |
| Quadrant | Total seconds | Saturated seconds | Saturation percentage |
|---|---|---|---|
| A | 4990 | 48 | 0.961924% |
| B | 4973 | 54 | 1.085864% |
| C | 4973 | 40 | 0.804343% |
| D | 4822 | 65 | 1.347988% |
Noise dominated data is calculated using 1-second bins in cleaned event files. If a bin has >2000 counts, and if more than 50% of those come from <1% of pixels, then it is considered to be noise-dominated and hence unusable.
| Quadrant | # 1 sec bins | Bins with >0 counts | Bins with >2000 counts | High rate bins dominated by noise | Noise dominated (total time) | Noise dominated (detector-on time) | Marked lightcurve |
|---|---|---|---|---|---|---|---|
| A | 7714 | 6043 | 0 | 0 | 0.00% | 0.00% | 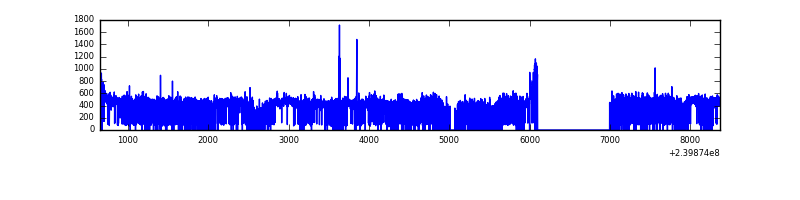 |
| B | 7715 | 6041 | 1 | 1 | 0.01% | 0.02% | 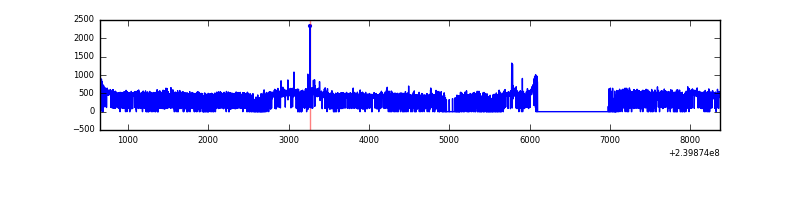 |
| C | 7715 | 6008 | 0 | 0 | 0.00% | 0.00% | 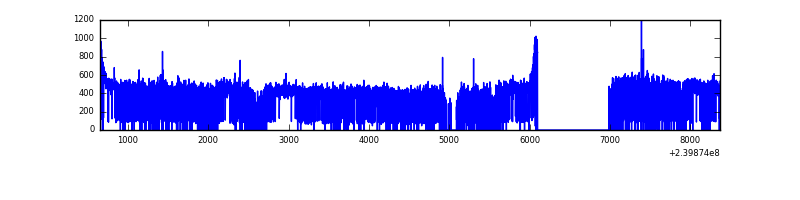 |
| D | 7715 | 5918 | 23 | 23 | 0.30% | 0.39% | 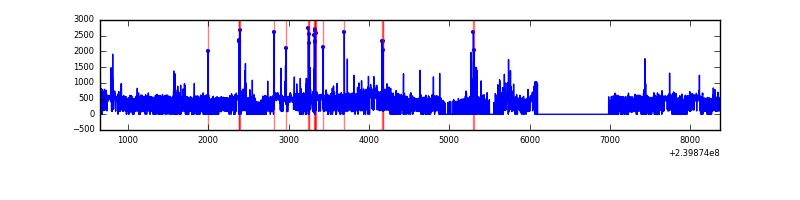 |
Top three noisy pixels from each quadrant. If the there are fewer than three noisy pixels in the level2.evt file, extra rows are filled as -1
| Pixel properties | Quadrant properties | ||||||
|---|---|---|---|---|---|---|---|
| Quadrant | DetID | PixID | Counts | Sigma | Mean | Median | Sigma |
| A | 8 | 15 | 25652 | 206.16 | 592 | 580 | 121.6 |
| A | 0 | 8 | 17527 | 139.35 | 592 | 580 | 121.6 |
| A | 8 | 5 | 15839 | 125.47 | 592 | 580 | 121.6 |
| B | 0 | 214 | 46461 | 400.0 | 593 | 580 | 114.7 |
| B | 0 | 219 | 18441 | 155.72 | 593 | 580 | 114.7 |
| B | 12 | 111 | 12538 | 104.25 | 593 | 580 | 114.7 |
| C | 14 | 234 | 6871 | 46.93 | 575 | 577 | 134.1 |
| C | 14 | 67 | 6053 | 40.83 | 575 | 577 | 134.1 |
| C | 8 | 222 | 4375 | 28.32 | 575 | 577 | 134.1 |
| D | 8 | 195 | 229335 | 1667.42 | 552 | 537 | 137.2 |
| D | 2 | 152 | 83279 | 603.0 | 552 | 537 | 137.2 |
| D | 10 | 199 | 78083 | 565.13 | 552 | 537 | 137.2 |
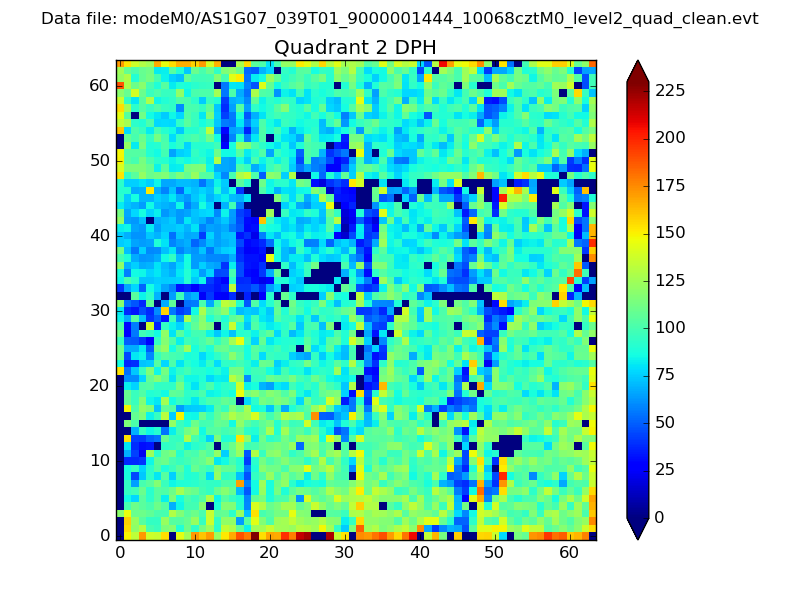
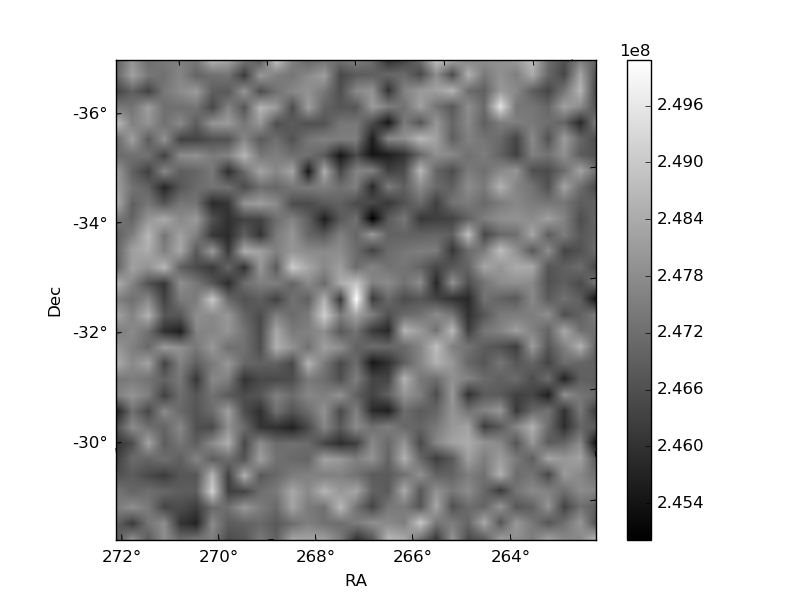
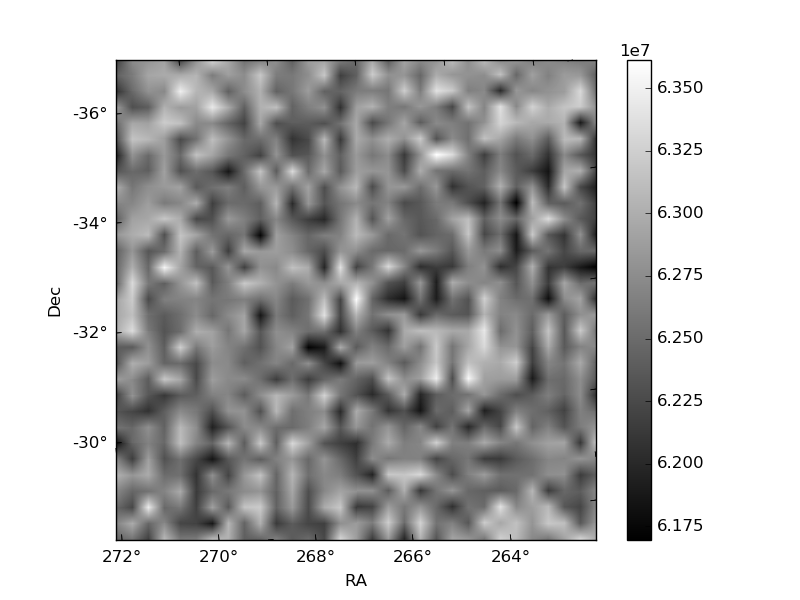
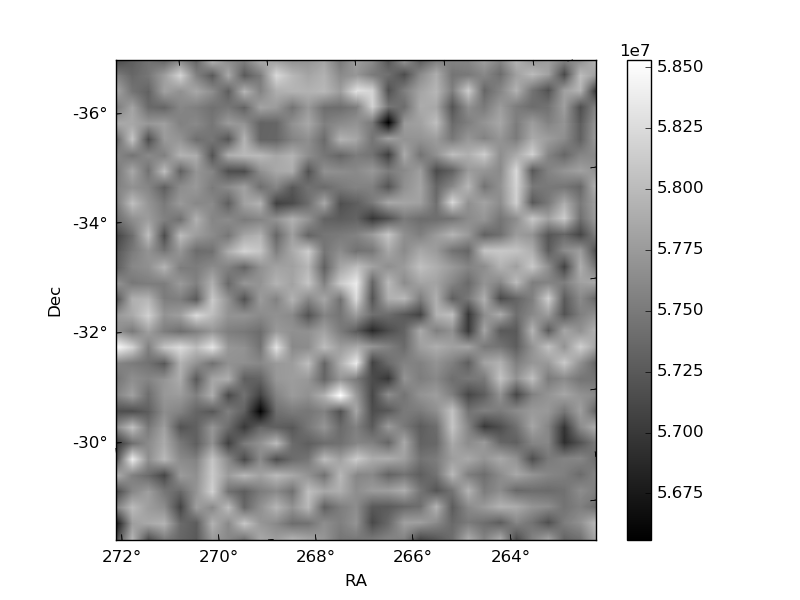
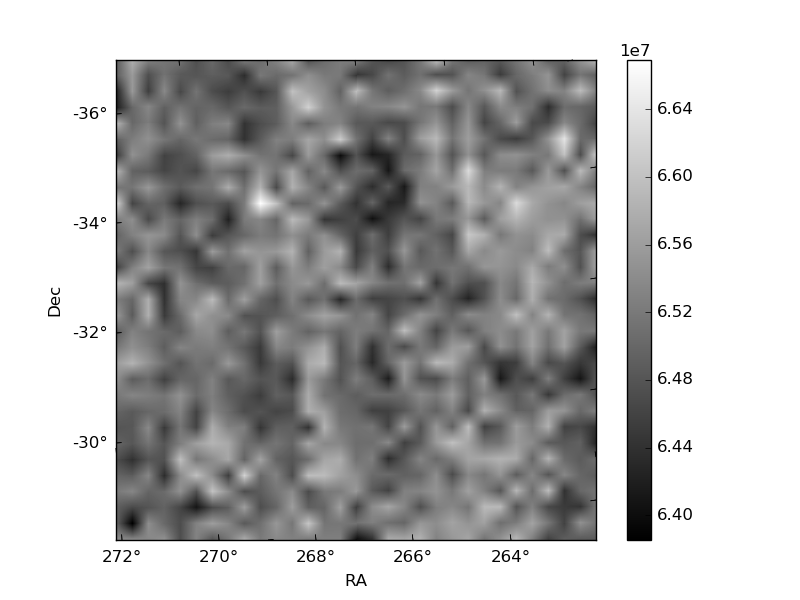
Histogram calculated using DETX and DETY for each event in the final _common_clean file
| Quadrant A | 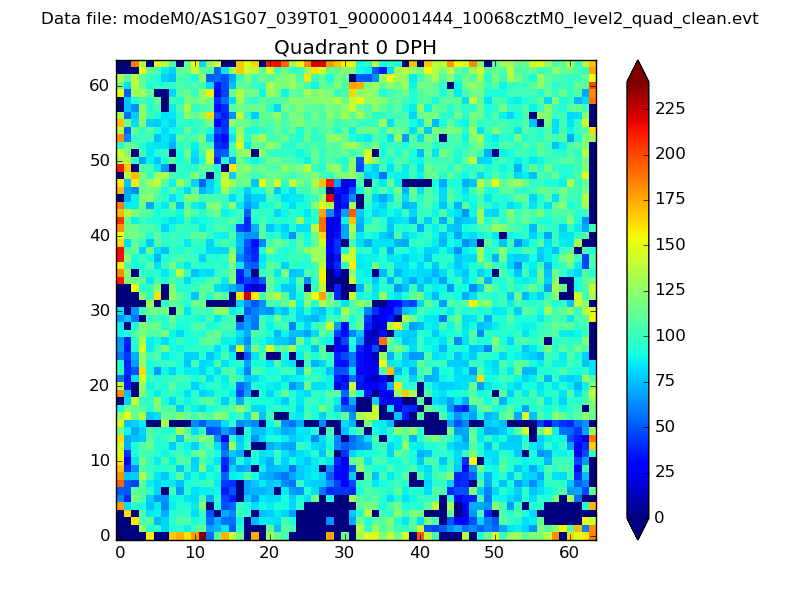 |
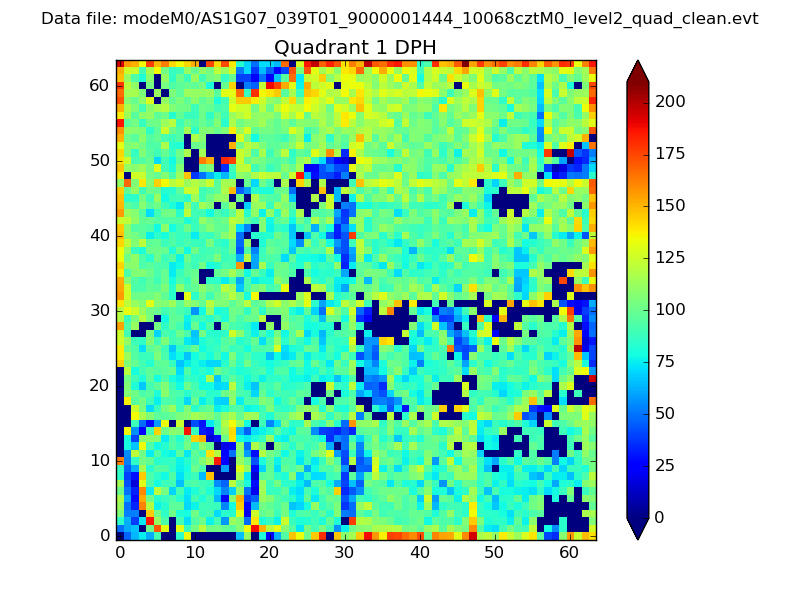 |
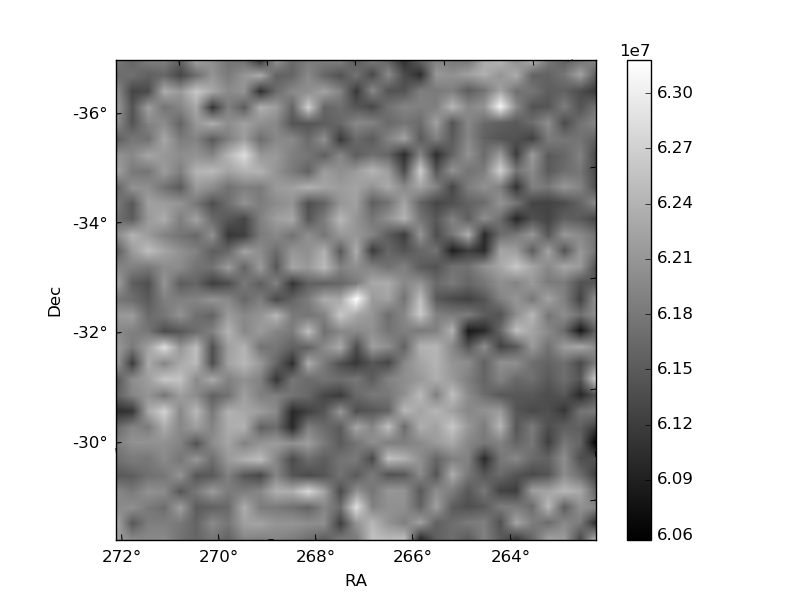
Quadrant B |
|---|---|---|---|
| Quadrant D | 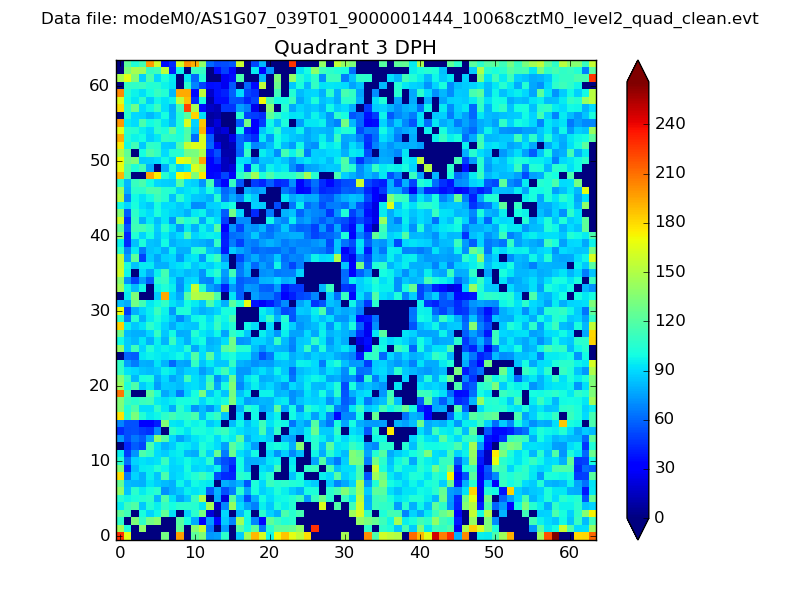 |
 |
Quadrant C |
| Plot type | Count rate plots | Images |
|---|---|---|
| Comparison with Poisson distribution Blue bars denote a histogram of data divided into 1 sec bins. Red curve is a Poisson curve with rate = median count rate of data. |
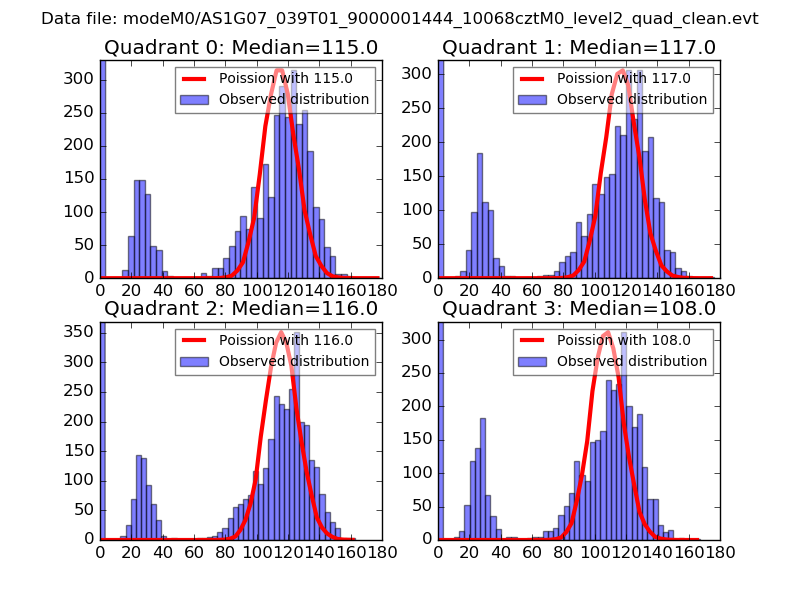 |
 |
| Quadrant-wise count rates Data is divided into 100 sec bins |
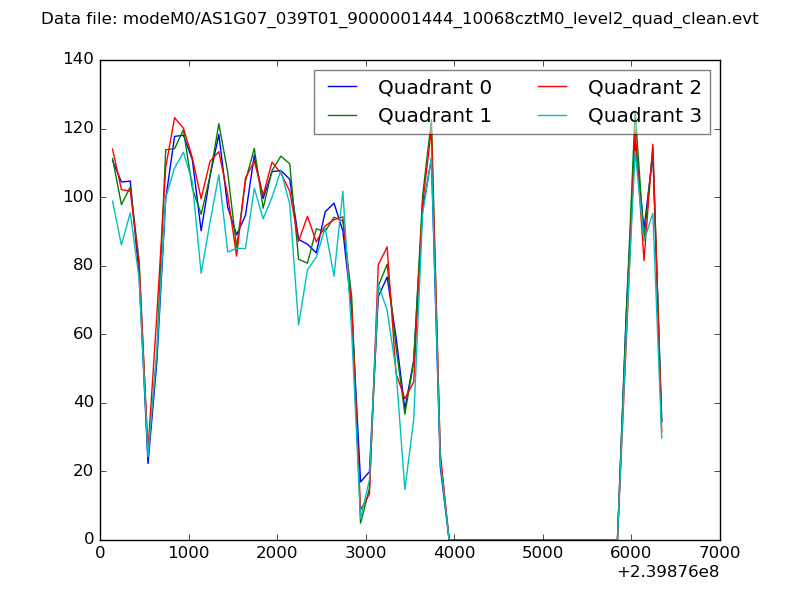 |
|
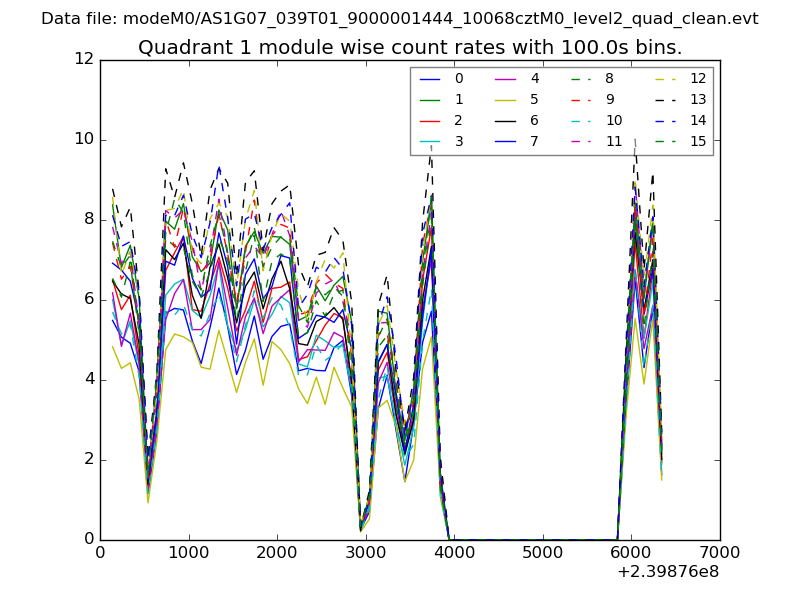
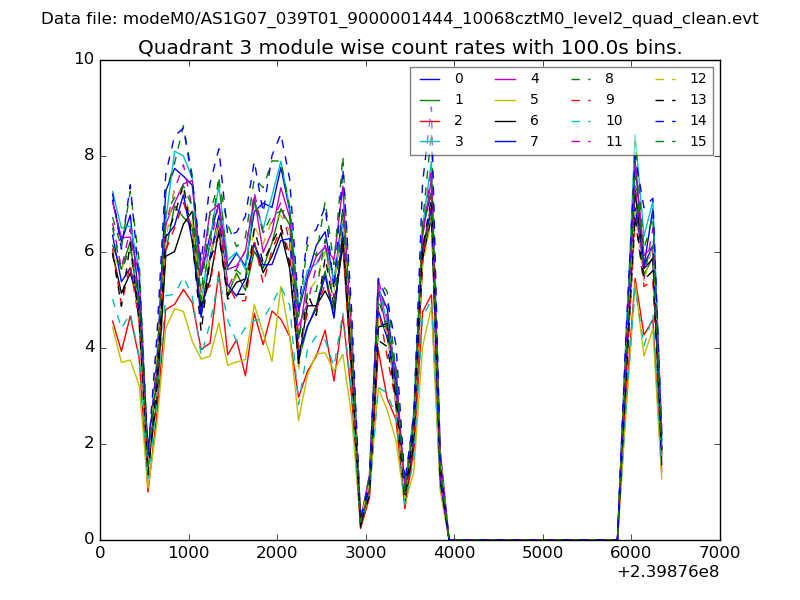
| Module-wise count rates for Quadrant A Data is divided into 100 sec bins |
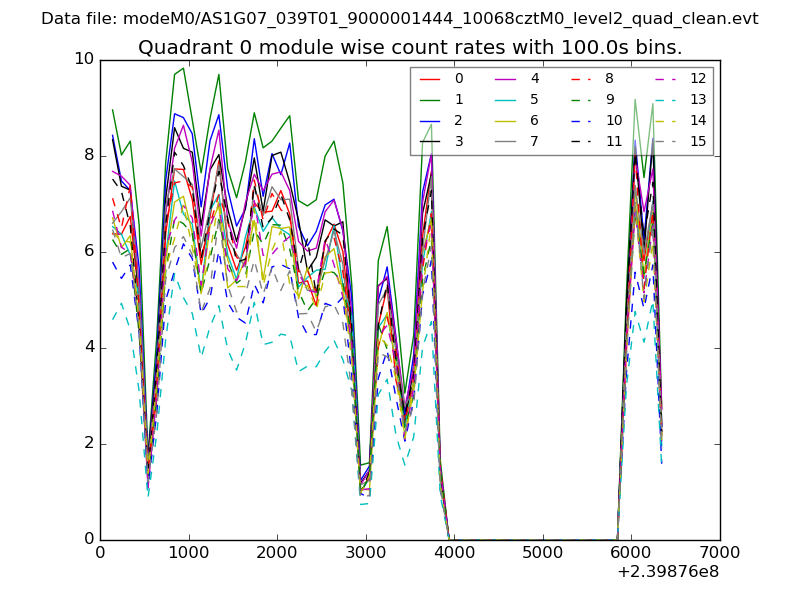 |
 |
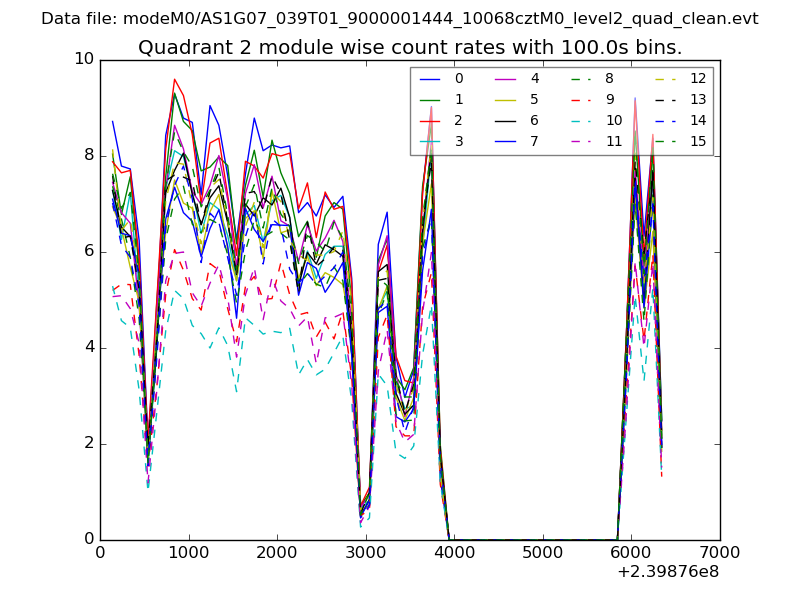
| Module-wise count rates for Quadrant B Data is divided into 100 sec bins |
 |
 |
| Module-wise count rates for Quadrant C Data is divided into 100 sec bins |
 |
 |
| Module-wise count rates for Quadrant D Data is divided into 100 sec bins |
 |
 |
| Parameter | Plot |
|---|---|
| CZT HV Monitor | 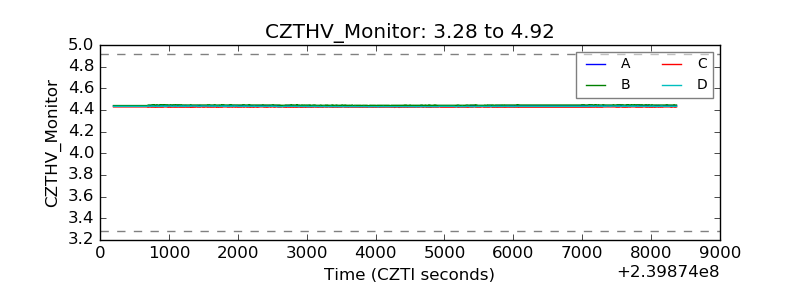 |
| D_VDD | 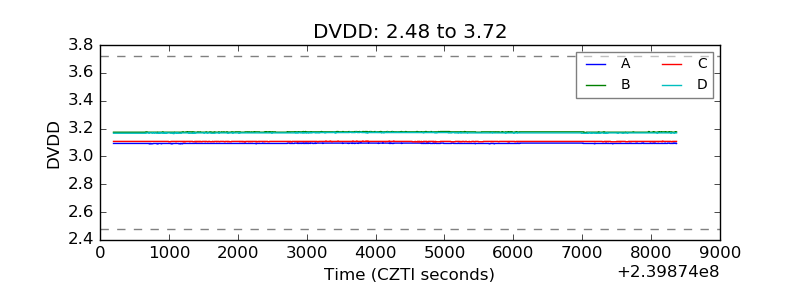 |
| Temperature 1 | 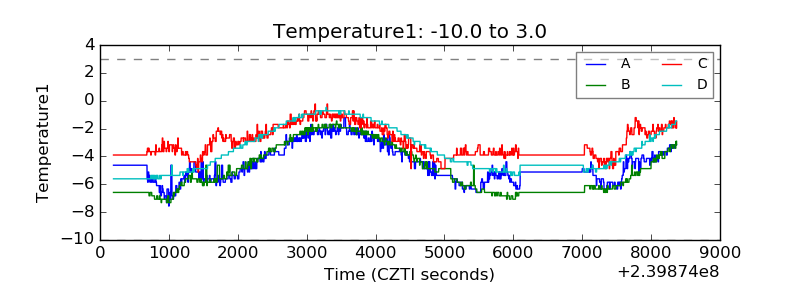 |
| Veto HV Monitor | 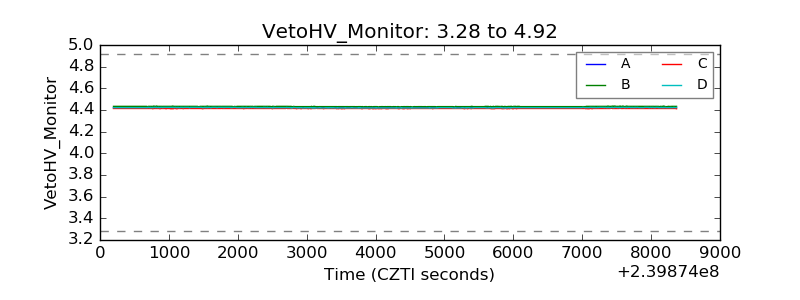 |
| Veto LLD | 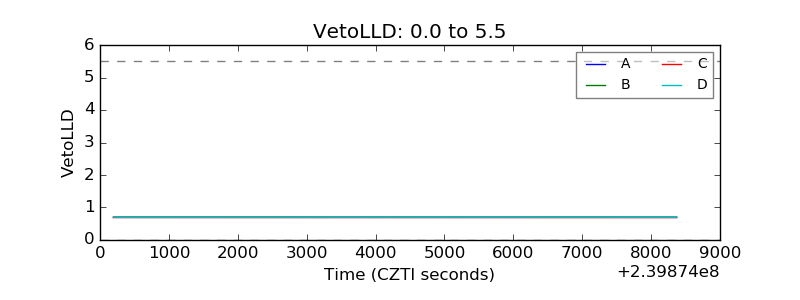 |
| Alpha Counter | 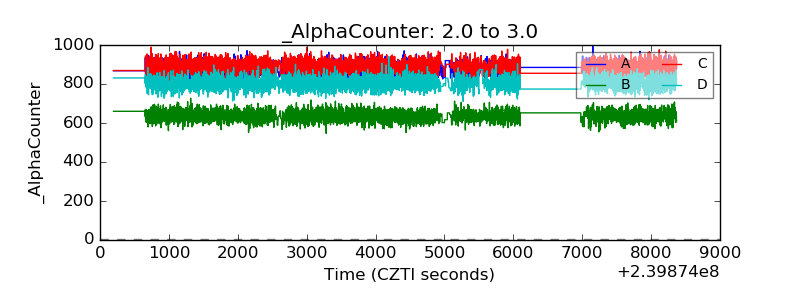 |
| _CPM_Rate |  |
| CZT Counter | 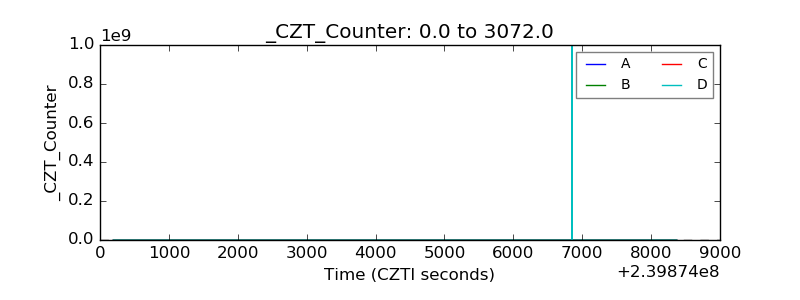 |
| +2.5 Volts monitor |  |
| +5 Volts monitor |  |
| _ROLL_ROT | 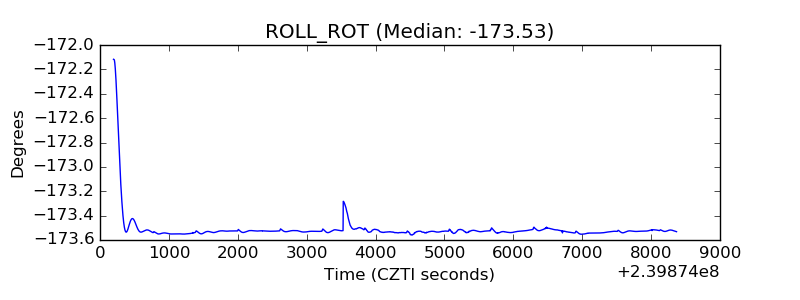 |
| _Roll_DEC | 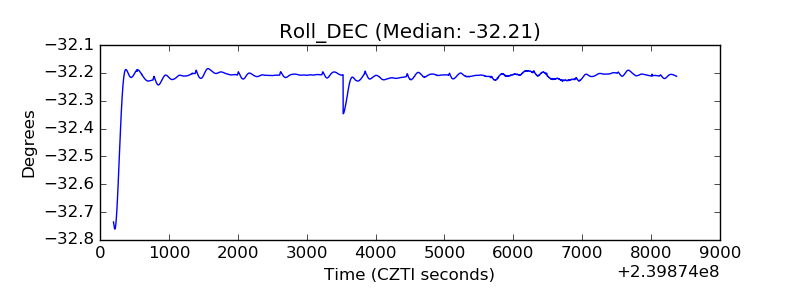 |
| _Roll_RA | 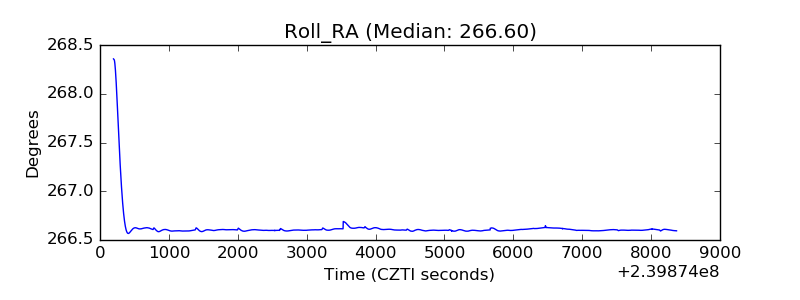 |
| Veto Counter | 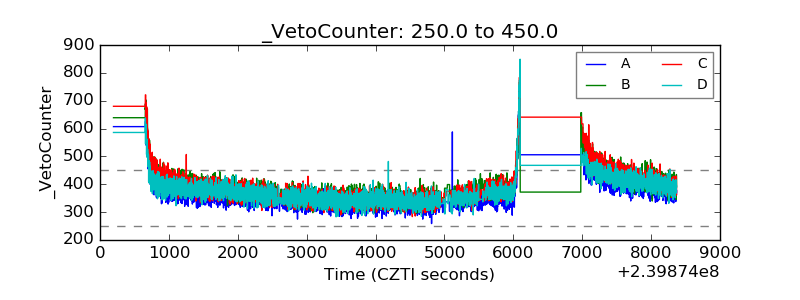 |