| Param | Original file | Final file |
|---|---|---|
| Filename | modeM0/AS1G07_039T01_9000001444_10069cztM0_level2.evt | modeM0/AS1G07_039T01_9000001444_10069cztM0_level2_quad_clean.evt |
| Size (bytes) | 822,689,280 | 164,373,120 |
| Size | 784.6 MB | 156.8 MB |
| Events in quadrant A | 5,709,359 | 1,039,779 |
| Events in quadrant B | 6,024,575 | 1,057,138 |
| Events in quadrant C | 5,552,901 | 1,045,011 |
| Events in quadrant D | 6,800,653 | 991,506 |
| Mode M0 | |||
|---|---|---|---|
| Quadrant | BADHDUFLAG | Total packets | Discarded packets |
| A | 0 | 25037 | 10 |
| B | 0 | 25532 | 5 |
| C | 0 | 24896 | 7 |
| D | 0 | 27858 | 7 |
| Mode M9 | |||
|---|---|---|---|
| Quadrant | BADHDUFLAG | Total packets | Discarded packets |
| A | 0 | 23 | 0 |
| B | 0 | 23 | 0 |
| C | 0 | 23 | 0 |
| D | 0 | 23 | 0 |
| Mode SS | |||
|---|---|---|---|
| Quadrant | BADHDUFLAG | Total packets | Discarded packets |
| A | 0 | 250 | 0 |
| B | 0 | 250 | 0 |
| C | 0 | 250 | 0 |
| D | 0 | 250 | 0 |
| Quadrant | Total seconds | Saturated seconds | Saturation percentage |
|---|---|---|---|
| A | 12214 | 120 | 0.982479% |
| B | 12216 | 143 | 1.170596% |
| C | 12215 | 105 | 0.859599% |
| D | 12215 | 203 | 1.661891% |
Noise dominated data is calculated using 1-second bins in cleaned event files. If a bin has >2000 counts, and if more than 50% of those come from <1% of pixels, then it is considered to be noise-dominated and hence unusable.
| Quadrant | # 1 sec bins | Bins with >0 counts | Bins with >2000 counts | High rate bins dominated by noise | Noise dominated (total time) | Noise dominated (detector-on time) | Marked lightcurve |
|---|---|---|---|---|---|---|---|
| A | 14102 | 12217 | 1 | 1 | 0.01% | 0.01% | 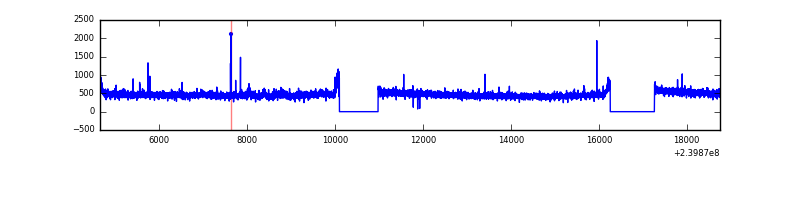 |
| B | 14102 | 12217 | 10 | 10 | 0.07% | 0.08% | 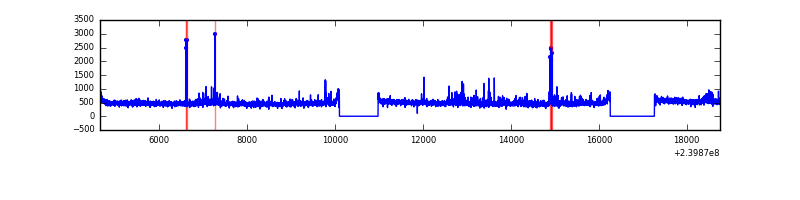 |
| C | 14102 | 12217 | 1 | 1 | 0.01% | 0.01% | 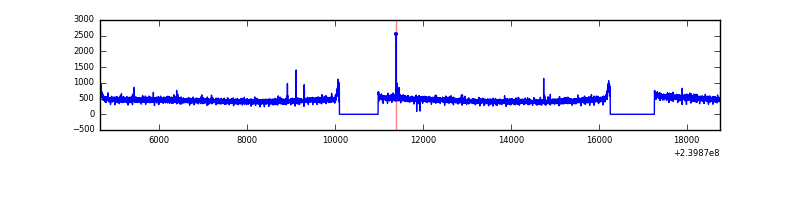 |
| D | 14102 | 12217 | 97 | 97 | 0.69% | 0.79% | 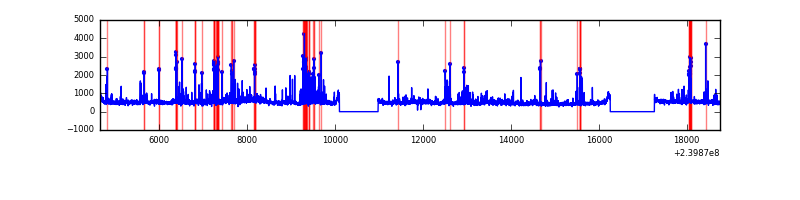 |
Top three noisy pixels from each quadrant. If the there are fewer than three noisy pixels in the level2.evt file, extra rows are filled as -1
| Pixel properties | Quadrant properties | ||||||
|---|---|---|---|---|---|---|---|
| Quadrant | DetID | PixID | Counts | Sigma | Mean | Median | Sigma |
| A | 8 | 15 | 34044 | 110.85 | 1458 | 1429 | 294.2 |
| A | 8 | 5 | 28482 | 91.94 | 1458 | 1429 | 294.2 |
| A | 0 | 8 | 25078 | 80.37 | 1458 | 1429 | 294.2 |
| B | 0 | 214 | 153313 | 545.8 | 1462 | 1429 | 278.3 |
| B | 4 | 239 | 48600 | 169.51 | 1462 | 1429 | 278.3 |
| B | 0 | 219 | 44463 | 154.64 | 1462 | 1429 | 278.3 |
| C | 14 | 234 | 15609 | 43.26 | 1415 | 1423 | 327.9 |
| C | 14 | 67 | 15579 | 43.17 | 1415 | 1423 | 327.9 |
| C | 13 | 61 | 10526 | 27.76 | 1415 | 1423 | 327.9 |
| D | 8 | 195 | 437873 | 1238.06 | 1402 | 1361 | 352.6 |
| D | 10 | 199 | 231338 | 652.27 | 1402 | 1361 | 352.6 |
| D | 12 | 233 | 215268 | 606.69 | 1402 | 1361 | 352.6 |
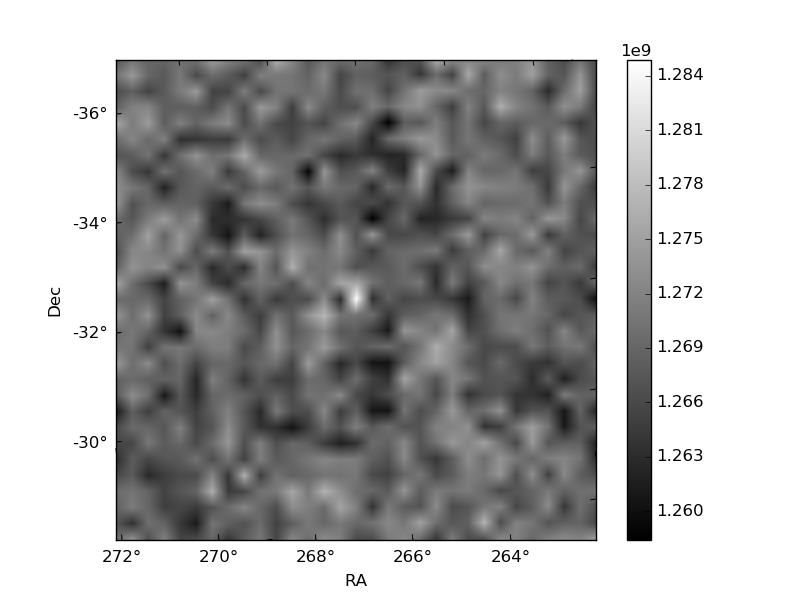
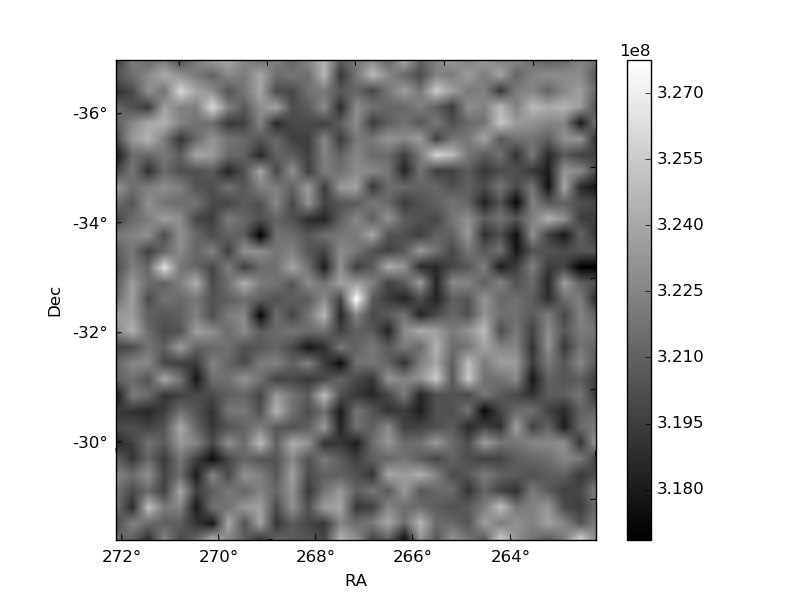
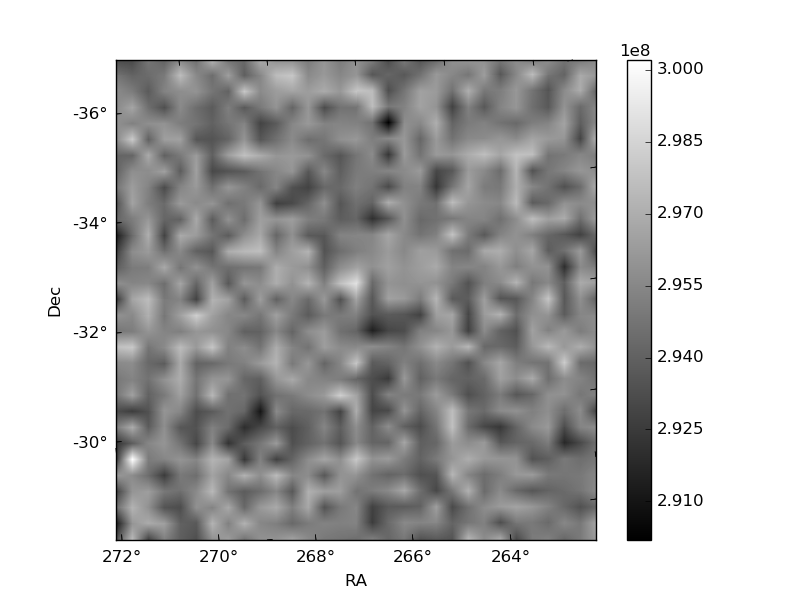
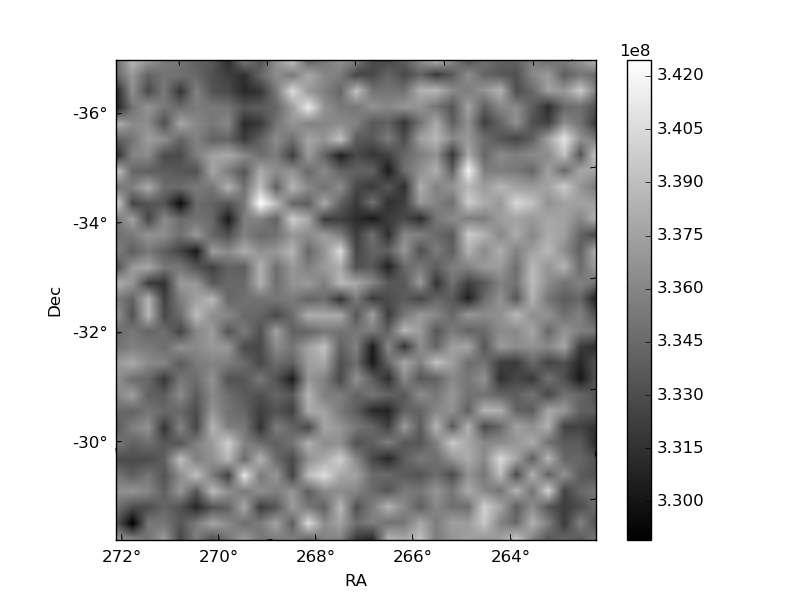
Histogram calculated using DETX and DETY for each event in the final _common_clean file
| Quadrant A | 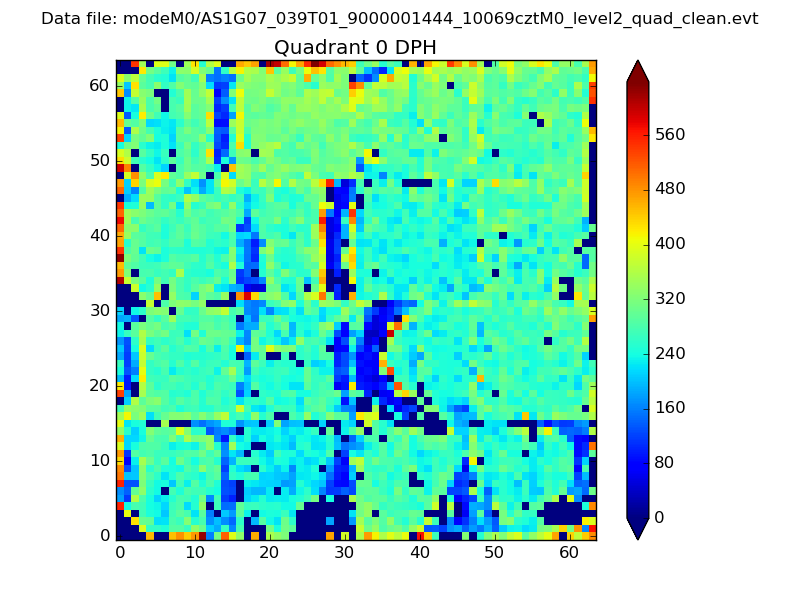 |
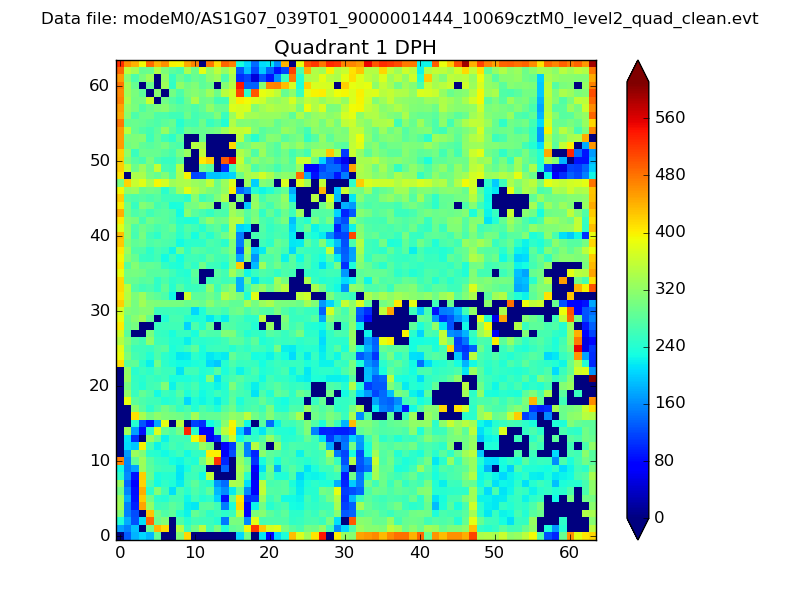 |
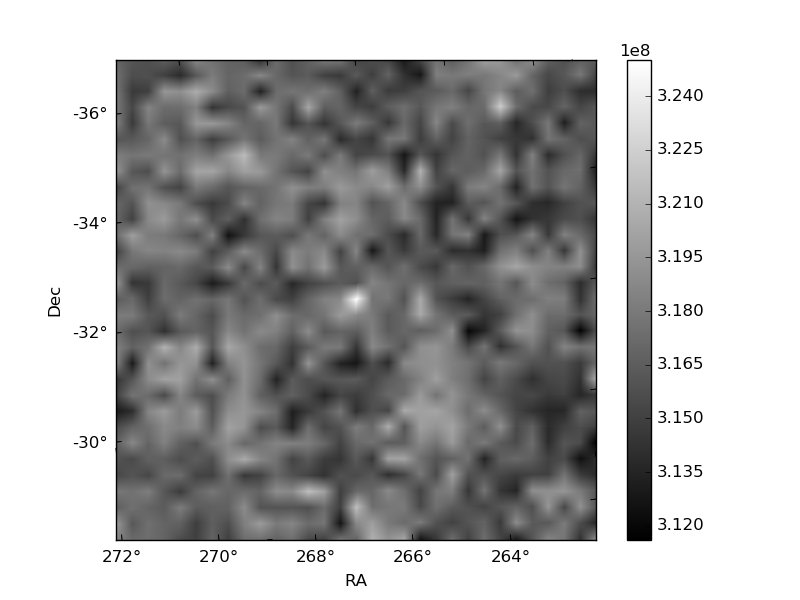
Quadrant B |
|---|---|---|---|
| Quadrant D | 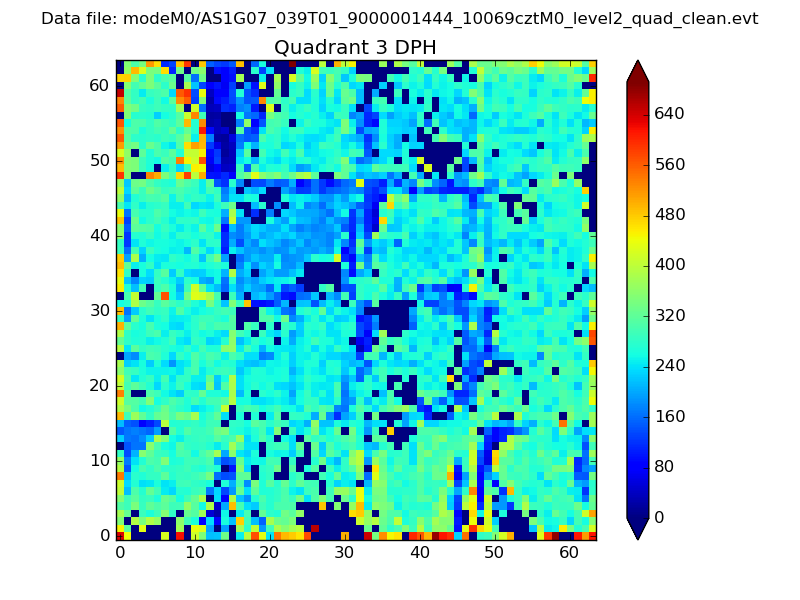 |
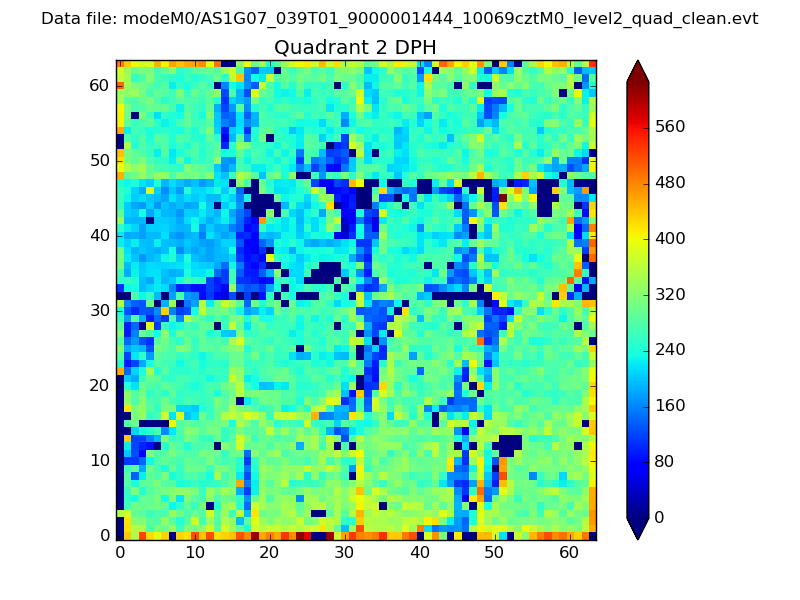 |
Quadrant C |
| Plot type | Count rate plots | Images |
|---|---|---|
| Comparison with Poisson distribution Blue bars denote a histogram of data divided into 1 sec bins. Red curve is a Poisson curve with rate = median count rate of data. |
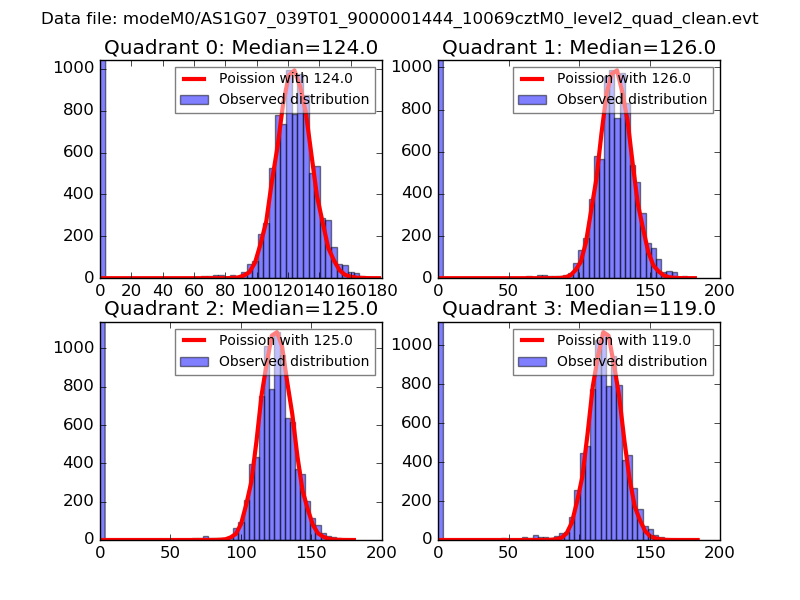 |
 |
| Quadrant-wise count rates Data is divided into 100 sec bins |
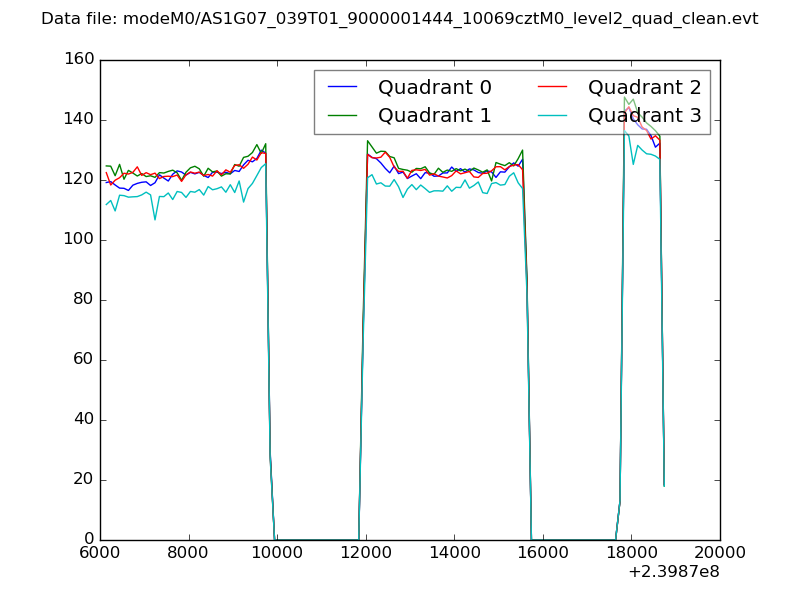 |
|
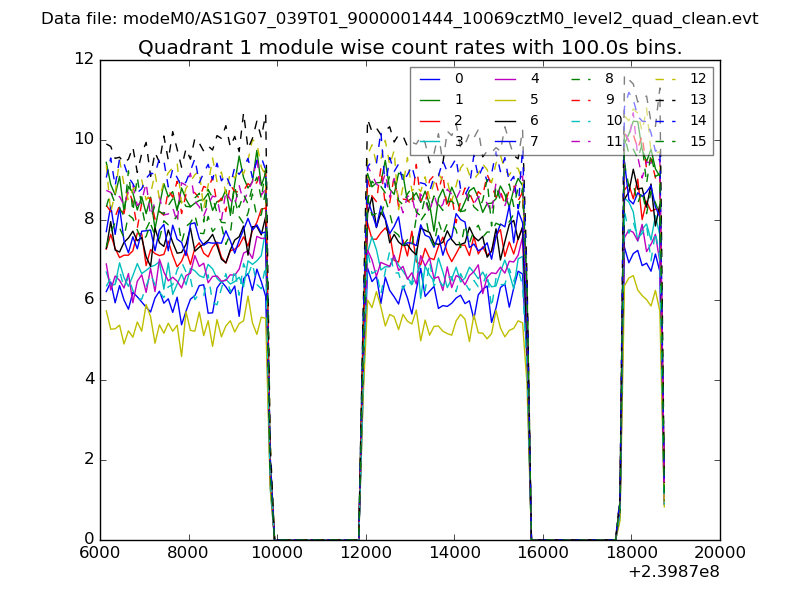
| Module-wise count rates for Quadrant A Data is divided into 100 sec bins |
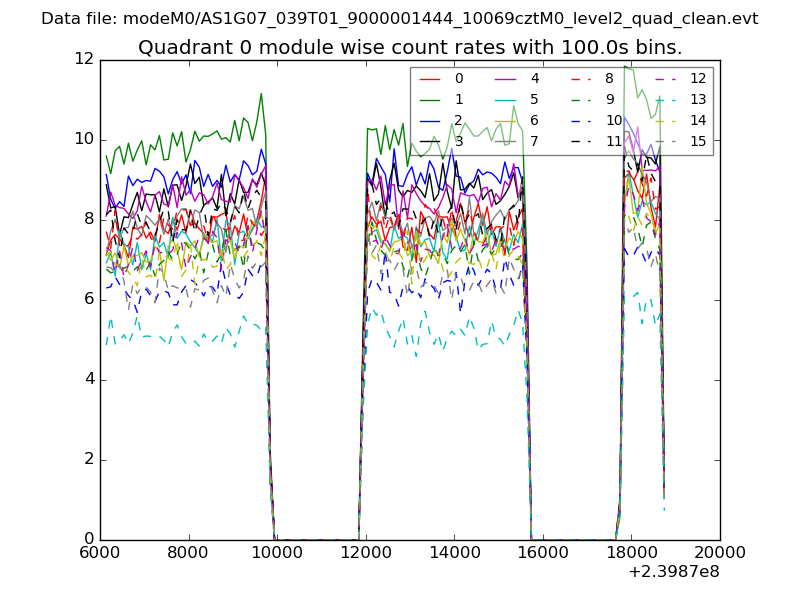 |
 |
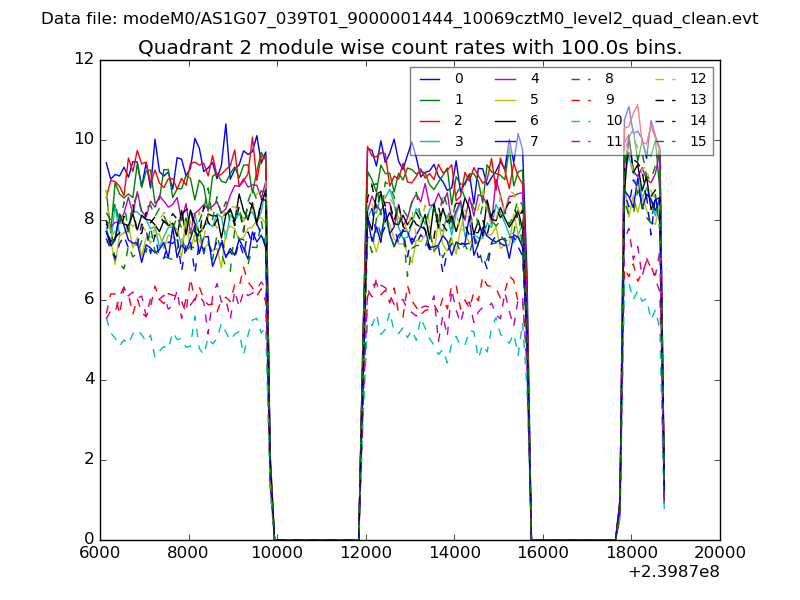
| Module-wise count rates for Quadrant B Data is divided into 100 sec bins |
 |
 |
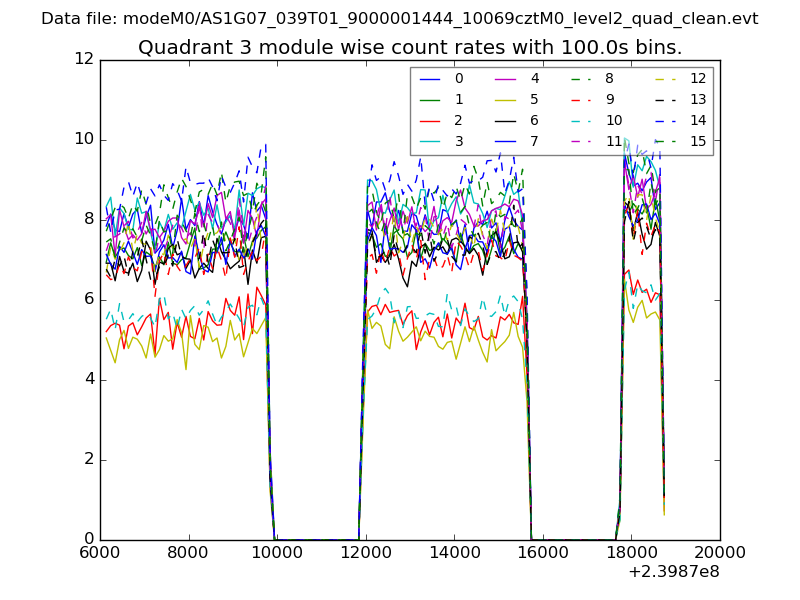
| Module-wise count rates for Quadrant C Data is divided into 100 sec bins |
 |
 |
| Module-wise count rates for Quadrant D Data is divided into 100 sec bins |
 |
 |
| Parameter | Plot |
|---|---|
| CZT HV Monitor |  |
| D_VDD | 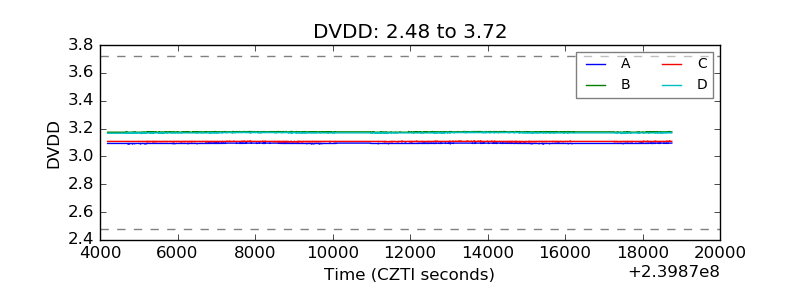 |
| Temperature 1 |  |
| Veto HV Monitor | 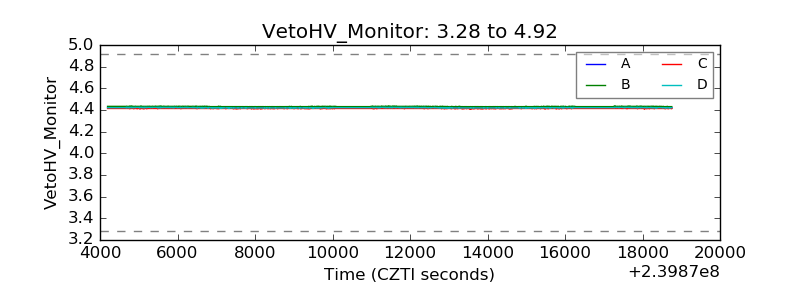 |
| Veto LLD | 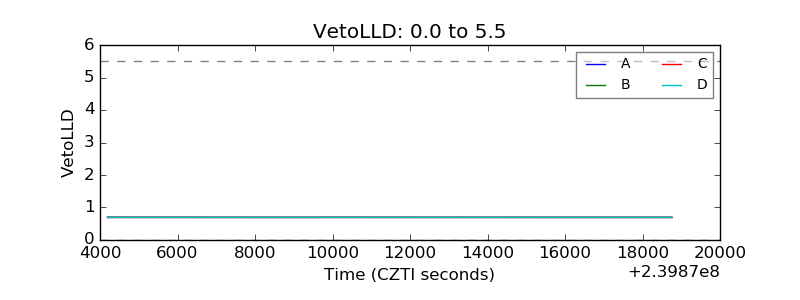 |
| Alpha Counter | 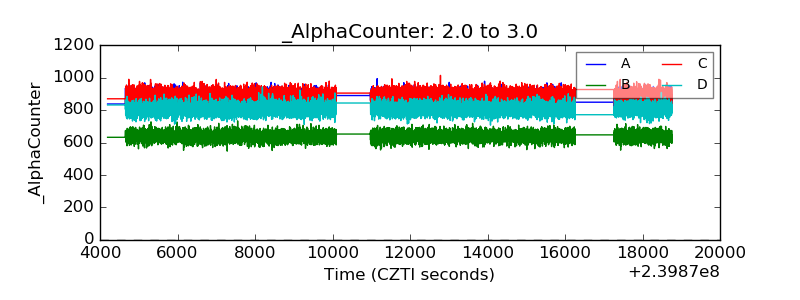 |
| _CPM_Rate | 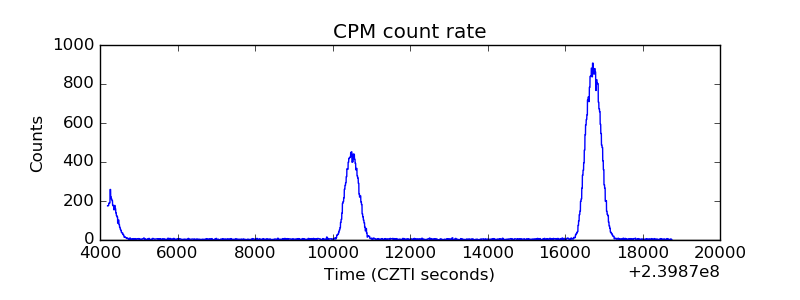 |
| CZT Counter |  |
| +2.5 Volts monitor |  |
| +5 Volts monitor |  |
| _ROLL_ROT | 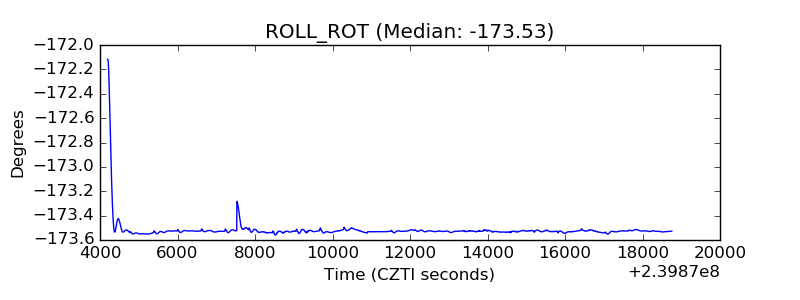 |
| _Roll_DEC | 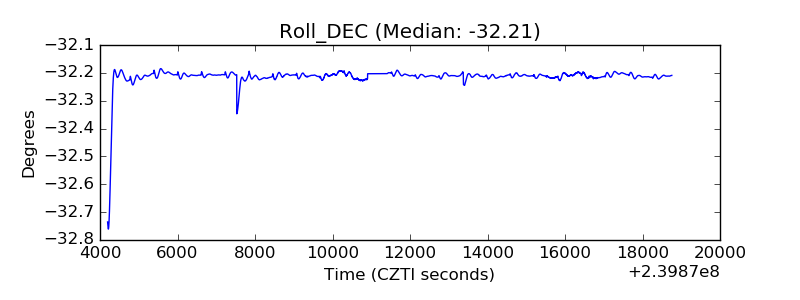 |
| _Roll_RA | 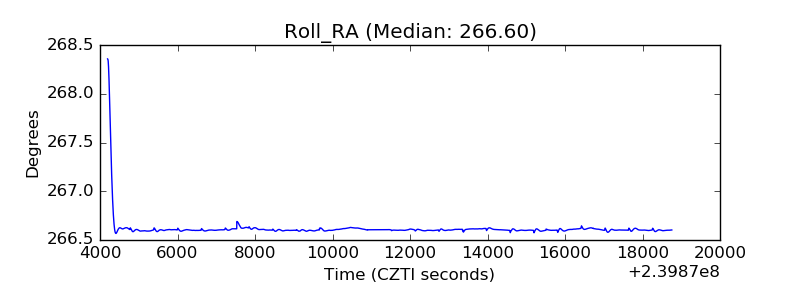 |
| Veto Counter | 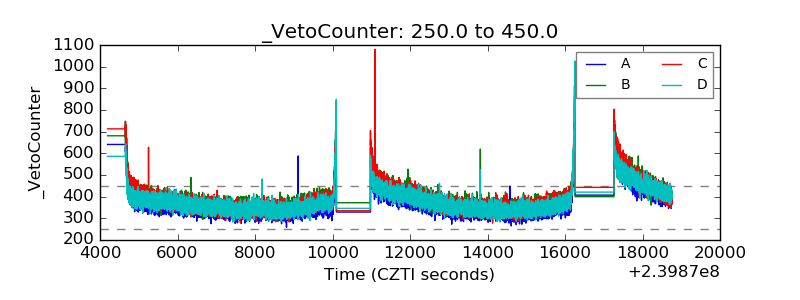 |