| Param | Original file | Final file |
|---|---|---|
| Filename | modeM0/AS1G07_039T01_9000001444_10072cztM0_level2.evt | modeM0/AS1G07_039T01_9000001444_10072cztM0_level2_quad_clean.evt |
| Size (bytes) | 440,262,720 | 104,765,760 |
| Size | 419.9 MB | 99.9 MB |
| Events in quadrant A | 3,034,001 | 700,291 |
| Events in quadrant B | 3,370,235 | 703,758 |
| Events in quadrant C | 2,844,748 | 688,195 |
| Events in quadrant D | 3,673,442 | 658,370 |
| Mode M0 | |||
|---|---|---|---|
| Quadrant | BADHDUFLAG | Total packets | Discarded packets |
| A | 0 | 13008 | 2 |
| B | 0 | 14041 | 1 |
| C | 0 | 12532 | 1 |
| D | 0 | 14969 | 1 |
| Mode M9 | |||
|---|---|---|---|
| Quadrant | BADHDUFLAG | Total packets | Discarded packets |
| A | 0 | 12 | 0 |
| B | 0 | 12 | 0 |
| C | 0 | 12 | 0 |
| D | 0 | 12 | 0 |
| Mode SS | |||
|---|---|---|---|
| Quadrant | BADHDUFLAG | Total packets | Discarded packets |
| A | 0 | 122 | 0 |
| B | 0 | 122 | 0 |
| C | 0 | 122 | 0 |
| D | 0 | 122 | 0 |
| Quadrant | Total seconds | Saturated seconds | Saturation percentage |
|---|---|---|---|
| A | 6052 | 76 | 1.255783% |
| B | 6052 | 93 | 1.536682% |
| C | 6052 | 50 | 0.826173% |
| D | 6052 | 91 | 1.503635% |
Noise dominated data is calculated using 1-second bins in cleaned event files. If a bin has >2000 counts, and if more than 50% of those come from <1% of pixels, then it is considered to be noise-dominated and hence unusable.
| Quadrant | # 1 sec bins | Bins with >0 counts | Bins with >2000 counts | High rate bins dominated by noise | Noise dominated (total time) | Noise dominated (detector-on time) | Marked lightcurve |
|---|---|---|---|---|---|---|---|
| A | 7252 | 6052 | 0 | 0 | 0.00% | 0.00% | 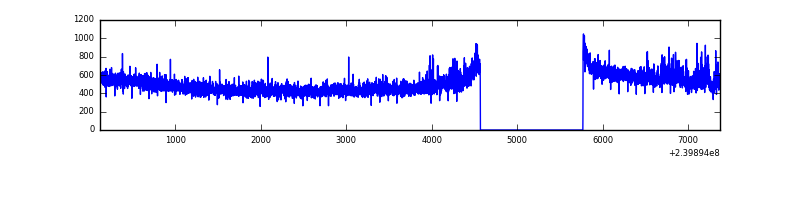 |
| B | 7252 | 6052 | 22 | 22 | 0.30% | 0.36% | 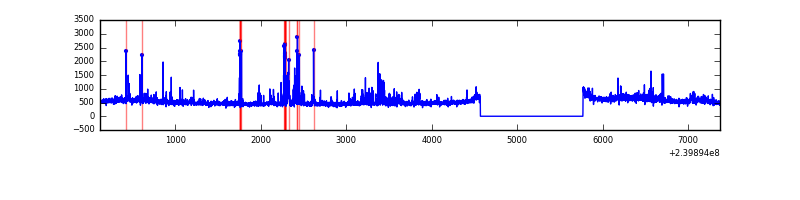 |
| C | 7252 | 6052 | 0 | 0 | 0.00% | 0.00% | 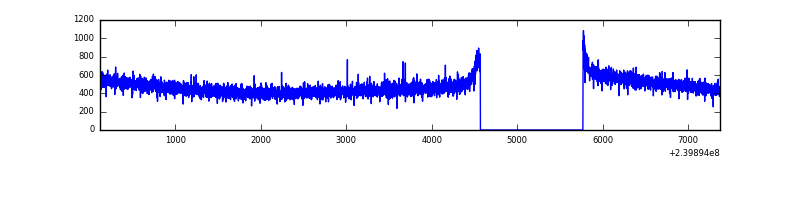 |
| D | 7252 | 6052 | 35 | 35 | 0.48% | 0.58% | 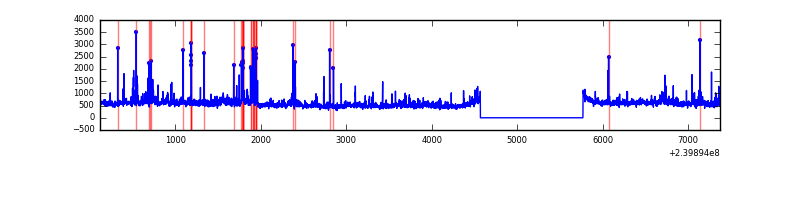 |
Top three noisy pixels from each quadrant. If the there are fewer than three noisy pixels in the level2.evt file, extra rows are filled as -1
| Pixel properties | Quadrant properties | ||||||
|---|---|---|---|---|---|---|---|
| Quadrant | DetID | PixID | Counts | Sigma | Mean | Median | Sigma |
| A | 8 | 15 | 89190 | 570.31 | 765 | 752 | 155.1 |
| A | 0 | 226 | 7193 | 41.54 | 765 | 752 | 155.1 |
| A | 12 | 194 | 6562 | 37.47 | 765 | 752 | 155.1 |
| B | 4 | 81 | 119001 | 822.26 | 759 | 742 | 143.8 |
| B | 0 | 214 | 110885 | 765.83 | 759 | 742 | 143.8 |
| B | 10 | 245 | 62472 | 429.21 | 759 | 742 | 143.8 |
| C | 13 | 61 | 5495 | 28.39 | 727 | 731 | 167.8 |
| C | 8 | 222 | 3904 | 18.91 | 727 | 731 | 167.8 |
| C | 14 | 67 | 3341 | 15.55 | 727 | 731 | 167.8 |
| D | 8 | 195 | 385347 | 2002.63 | 728 | 714 | 192.1 |
| D | 1 | 52 | 126785 | 656.4 | 728 | 714 | 192.1 |
| D | 2 | 16 | 125556 | 650.0 | 728 | 714 | 192.1 |
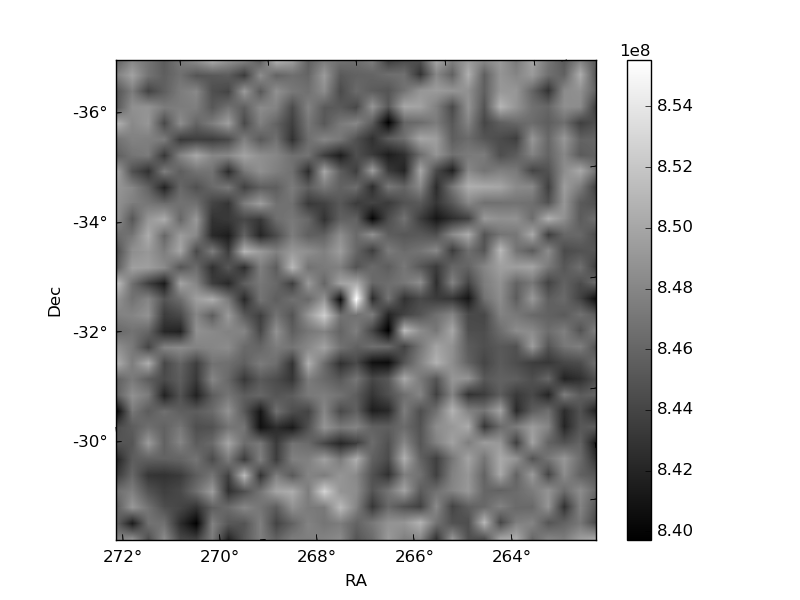
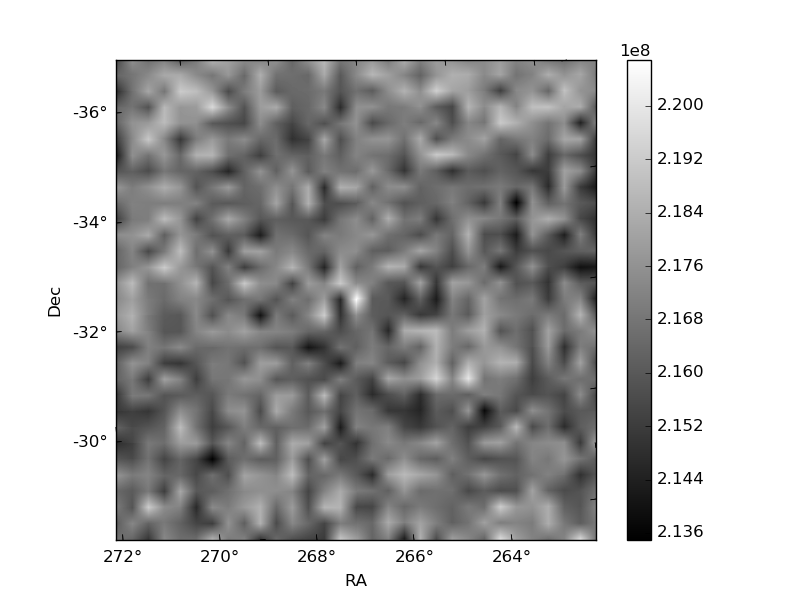
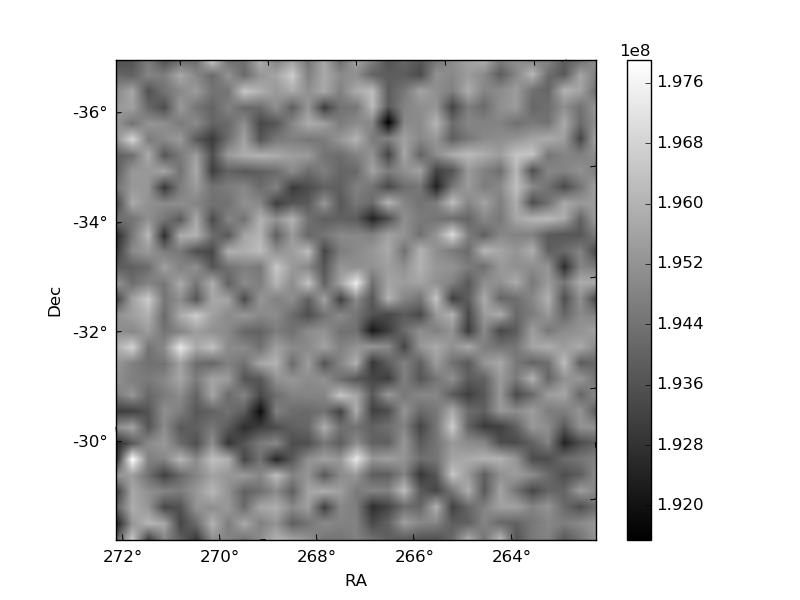
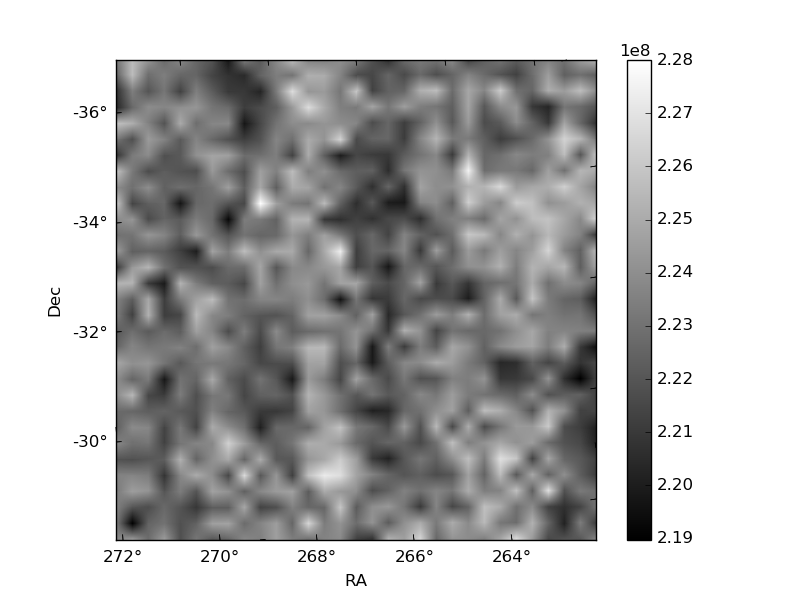
Histogram calculated using DETX and DETY for each event in the final _common_clean file
| Quadrant A | 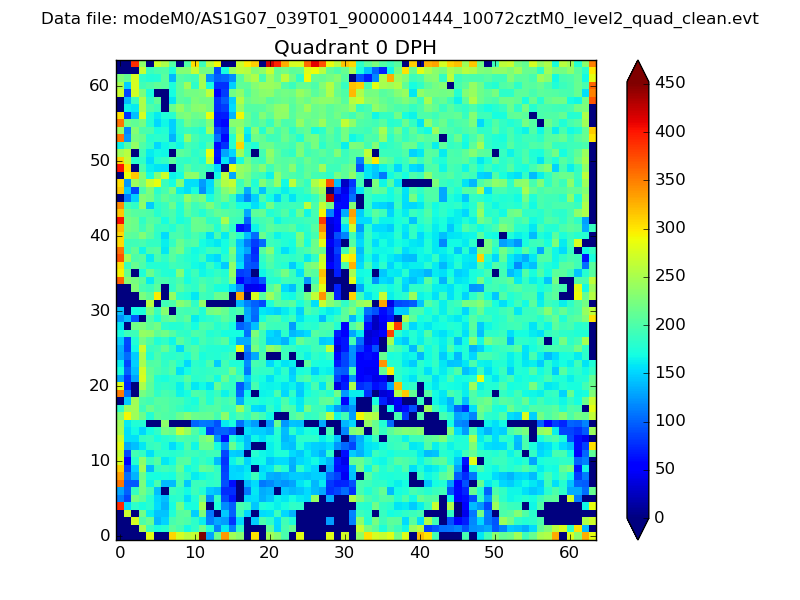 |
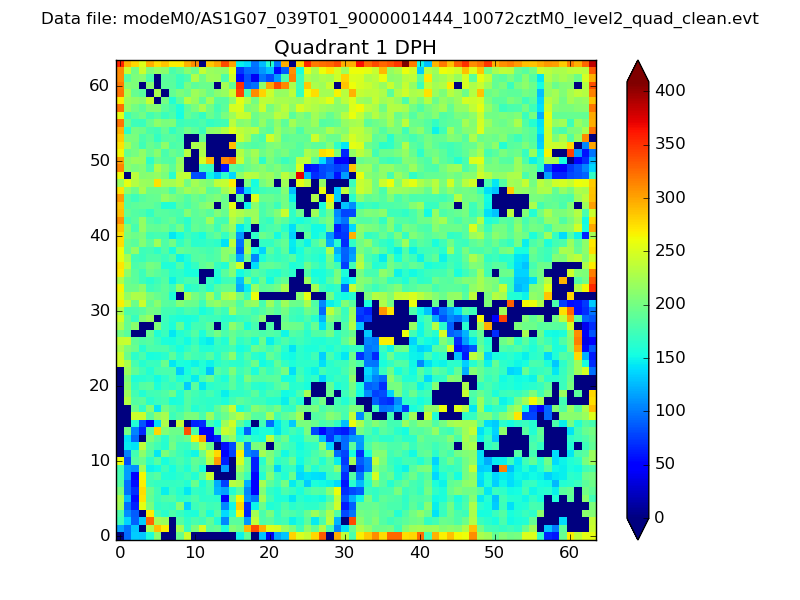 |
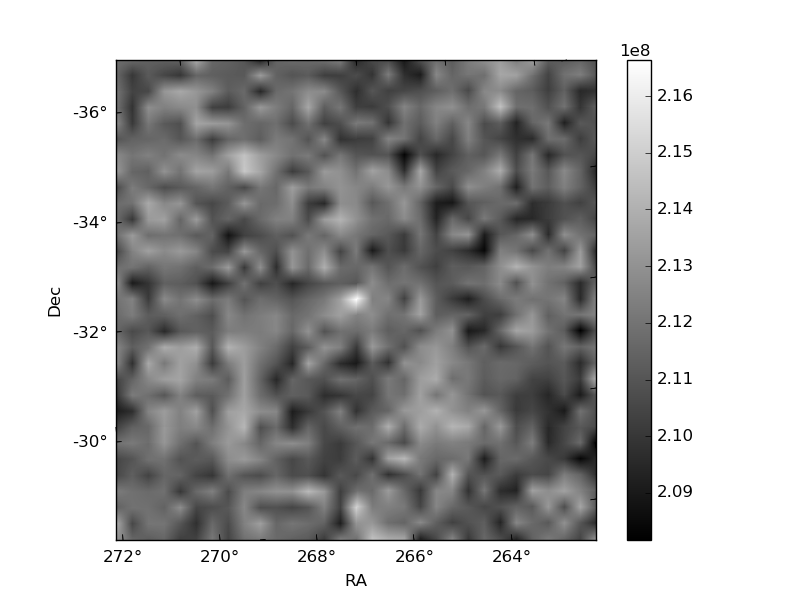
Quadrant B |
|---|---|---|---|
| Quadrant D | 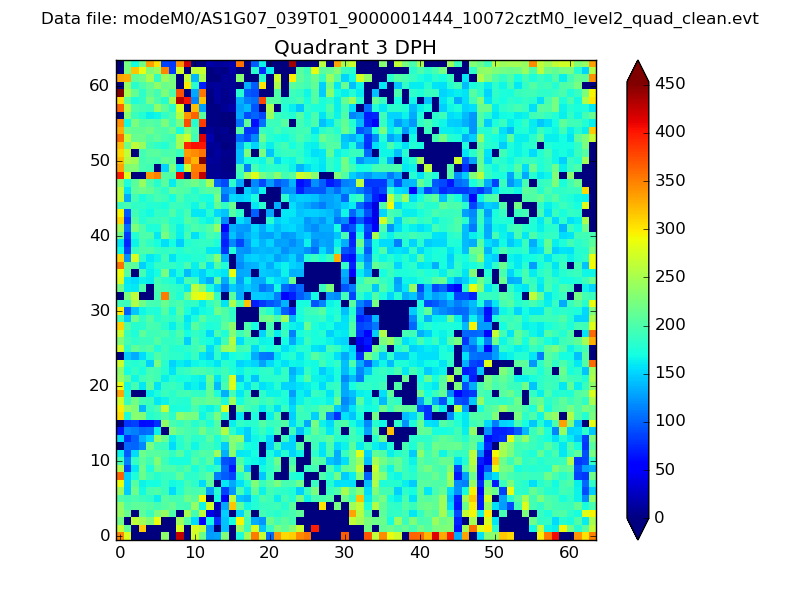 |
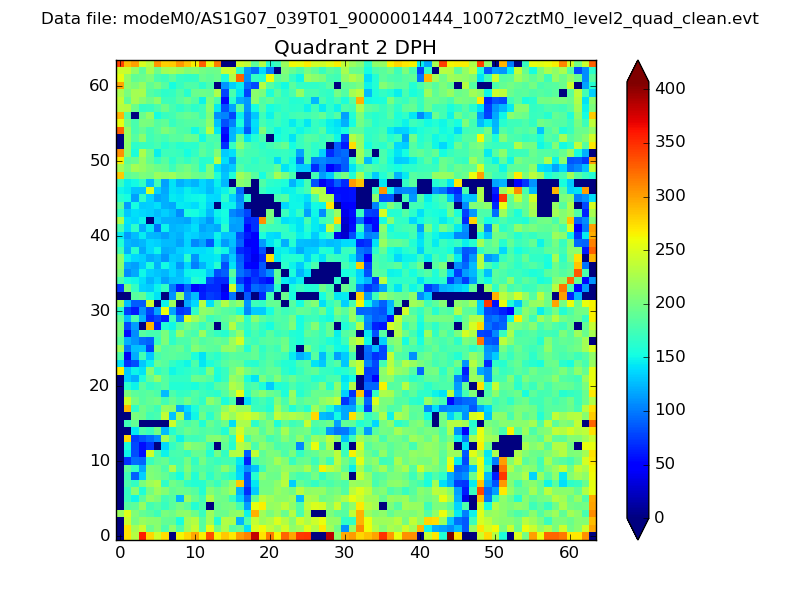 |
Quadrant C |
| Plot type | Count rate plots | Images |
|---|---|---|
| Comparison with Poisson distribution Blue bars denote a histogram of data divided into 1 sec bins. Red curve is a Poisson curve with rate = median count rate of data. |
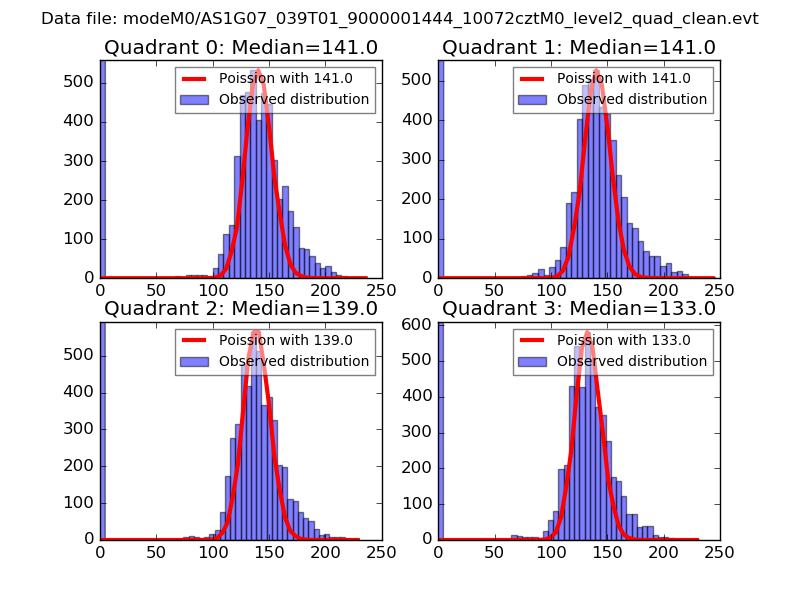 |
 |
| Quadrant-wise count rates Data is divided into 100 sec bins |
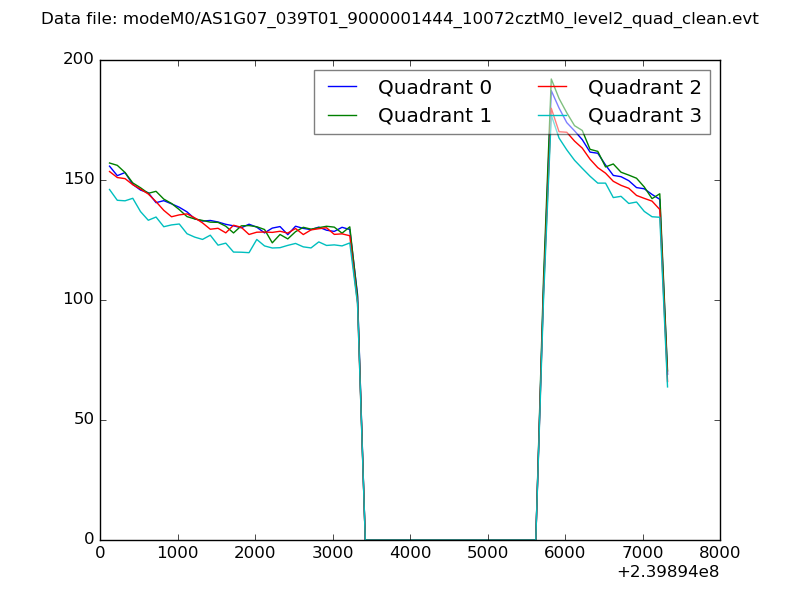 |
|
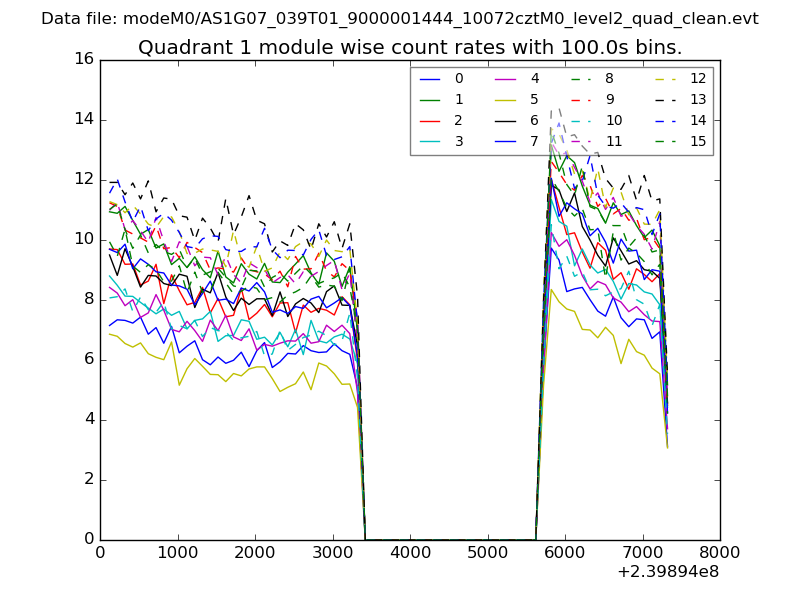
| Module-wise count rates for Quadrant A Data is divided into 100 sec bins |
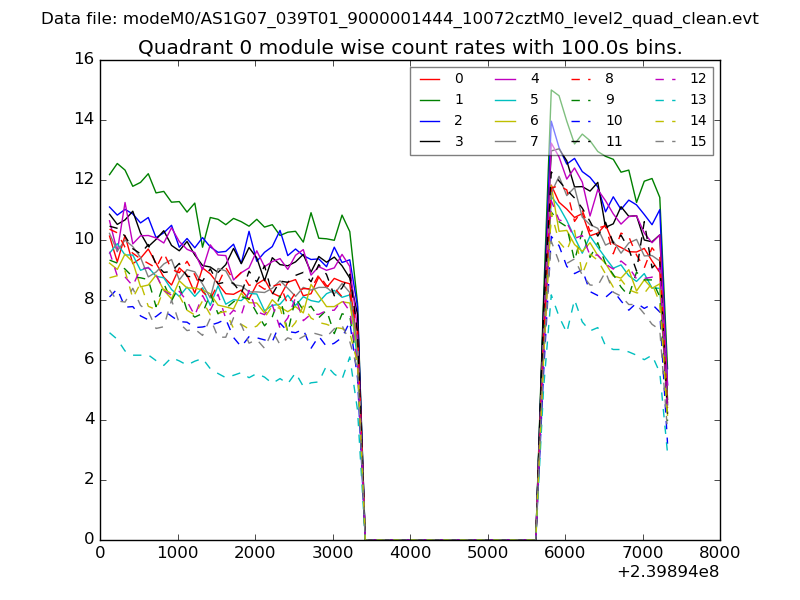 |
 |
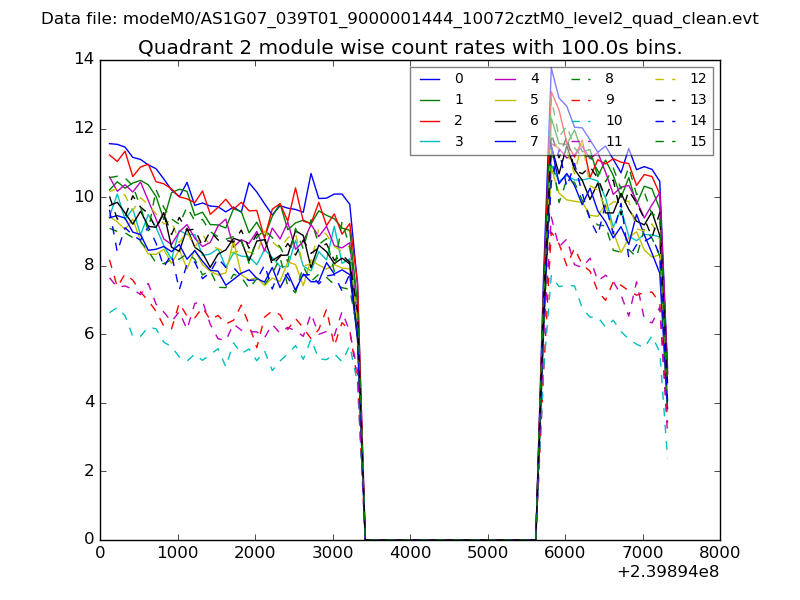
| Module-wise count rates for Quadrant B Data is divided into 100 sec bins |
 |
 |
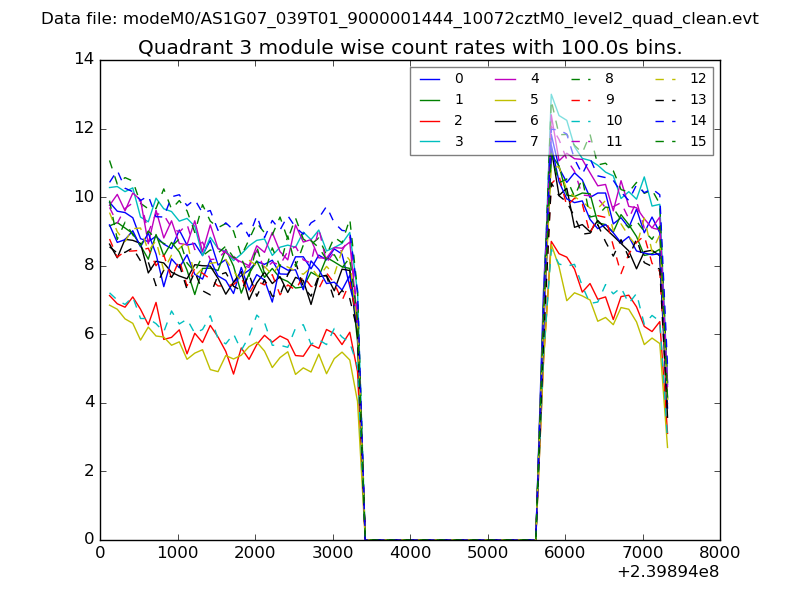
| Module-wise count rates for Quadrant C Data is divided into 100 sec bins |
 |
 |
| Module-wise count rates for Quadrant D Data is divided into 100 sec bins |
 |
 |
| Parameter | Plot |
|---|---|
| CZT HV Monitor | 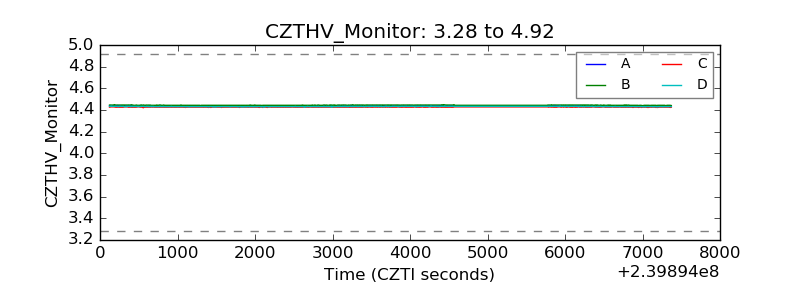 |
| D_VDD | 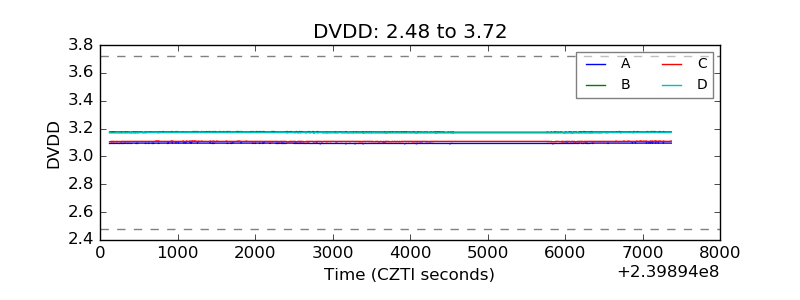 |
| Temperature 1 | 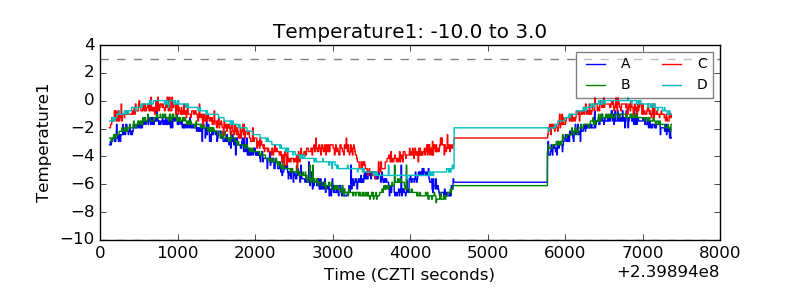 |
| Veto HV Monitor | 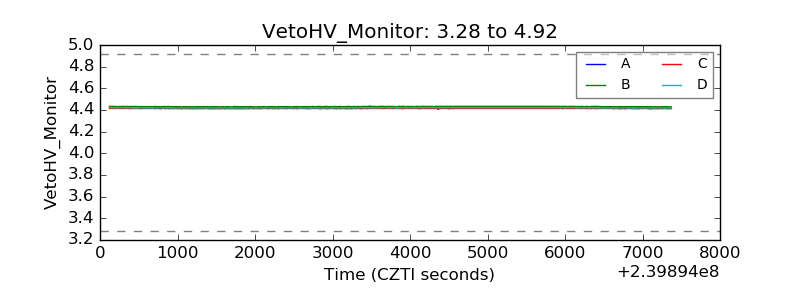 |
| Veto LLD | 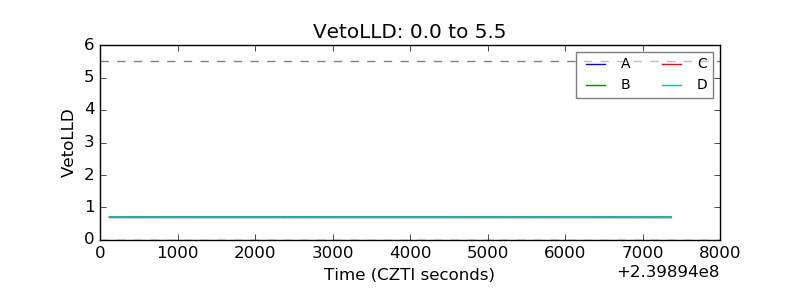 |
| Alpha Counter | 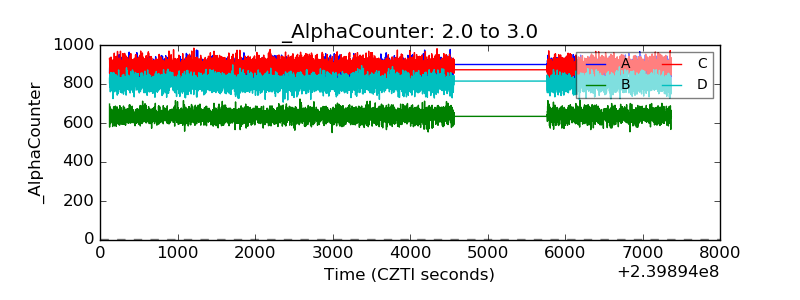 |
| _CPM_Rate | 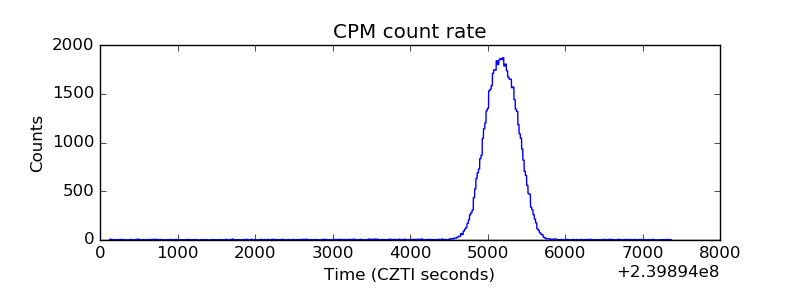 |
| CZT Counter | 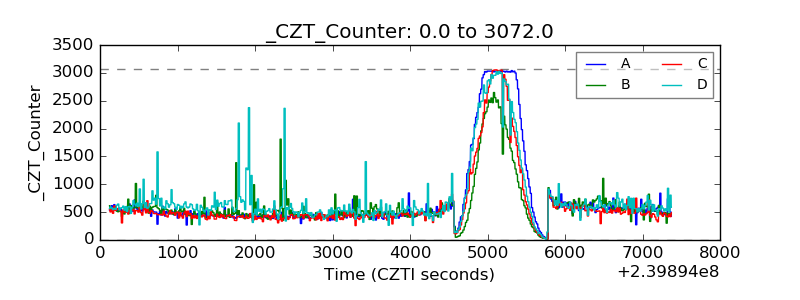 |
| +2.5 Volts monitor | 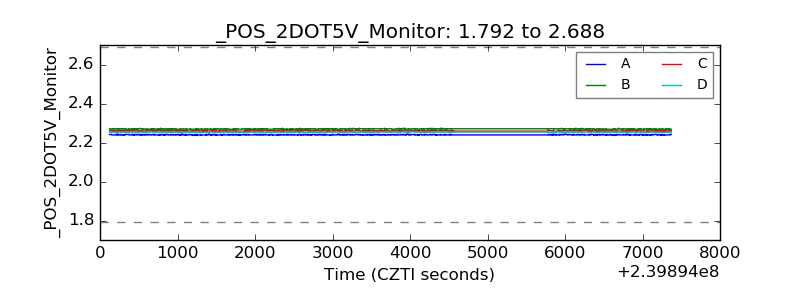 |
| +5 Volts monitor | 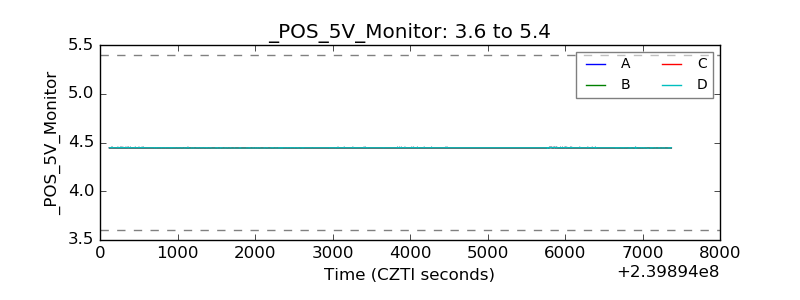 |
| _ROLL_ROT | 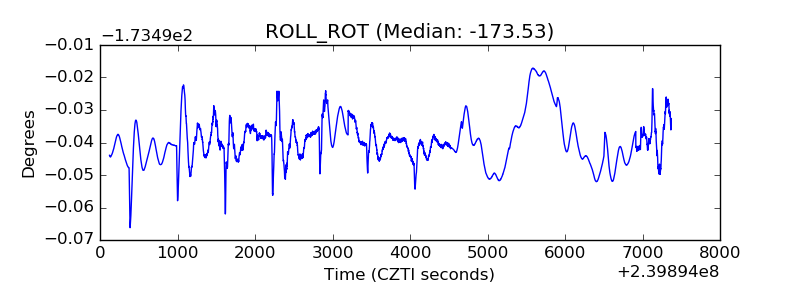 |
| _Roll_DEC | 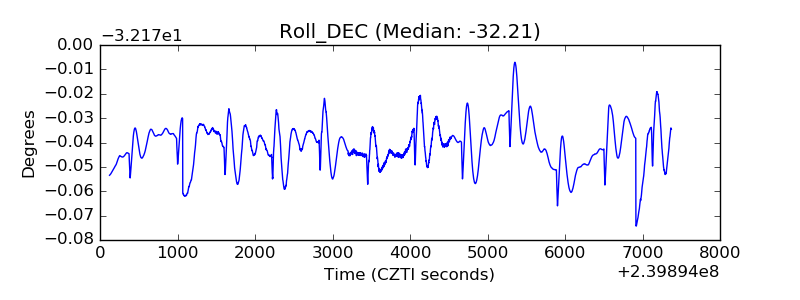 |
| _Roll_RA | 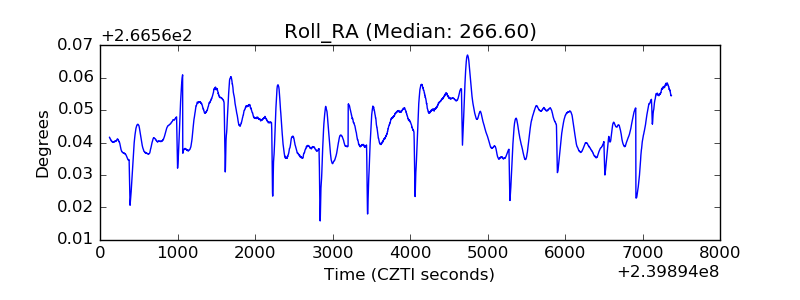 |
| Veto Counter | 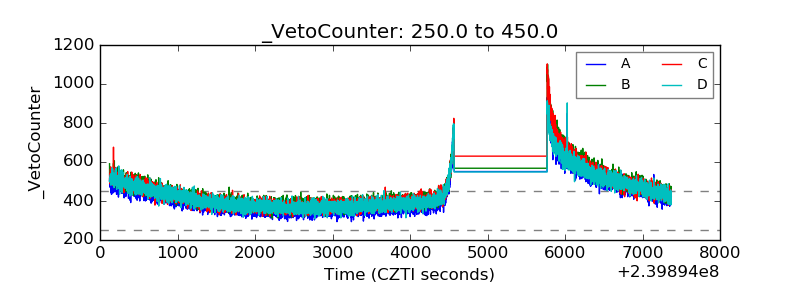 |