| Param | Original file | Final file |
|---|---|---|
| Filename | modeM0/AS1G07_039T01_9000001444_10073cztM0_level2.evt | modeM0/AS1G07_039T01_9000001444_10073cztM0_level2_quad_clean.evt |
| Size (bytes) | 452,975,040 | 96,120,000 |
| Size | 432.0 MB | 91.7 MB |
| Events in quadrant A | 2,996,831 | 640,021 |
| Events in quadrant B | 3,161,774 | 643,071 |
| Events in quadrant C | 2,787,547 | 625,059 |
| Events in quadrant D | 4,369,780 | 588,698 |
| Mode M0 | |||
|---|---|---|---|
| Quadrant | BADHDUFLAG | Total packets | Discarded packets |
| A | 0 | 12672 | 2 |
| B | 0 | 13262 | 1 |
| C | 0 | 12218 | 1 |
| D | 0 | 16953 | 1 |
| Mode M9 | |||
|---|---|---|---|
| Quadrant | BADHDUFLAG | Total packets | Discarded packets |
| A | 0 | 13 | 0 |
| B | 0 | 13 | 0 |
| C | 0 | 13 | 0 |
| D | 0 | 13 | 0 |
| Mode SS | |||
|---|---|---|---|
| Quadrant | BADHDUFLAG | Total packets | Discarded packets |
| A | 0 | 120 | 0 |
| B | 0 | 120 | 0 |
| C | 0 | 120 | 0 |
| D | 0 | 120 | 0 |
| Quadrant | Total seconds | Saturated seconds | Saturation percentage |
|---|---|---|---|
| A | 5930 | 83 | 1.399663% |
| B | 5930 | 91 | 1.534570% |
| C | 5930 | 63 | 1.062395% |
| D | 5930 | 166 | 2.799325% |
Noise dominated data is calculated using 1-second bins in cleaned event files. If a bin has >2000 counts, and if more than 50% of those come from <1% of pixels, then it is considered to be noise-dominated and hence unusable.
| Quadrant | # 1 sec bins | Bins with >0 counts | Bins with >2000 counts | High rate bins dominated by noise | Noise dominated (total time) | Noise dominated (detector-on time) | Marked lightcurve |
|---|---|---|---|---|---|---|---|
| A | 7205 | 5930 | 0 | 0 | 0.00% | 0.00% | 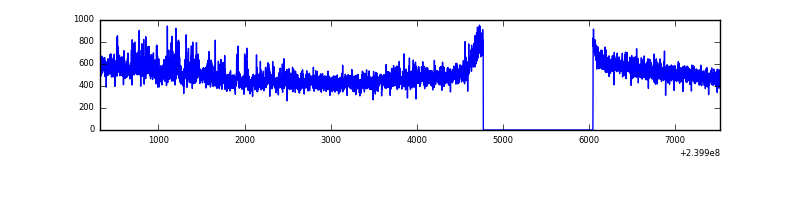 |
| B | 7205 | 5930 | 7 | 7 | 0.10% | 0.12% | 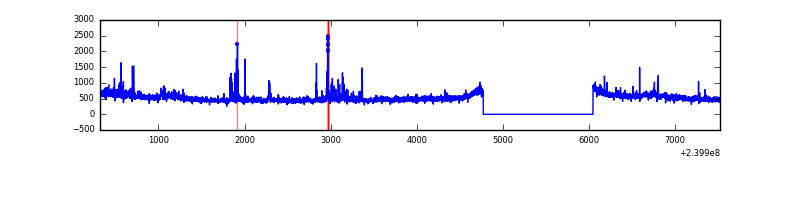 |
| C | 7205 | 5930 | 0 | 0 | 0.00% | 0.00% | 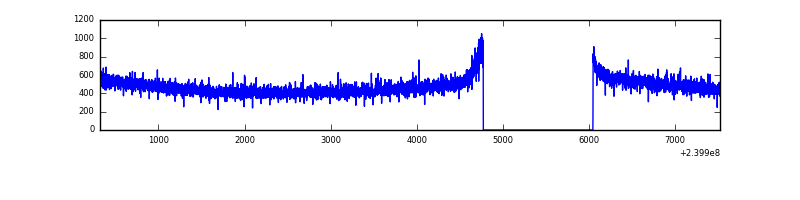 |
| D | 7205 | 5930 | 106 | 106 | 1.47% | 1.79% | 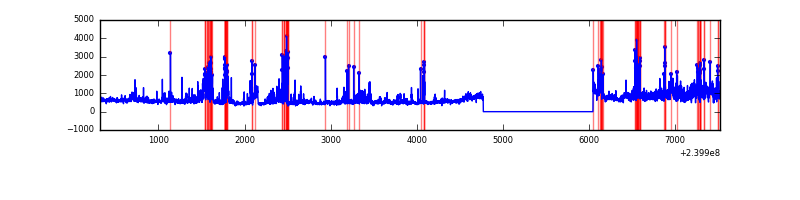 |
Top three noisy pixels from each quadrant. If the there are fewer than three noisy pixels in the level2.evt file, extra rows are filled as -1
| Pixel properties | Quadrant properties | ||||||
|---|---|---|---|---|---|---|---|
| Quadrant | DetID | PixID | Counts | Sigma | Mean | Median | Sigma |
| A | 8 | 15 | 109847 | 717.49 | 749 | 737 | 152.1 |
| A | 0 | 226 | 7137 | 42.09 | 749 | 737 | 152.1 |
| A | 12 | 194 | 6462 | 37.65 | 749 | 737 | 152.1 |
| B | 0 | 214 | 72554 | 507.75 | 746 | 731 | 141.5 |
| B | 4 | 81 | 61044 | 426.38 | 746 | 731 | 141.5 |
| B | 0 | 218 | 32530 | 224.8 | 746 | 731 | 141.5 |
| C | 14 | 67 | 5638 | 29.82 | 712 | 716 | 165.0 |
| C | 13 | 61 | 5459 | 28.74 | 712 | 716 | 165.0 |
| C | 4 | 175 | 3083 | 14.34 | 712 | 716 | 165.0 |
| D | 2 | 16 | 805404 | 4236.35 | 707 | 693 | 190.0 |
| D | 8 | 195 | 263135 | 1381.61 | 707 | 693 | 190.0 |
| D | 2 | 152 | 140038 | 733.57 | 707 | 693 | 190.0 |
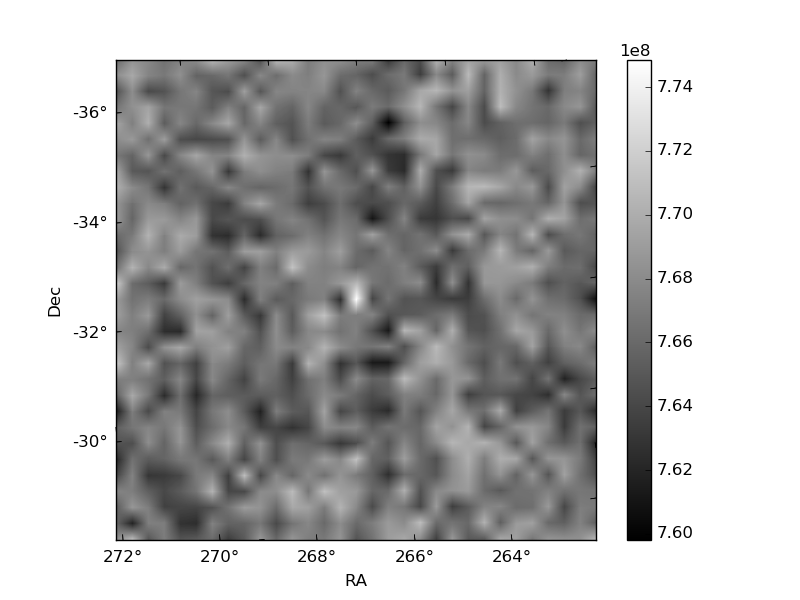
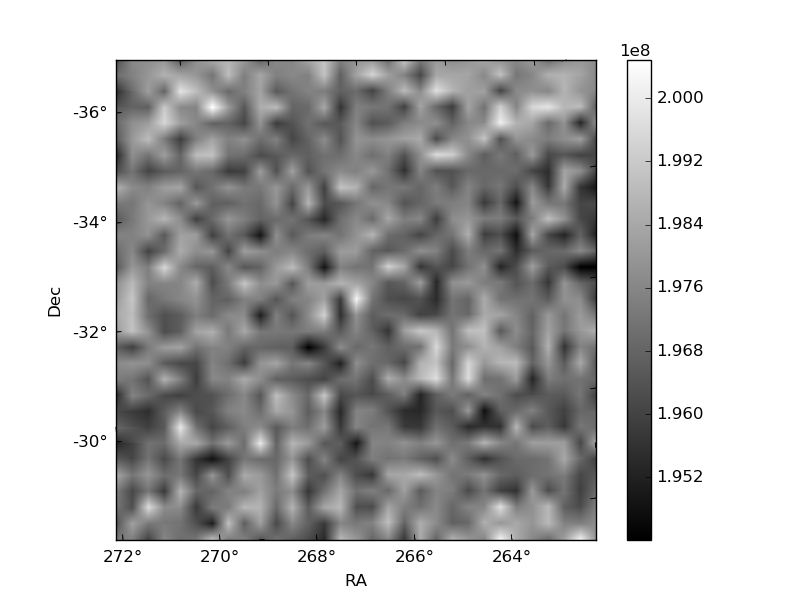
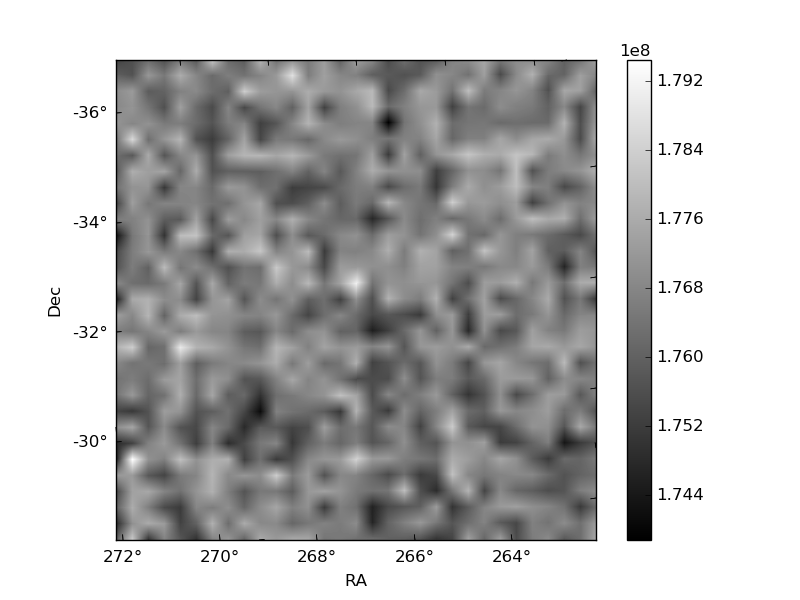
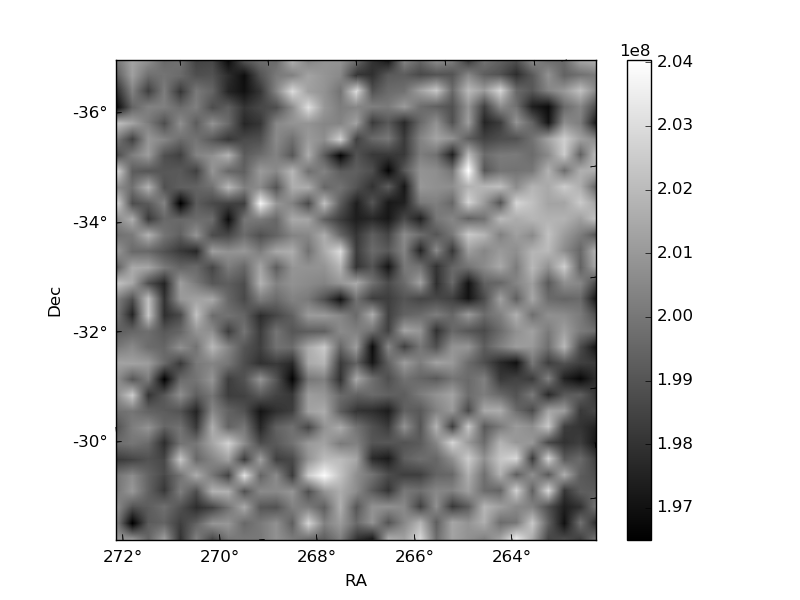
Histogram calculated using DETX and DETY for each event in the final _common_clean file
| Quadrant A | 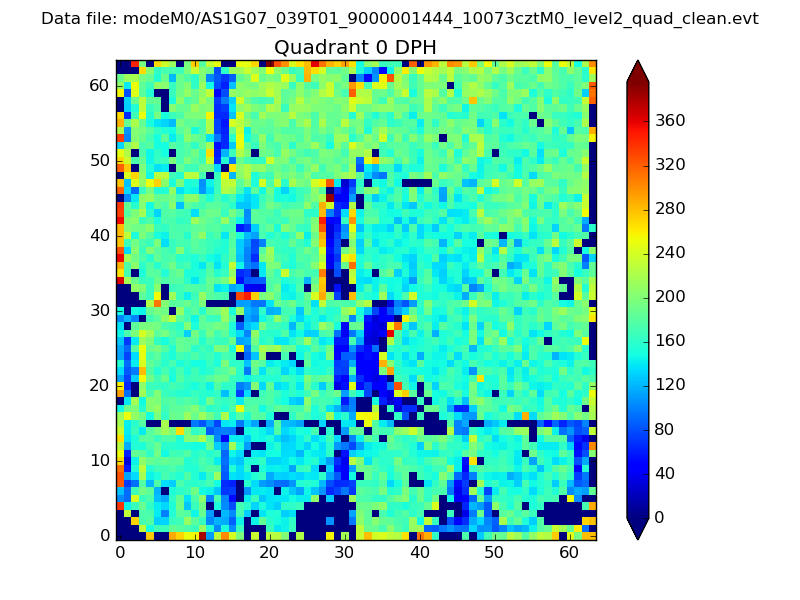 |
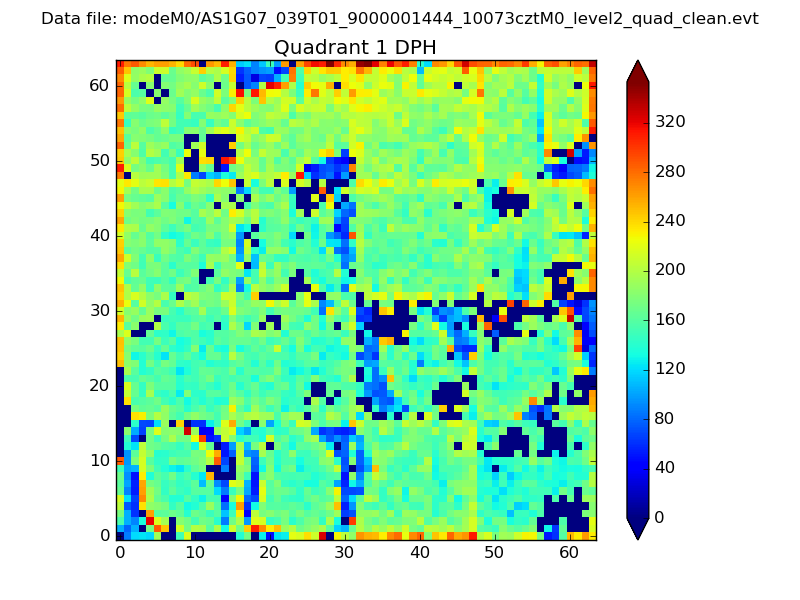 |
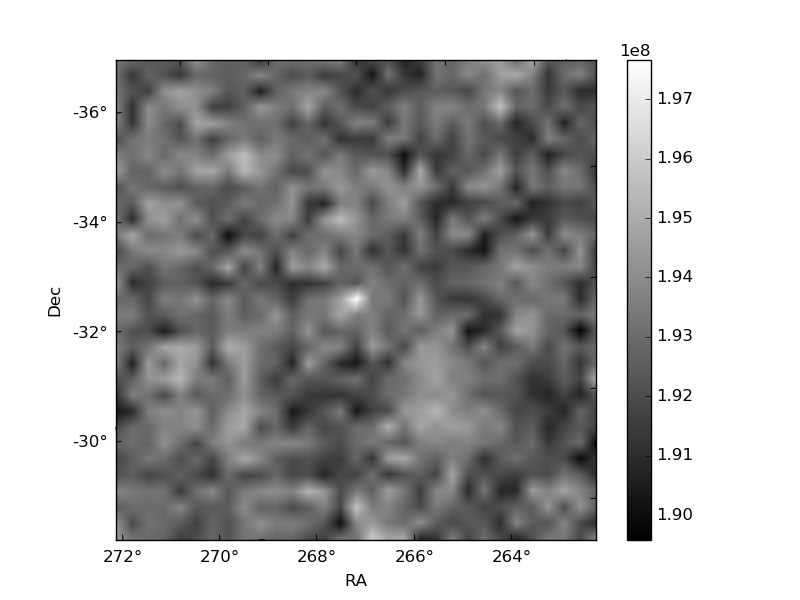
Quadrant B |
|---|---|---|---|
| Quadrant D | 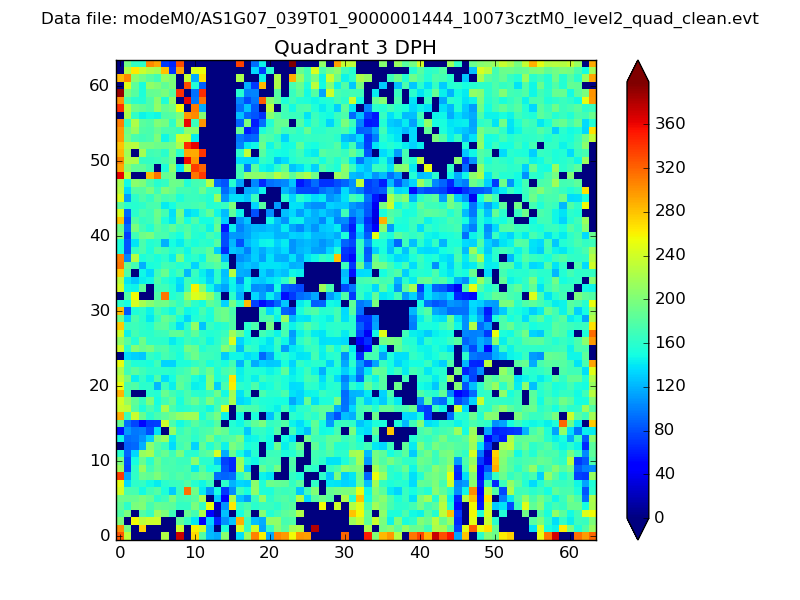 |
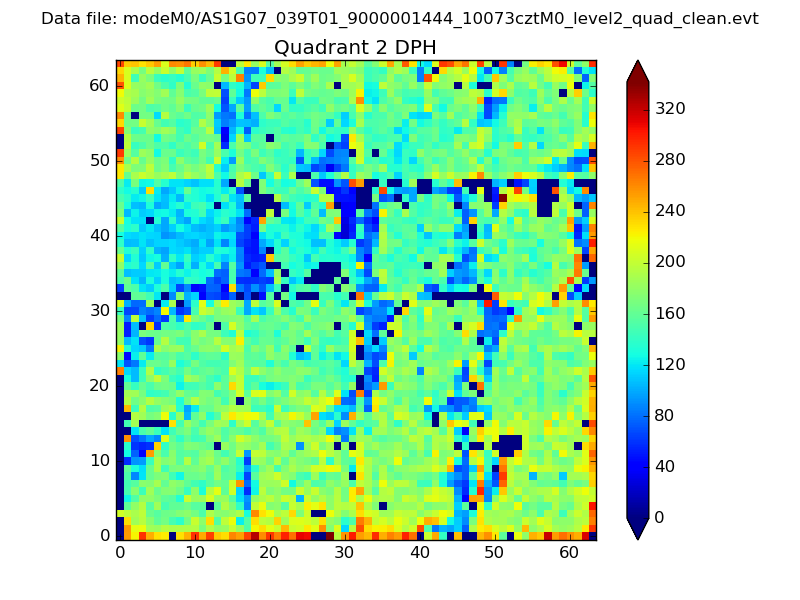 |
Quadrant C |
| Plot type | Count rate plots | Images |
|---|---|---|
| Comparison with Poisson distribution Blue bars denote a histogram of data divided into 1 sec bins. Red curve is a Poisson curve with rate = median count rate of data. |
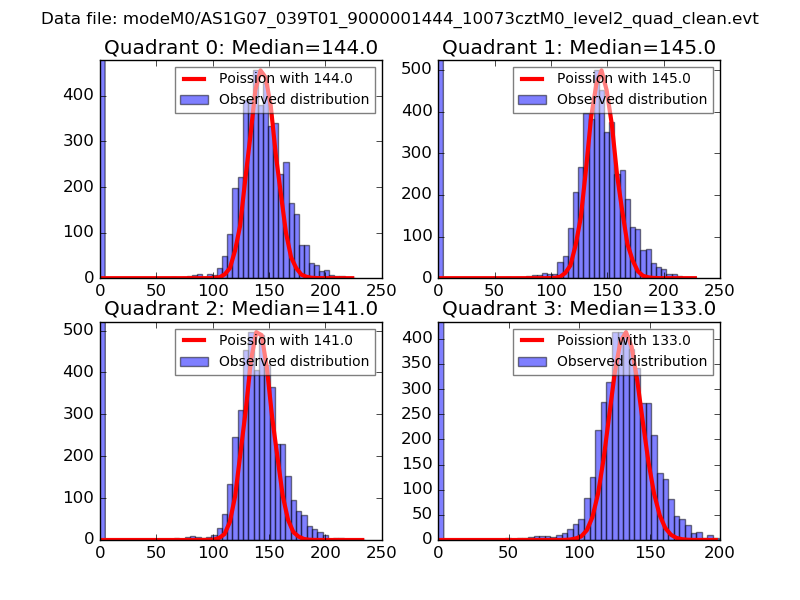 |
 |
| Quadrant-wise count rates Data is divided into 100 sec bins |
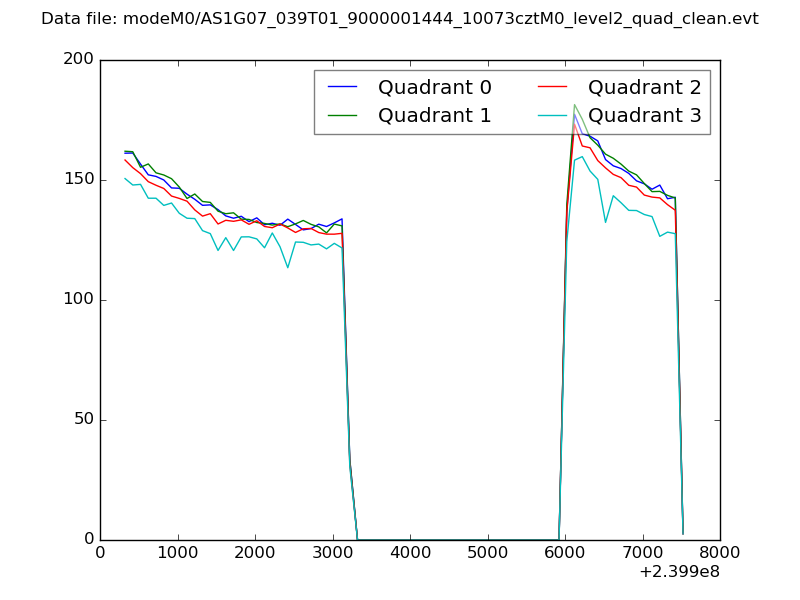 |
|
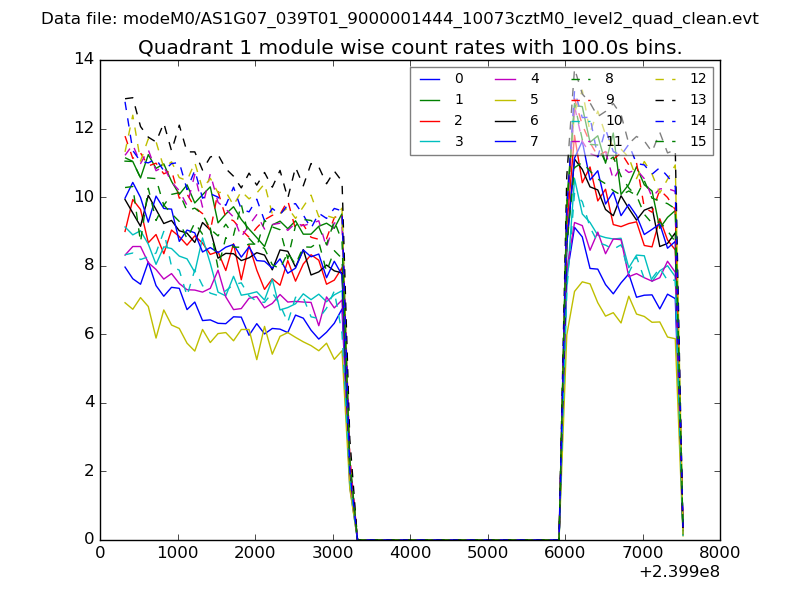
| Module-wise count rates for Quadrant A Data is divided into 100 sec bins |
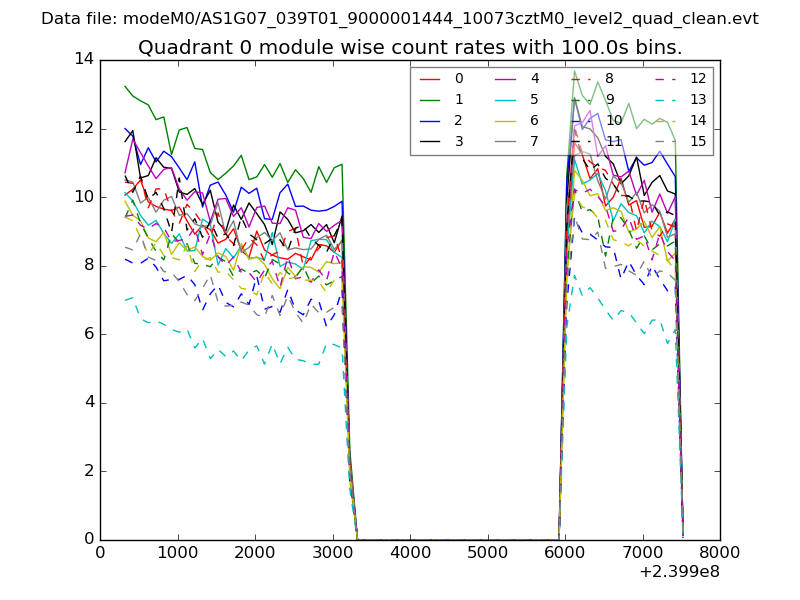 |
 |
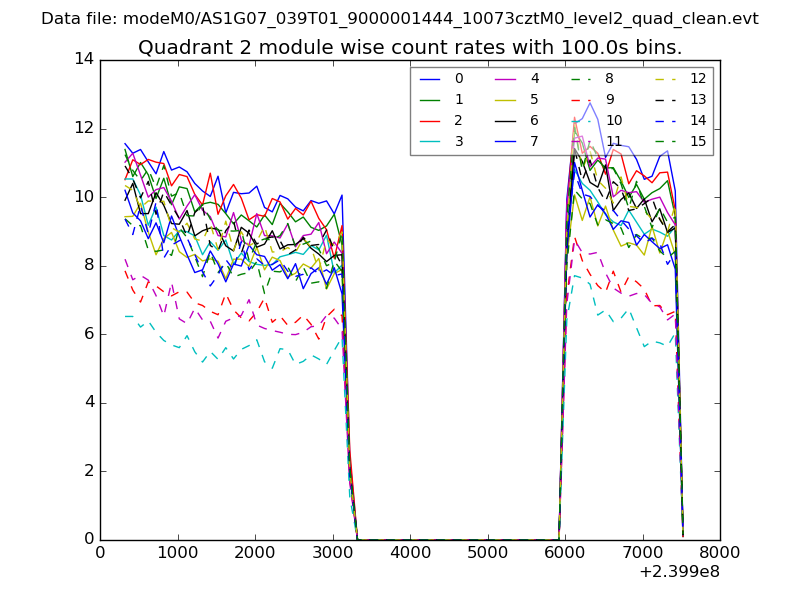
| Module-wise count rates for Quadrant B Data is divided into 100 sec bins |
 |
 |
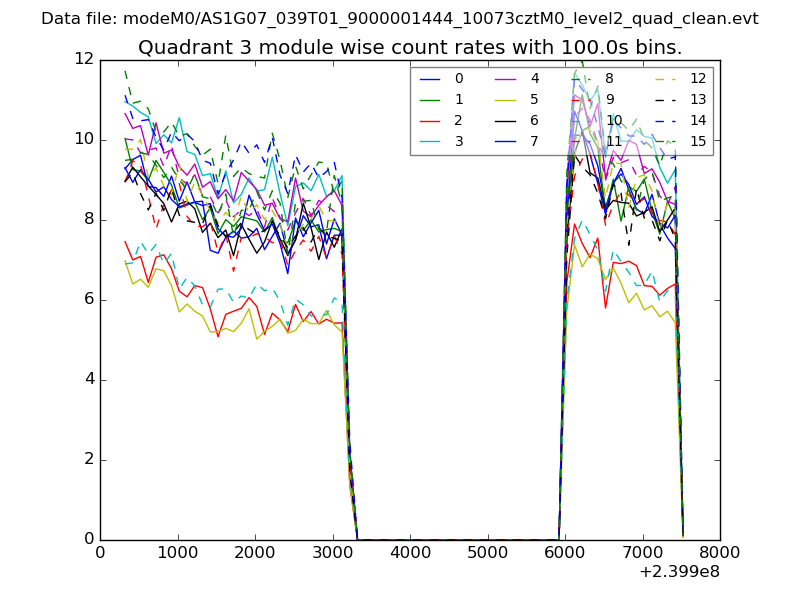
| Module-wise count rates for Quadrant C Data is divided into 100 sec bins |
 |
 |
| Module-wise count rates for Quadrant D Data is divided into 100 sec bins |
 |
 |
| Parameter | Plot |
|---|---|
| CZT HV Monitor | 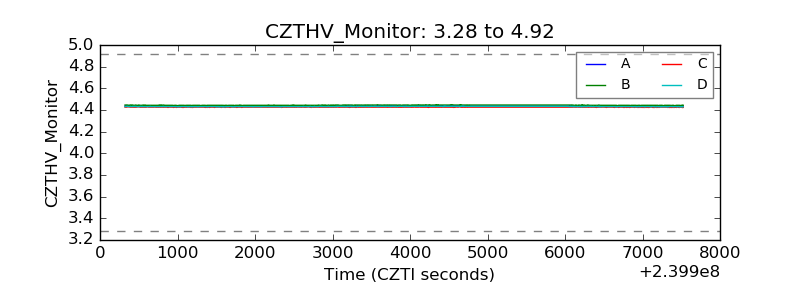 |
| D_VDD | 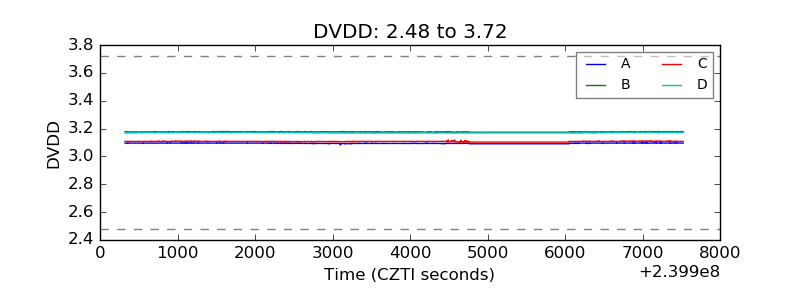 |
| Temperature 1 | 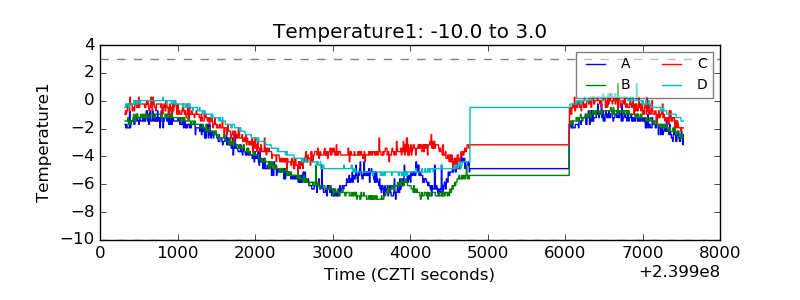 |
| Veto HV Monitor | 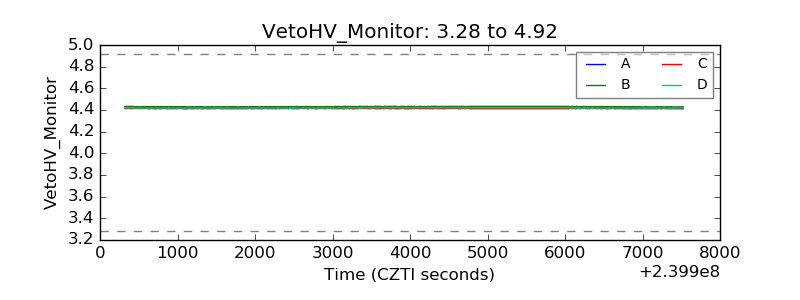 |
| Veto LLD | 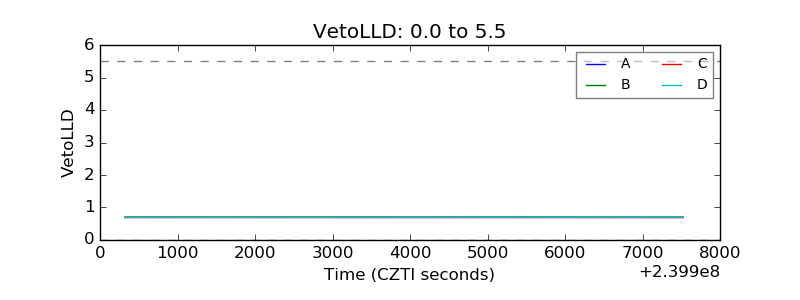 |
| Alpha Counter | 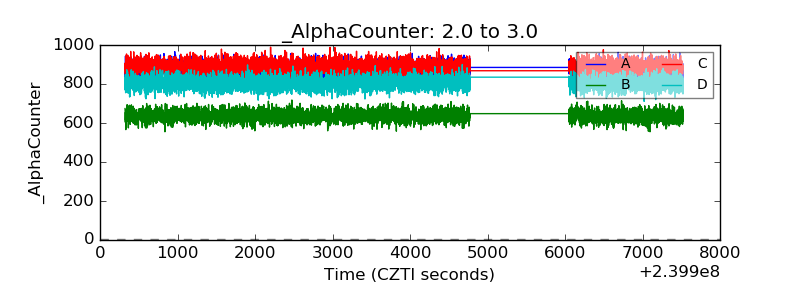 |
| _CPM_Rate | 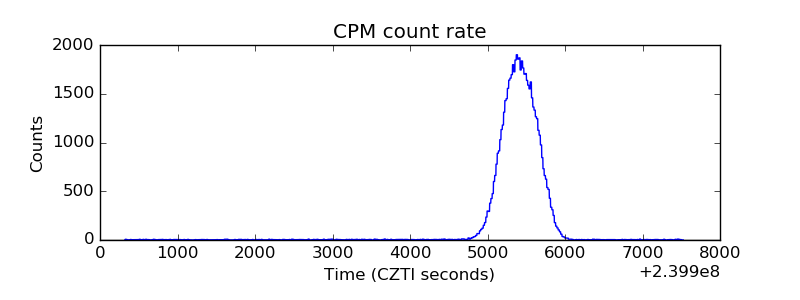 |
| CZT Counter | 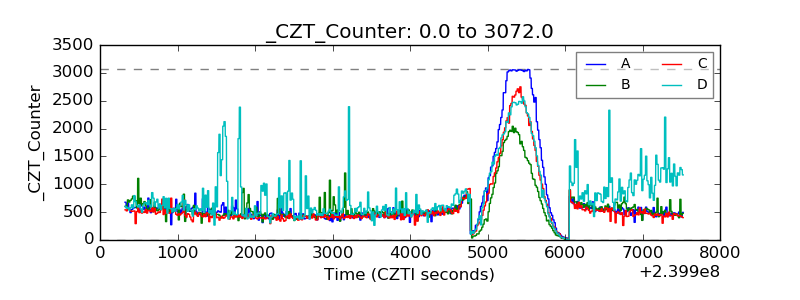 |
| +2.5 Volts monitor | 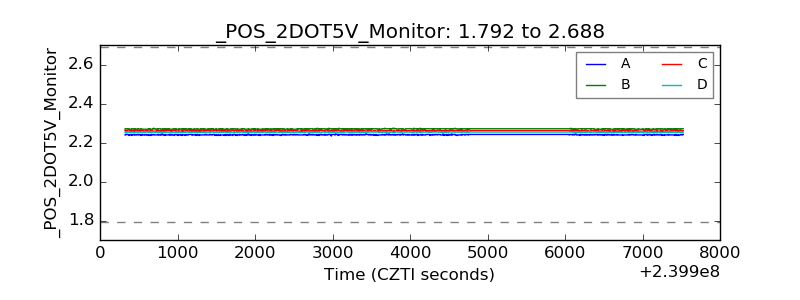 |
| +5 Volts monitor |  |
| _ROLL_ROT | 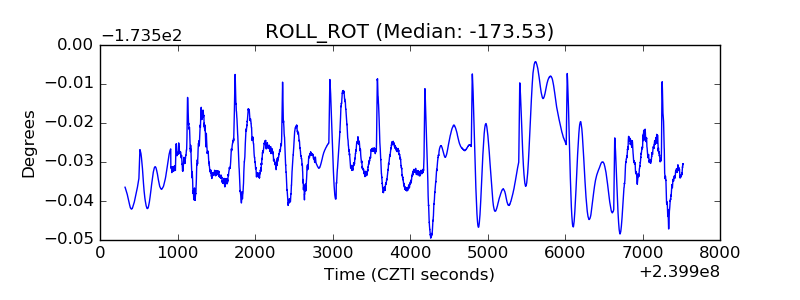 |
| _Roll_DEC | 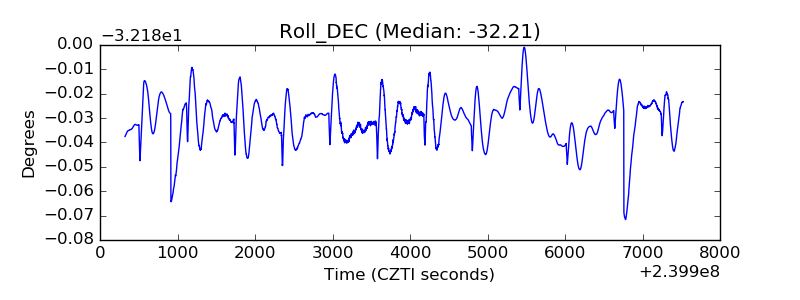 |
| _Roll_RA | 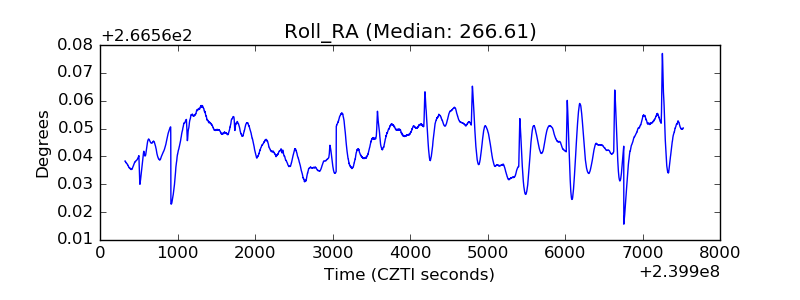 |
| Veto Counter | 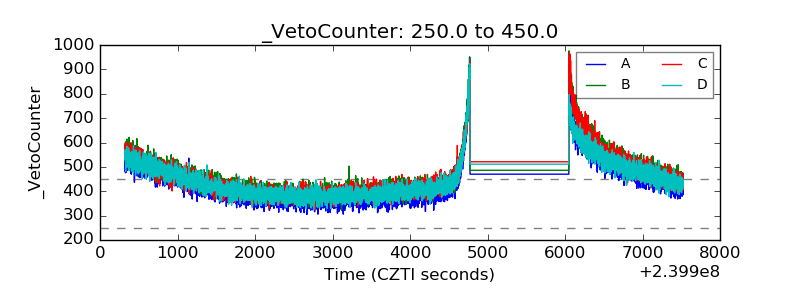 |