| Param | Original file | Final file |
|---|---|---|
| Filename | modeM0/AS1G07_039T01_9000001444_10075cztM0_level2.evt | modeM0/AS1G07_039T01_9000001444_10075cztM0_level2_quad_clean.evt |
| Size (bytes) | 426,703,680 | 82,442,880 |
| Size | 406.9 MB | 78.6 MB |
| Events in quadrant A | 2,766,595 | 542,692 |
| Events in quadrant B | 2,926,433 | 548,793 |
| Events in quadrant C | 2,642,020 | 531,818 |
| Events in quadrant D | 4,212,231 | 486,953 |
| Mode M0 | |||
|---|---|---|---|
| Quadrant | BADHDUFLAG | Total packets | Discarded packets |
| A | 0 | 12409 | 538 |
| B | 0 | 12803 | 503 |
| C | 0 | 12024 | 490 |
| D | 0 | 17156 | 938 |
| Mode M9 | |||
|---|---|---|---|
| Quadrant | BADHDUFLAG | Total packets | Discarded packets |
| A | 0 | 17 | 1 |
| B | 0 | 17 | 0 |
| C | 0 | 17 | 0 |
| D | 0 | 18 | 0 |
| Mode SS | |||
|---|---|---|---|
| Quadrant | BADHDUFLAG | Total packets | Discarded packets |
| A | 0 | 116 | 4 |
| B | 0 | 116 | 4 |
| C | 0 | 116 | 0 |
| D | 0 | 116 | 6 |
| Quadrant | Total seconds | Saturated seconds | Saturation percentage |
|---|---|---|---|
| A | 5515 | 58 | 1.051677% |
| B | 5546 | 68 | 1.226109% |
| C | 5538 | 30 | 0.541712% |
| D | 5463 | 151 | 2.764049% |
Noise dominated data is calculated using 1-second bins in cleaned event files. If a bin has >2000 counts, and if more than 50% of those come from <1% of pixels, then it is considered to be noise-dominated and hence unusable.
| Quadrant | # 1 sec bins | Bins with >0 counts | Bins with >2000 counts | High rate bins dominated by noise | Noise dominated (total time) | Noise dominated (detector-on time) | Marked lightcurve |
|---|---|---|---|---|---|---|---|
| A | 7088 | 5745 | 0 | 0 | 0.00% | 0.00% |  |
| B | 7088 | 5746 | 0 | 0 | 0.00% | 0.00% |  |
| C | 7088 | 5755 | 0 | 0 | 0.00% | 0.00% | 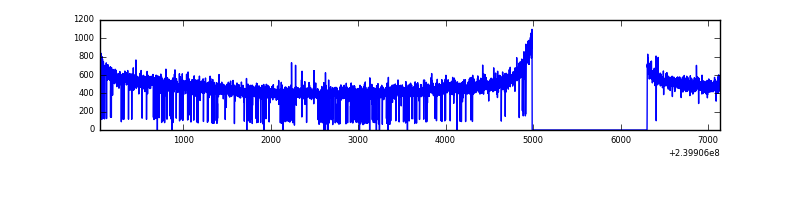 |
| D | 7088 | 5740 | 101 | 101 | 1.42% | 1.76% | 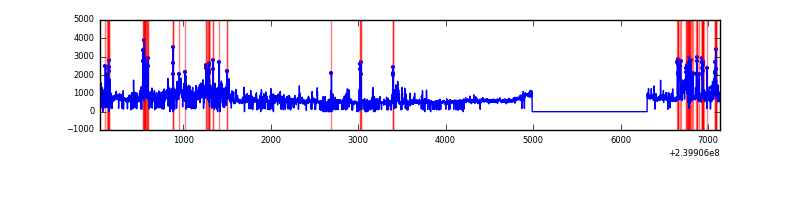 |
Top three noisy pixels from each quadrant. If the there are fewer than three noisy pixels in the level2.evt file, extra rows are filled as -1
| Pixel properties | Quadrant properties | ||||||
|---|---|---|---|---|---|---|---|
| Quadrant | DetID | PixID | Counts | Sigma | Mean | Median | Sigma |
| A | 8 | 15 | 43753 | 303.93 | 704 | 690 | 141.7 |
| A | 0 | 8 | 11672 | 77.51 | 704 | 690 | 141.7 |
| A | 0 | 226 | 6588 | 41.63 | 704 | 690 | 141.7 |
| B | 0 | 214 | 40391 | 293.9 | 708 | 693 | 135.1 |
| B | 0 | 218 | 37166 | 270.03 | 708 | 693 | 135.1 |
| B | 4 | 81 | 25597 | 184.38 | 708 | 693 | 135.1 |
| C | 13 | 61 | 5224 | 29.15 | 673 | 678 | 155.9 |
| C | 8 | 222 | 4864 | 26.84 | 673 | 678 | 155.9 |
| C | 4 | 175 | 4324 | 23.38 | 673 | 678 | 155.9 |
| D | 2 | 16 | 801959 | 4511.41 | 656 | 642 | 177.6 |
| D | 8 | 195 | 332738 | 1869.7 | 656 | 642 | 177.6 |
| D | 2 | 152 | 127108 | 712.0 | 656 | 642 | 177.6 |
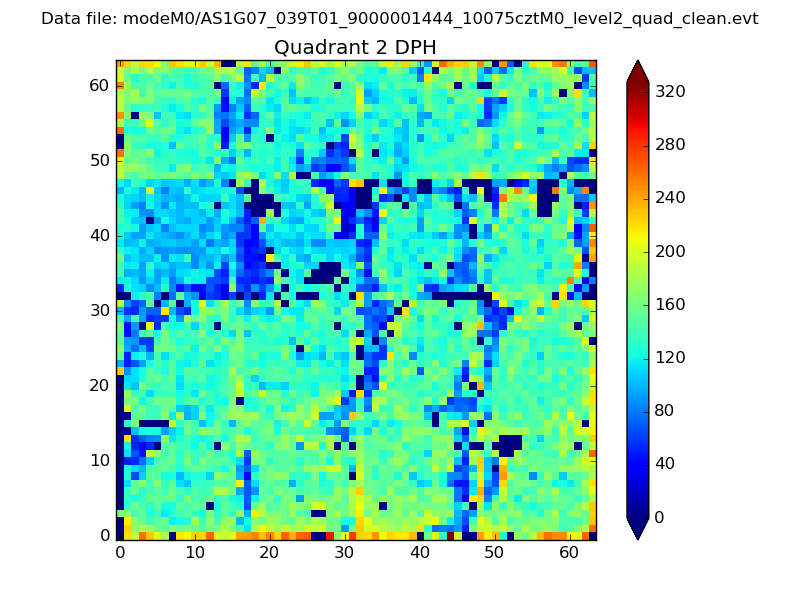
Histogram calculated using DETX and DETY for each event in the final _common_clean file
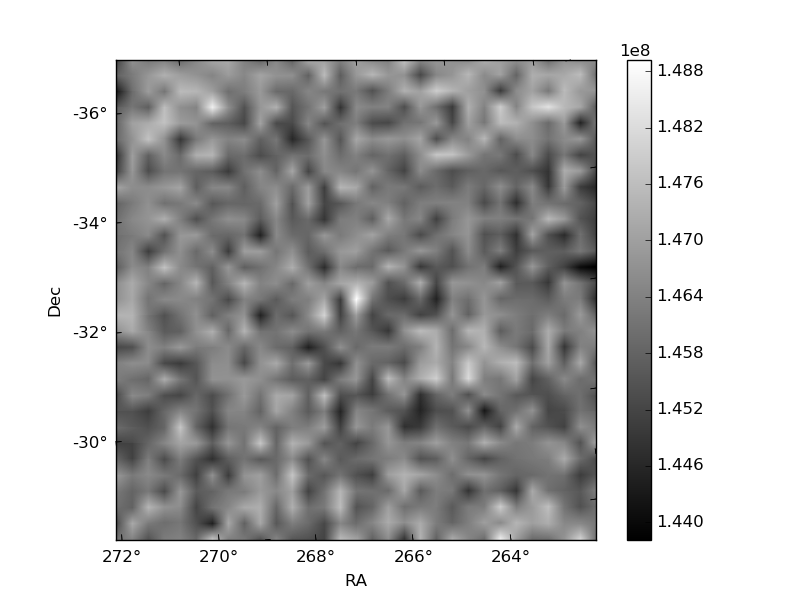
| Quadrant A | 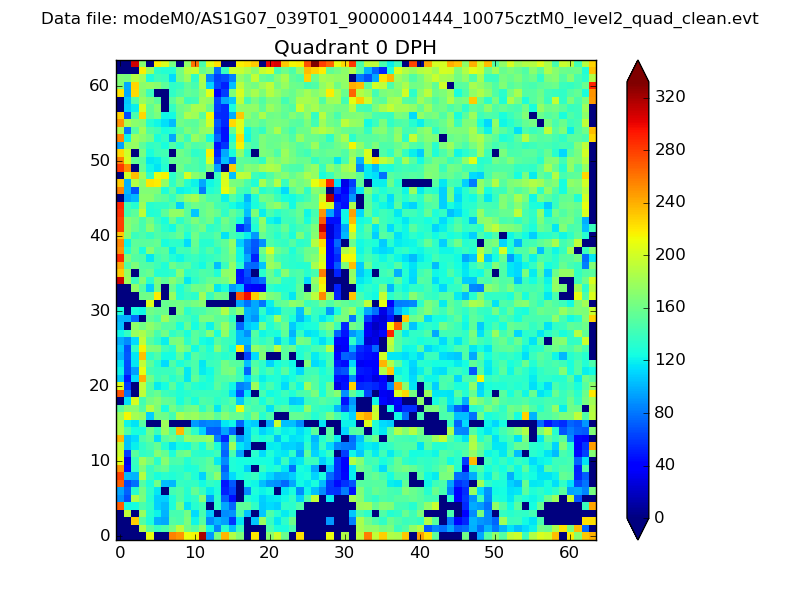 |
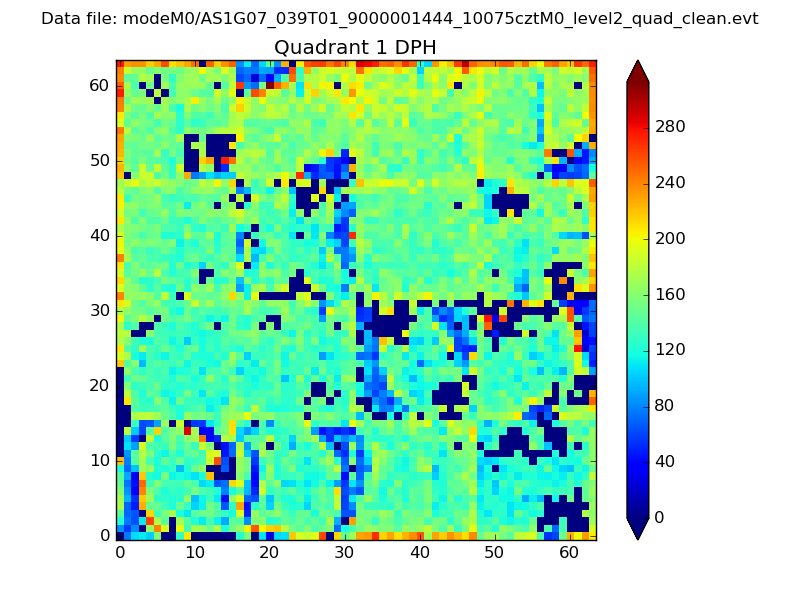 |
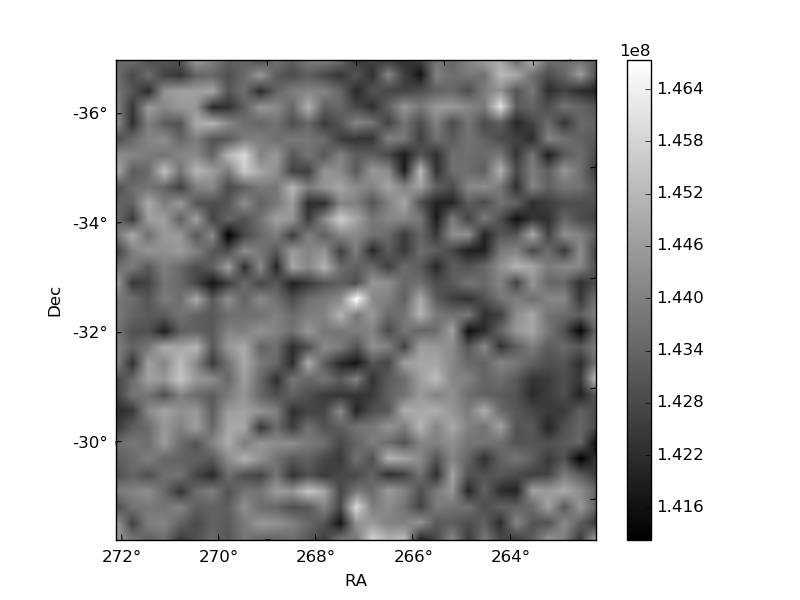
Quadrant B |
|---|---|---|---|
| Quadrant D |  |
 |
Quadrant C |
| Plot type | Count rate plots | Images |
|---|---|---|
| Comparison with Poisson distribution Blue bars denote a histogram of data divided into 1 sec bins. Red curve is a Poisson curve with rate = median count rate of data. |
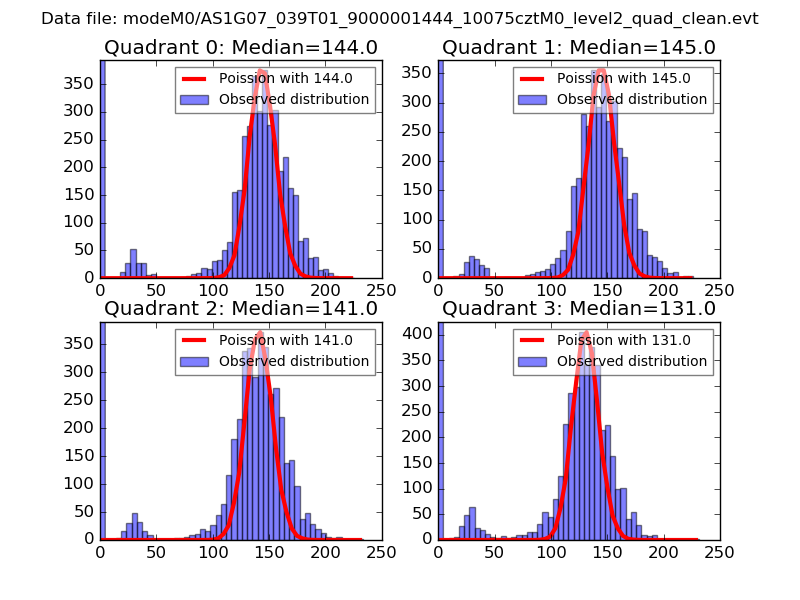 |
 |
| Quadrant-wise count rates Data is divided into 100 sec bins |
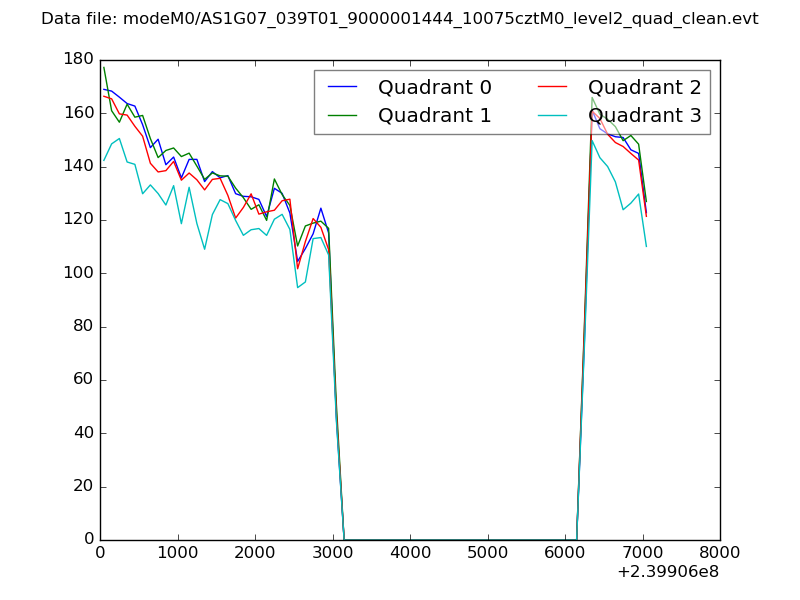 |
|
| Module-wise count rates for Quadrant A Data is divided into 100 sec bins |
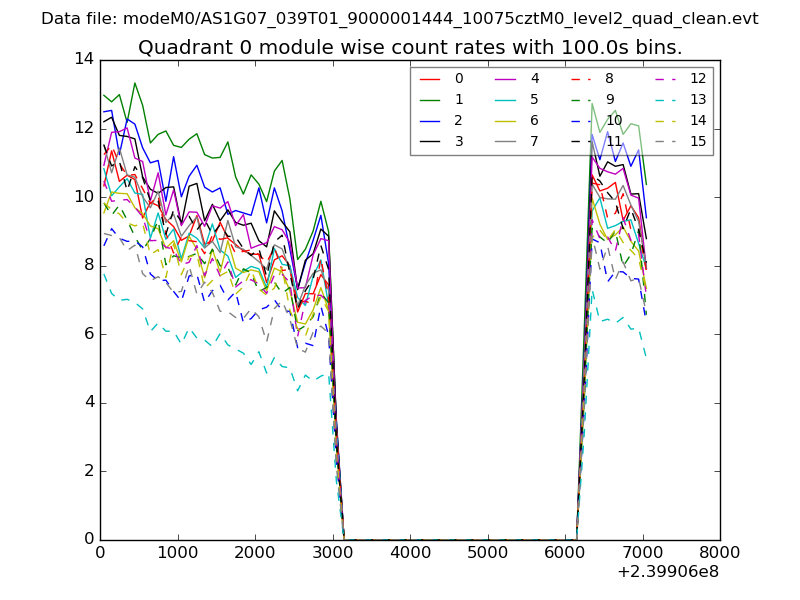 |
 |
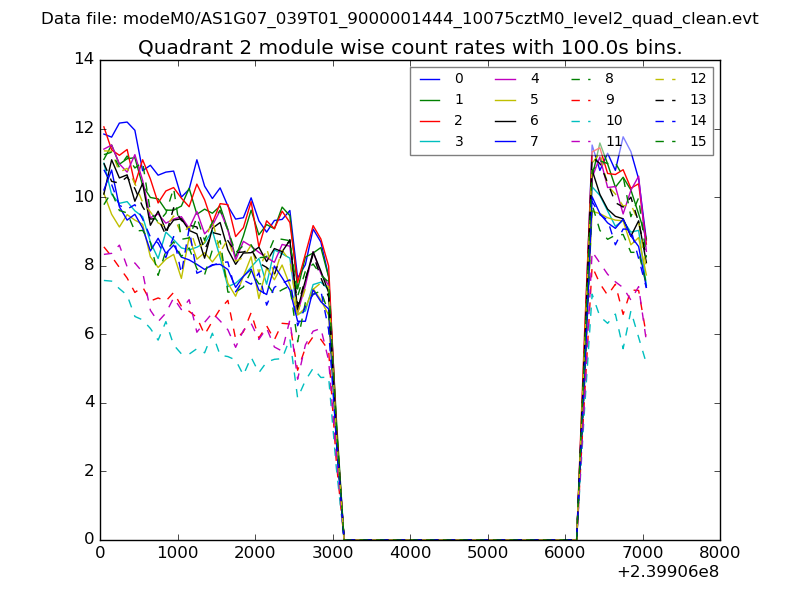
| Module-wise count rates for Quadrant B Data is divided into 100 sec bins |
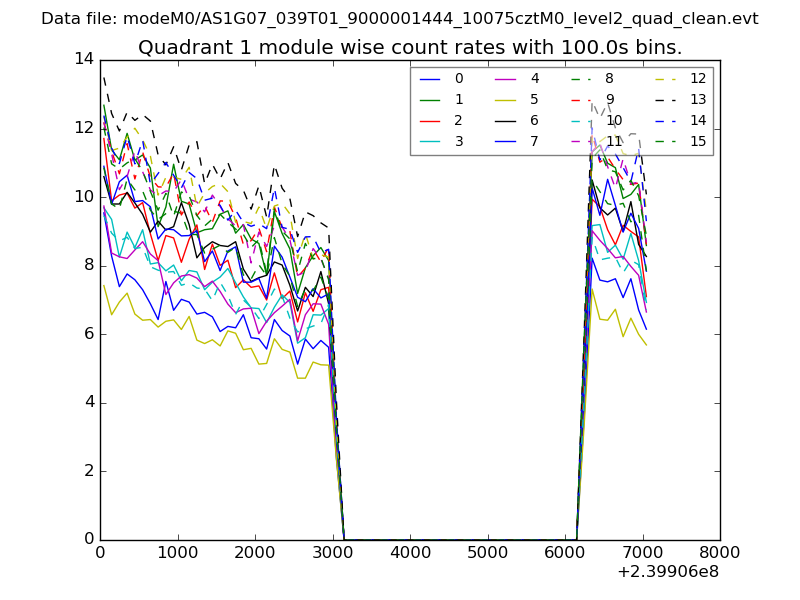 |
 |
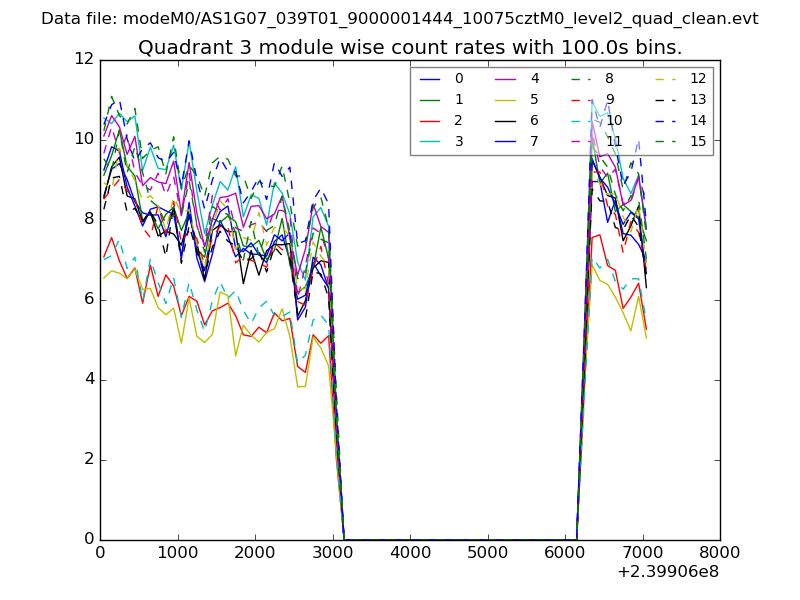
| Module-wise count rates for Quadrant C Data is divided into 100 sec bins |
 |
 |
| Module-wise count rates for Quadrant D Data is divided into 100 sec bins |
 |
 |
| Parameter | Plot |
|---|---|
| CZT HV Monitor | 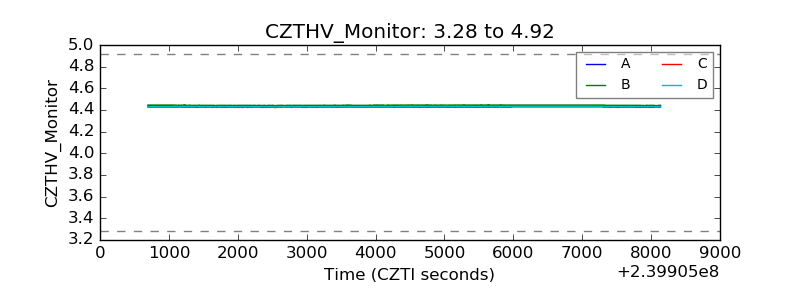 |
| D_VDD | 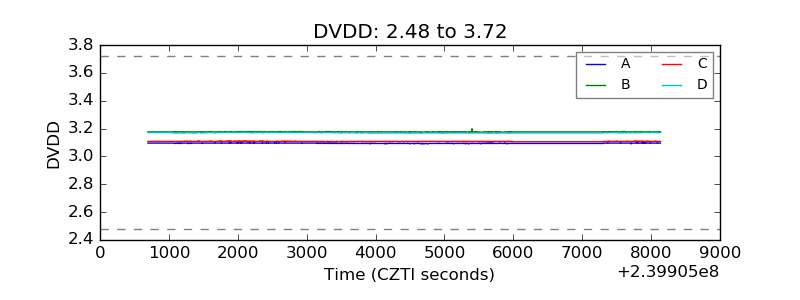 |
| Temperature 1 | 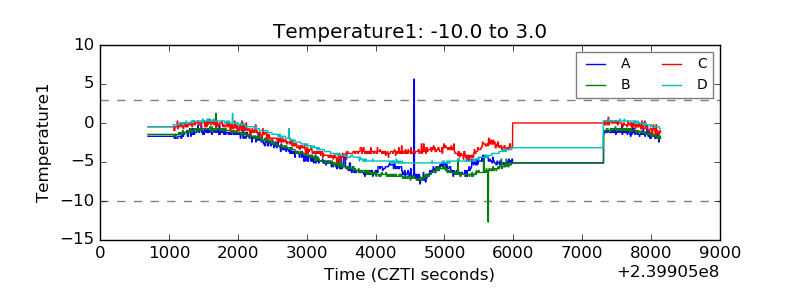 |
| Veto HV Monitor | 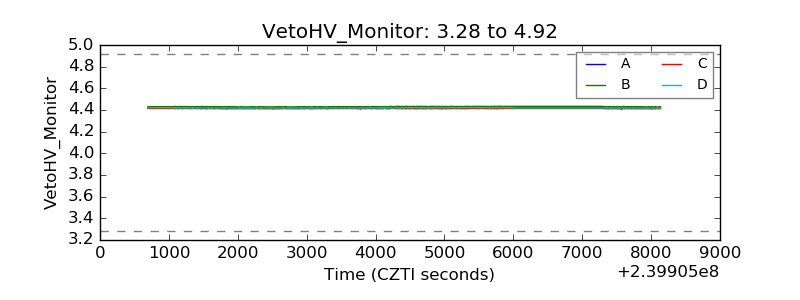 |
| Veto LLD | 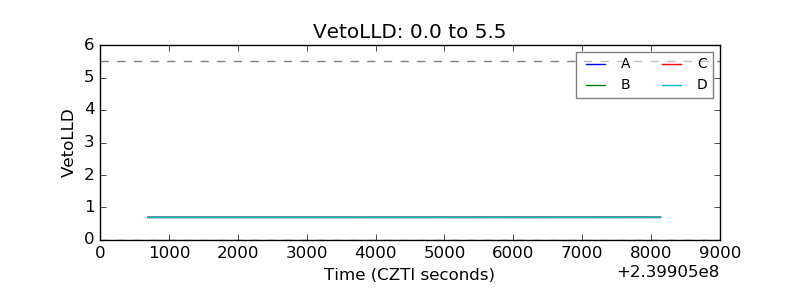 |
| Alpha Counter | 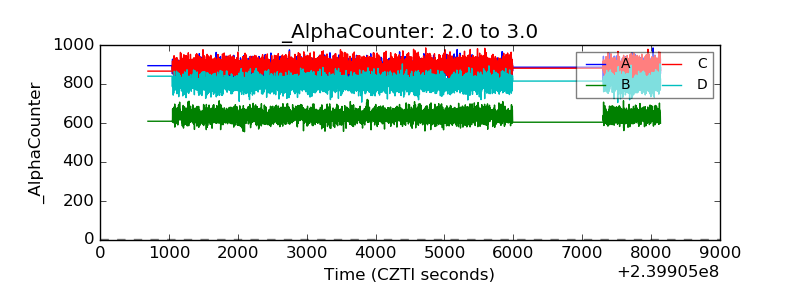 |
| _CPM_Rate | 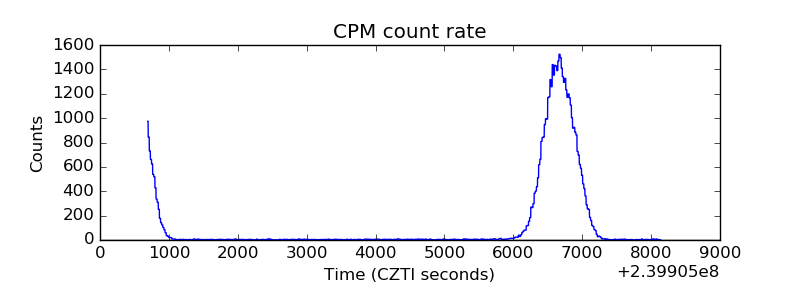 |
| CZT Counter | 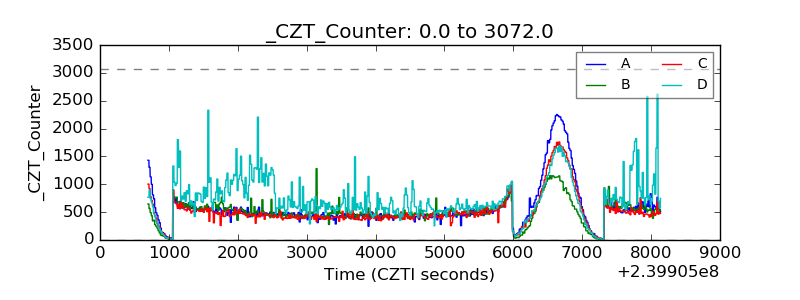 |
| +2.5 Volts monitor | 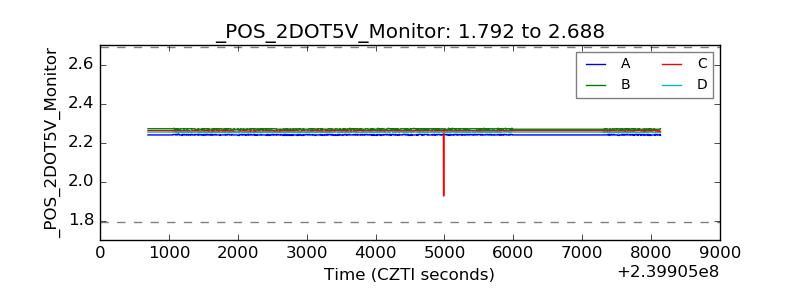 |
| +5 Volts monitor |  |
| _ROLL_ROT | 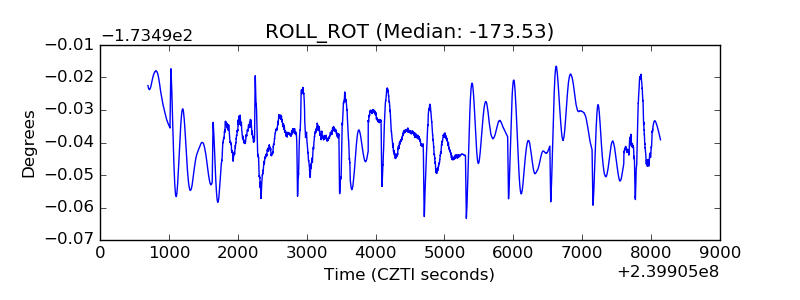 |
| _Roll_DEC | 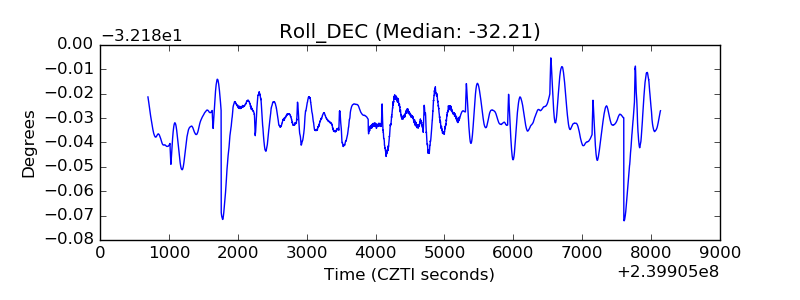 |
| _Roll_RA | 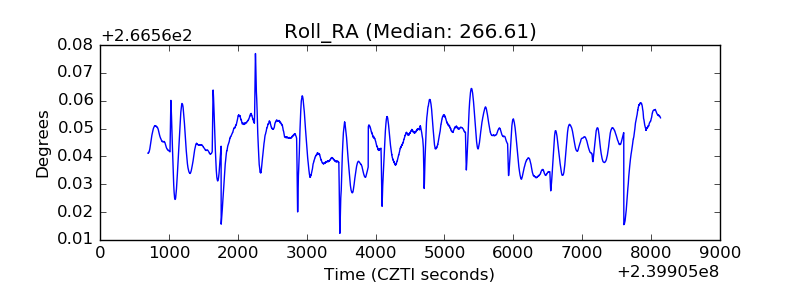 |
| Veto Counter | 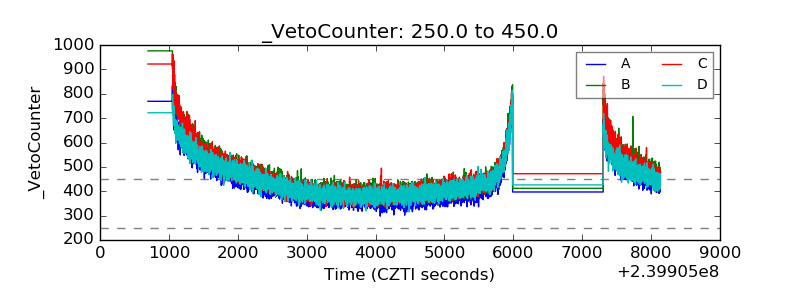 |