| Param | Original file | Final file |
|---|---|---|
| Filename | modeM0/AS1G07_014T01_9000001450_10083cztM0_level2.evt | modeM0/AS1G07_014T01_9000001450_10083cztM0_level2_quad_clean.evt |
| Size (bytes) | 559,929,600 | 96,664,320 |
| Size | 534.0 MB | 92.2 MB |
| Events in quadrant A | 3,659,408 | 598,280 |
| Events in quadrant B | 3,843,064 | 606,845 |
| Events in quadrant C | 3,602,495 | 623,470 |
| Events in quadrant D | 5,291,138 | 525,017 |
| Mode M0 | |||
|---|---|---|---|
| Quadrant | BADHDUFLAG | Total packets | Discarded packets |
| A | 0 | 34924 | 18161 |
| B | 0 | 35582 | 18558 |
| C | 0 | 34985 | 18223 |
| D | 0 | 44505 | 23740 |
| Mode SS | |||
|---|---|---|---|
| Quadrant | BADHDUFLAG | Total packets | Discarded packets |
| A | 0 | 352 | 178 |
| B | 0 | 351 | 184 |
| C | 0 | 352 | 182 |
| D | 0 | 352 | 176 |
| Mode M9 | |||
|---|---|---|---|
| Quadrant | BADHDUFLAG | Total packets | Discarded packets |
| A | 0 | 23 | 18 |
| B | 0 | 22 | 14 |
| C | 0 | 23 | 16 |
| D | 0 | 23 | 15 |
| Quadrant | Total seconds | Saturated seconds | Saturation percentage |
|---|---|---|---|
| A | 8281 | 43 | 0.519261% |
| B | 8268 | 58 | 0.701500% |
| C | 8278 | 43 | 0.519449% |
| D | 8029 | 499 | 6.214971% |
Noise dominated data is calculated using 1-second bins in cleaned event files. If a bin has >2000 counts, and if more than 50% of those come from <1% of pixels, then it is considered to be noise-dominated and hence unusable.
| Quadrant | # 1 sec bins | Bins with >0 counts | Bins with >2000 counts | High rate bins dominated by noise | Noise dominated (total time) | Noise dominated (detector-on time) | Marked lightcurve |
|---|---|---|---|---|---|---|---|
| A | 19539 | 9297 | 0 | 0 | 0.00% | 0.00% | 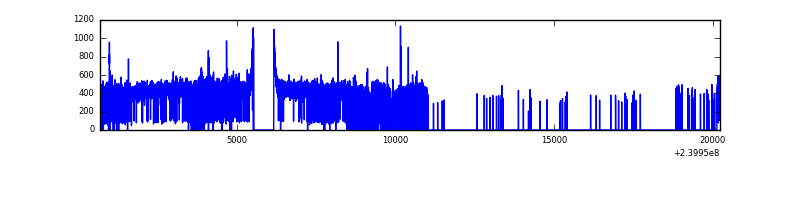 |
| B | 19539 | 9288 | 4 | 4 | 0.02% | 0.04% | 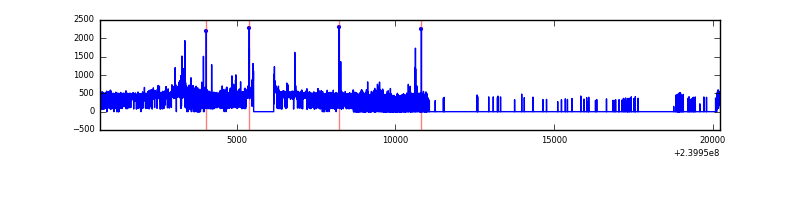 |
| C | 19539 | 9274 | 0 | 0 | 0.00% | 0.00% | 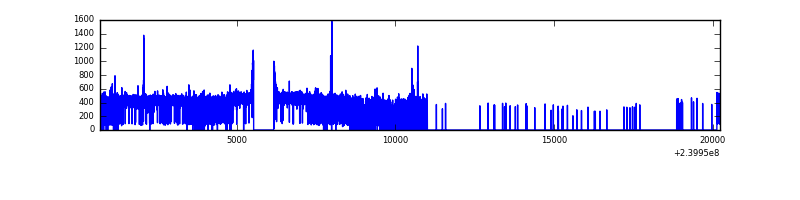 |
| D | 19539 | 9028 | 442 | 442 | 2.26% | 4.90% | 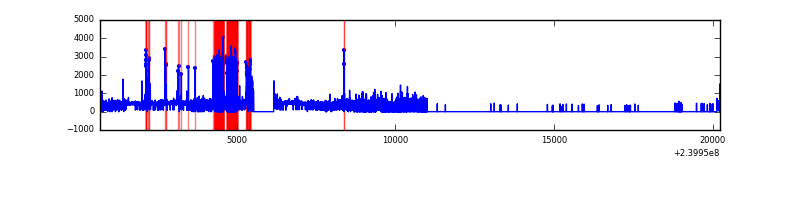 |
Top three noisy pixels from each quadrant. If the there are fewer than three noisy pixels in the level2.evt file, extra rows are filled as -1
| Pixel properties | Quadrant properties | ||||||
|---|---|---|---|---|---|---|---|
| Quadrant | DetID | PixID | Counts | Sigma | Mean | Median | Sigma |
| A | 0 | 8 | 30808 | 157.4 | 933 | 912 | 189.9 |
| A | 8 | 5 | 15545 | 77.04 | 933 | 912 | 189.9 |
| A | 0 | 226 | 8539 | 40.16 | 933 | 912 | 189.9 |
| B | 0 | 214 | 94230 | 522.28 | 937 | 913 | 178.7 |
| B | 4 | 239 | 44207 | 242.31 | 937 | 913 | 178.7 |
| B | 0 | 219 | 33573 | 182.79 | 937 | 913 | 178.7 |
| C | 14 | 234 | 21088 | 94.88 | 915 | 918 | 212.6 |
| C | 14 | 67 | 8926 | 37.67 | 915 | 918 | 212.6 |
| C | 13 | 61 | 6900 | 28.14 | 915 | 918 | 212.6 |
| D | 1 | 52 | 1218184 | 5759.89 | 849 | 824 | 211.4 |
| D | 8 | 195 | 302446 | 1427.11 | 849 | 824 | 211.4 |
| D | 10 | 199 | 171391 | 807.03 | 849 | 824 | 211.4 |
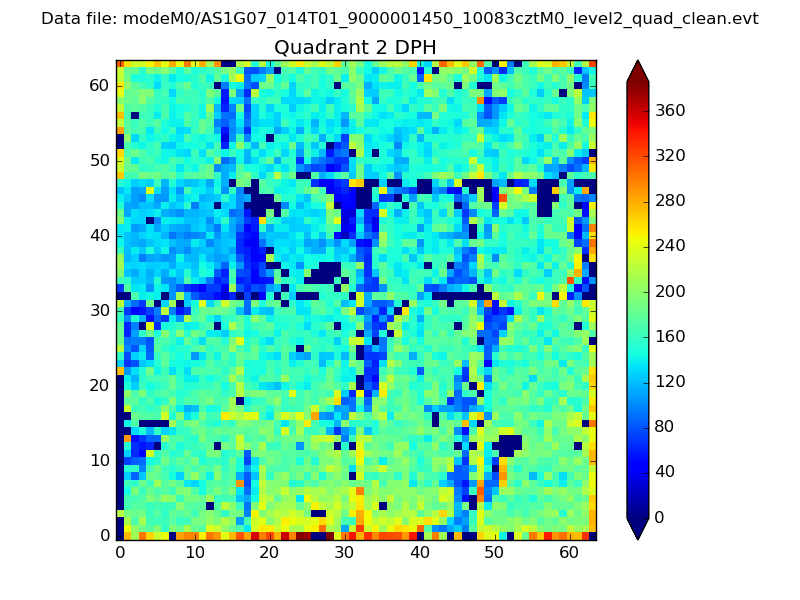
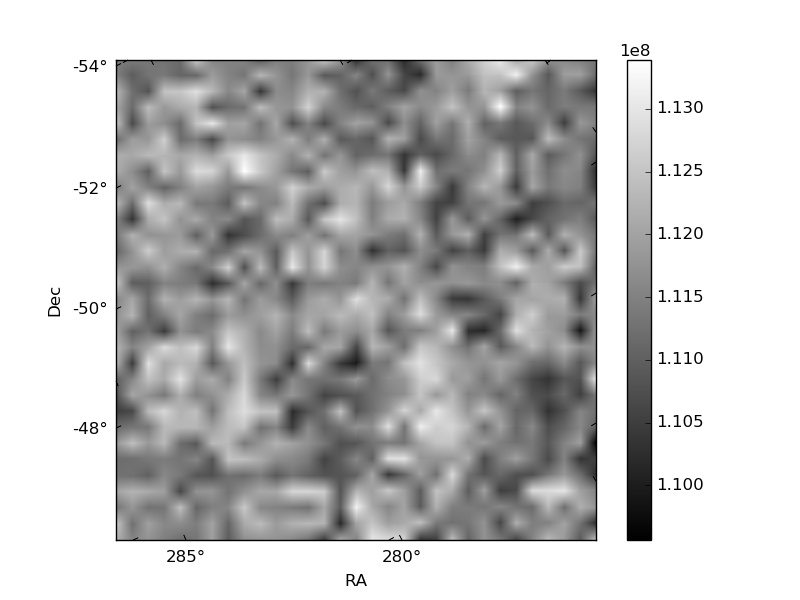
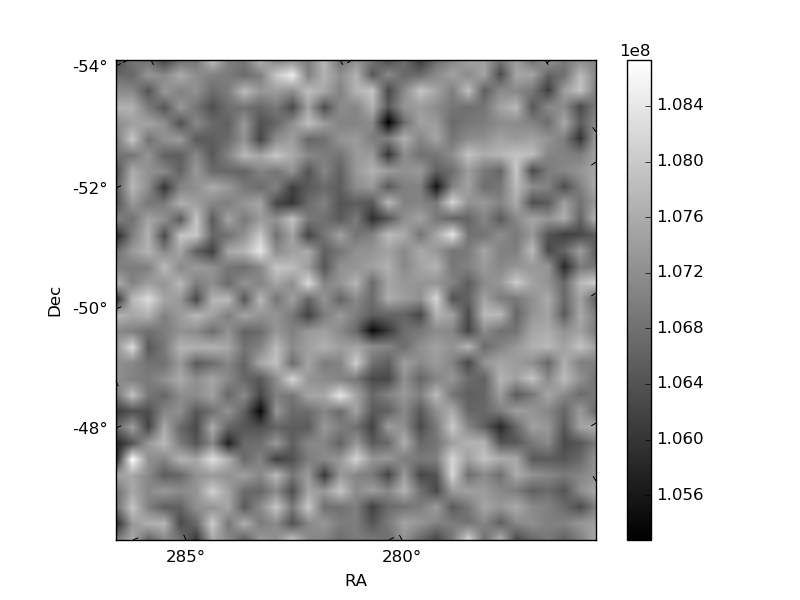
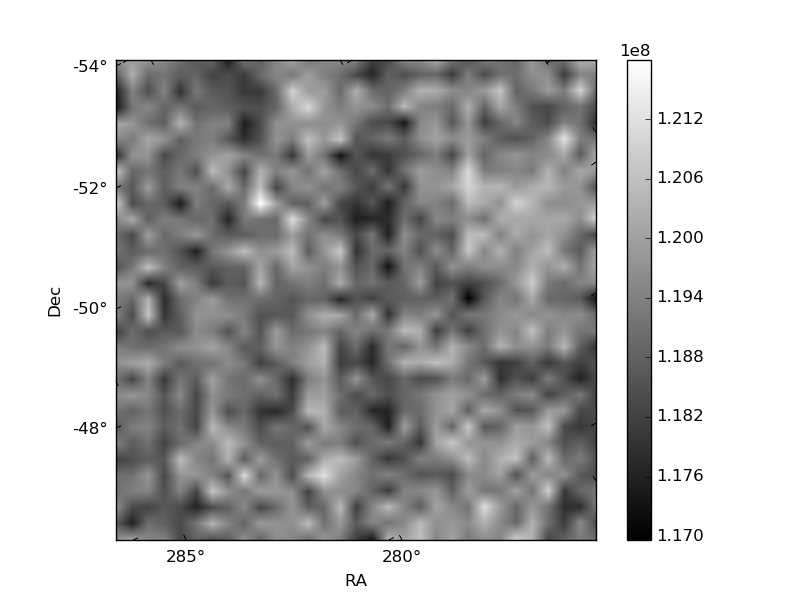
Histogram calculated using DETX and DETY for each event in the final _common_clean file
| Quadrant A | 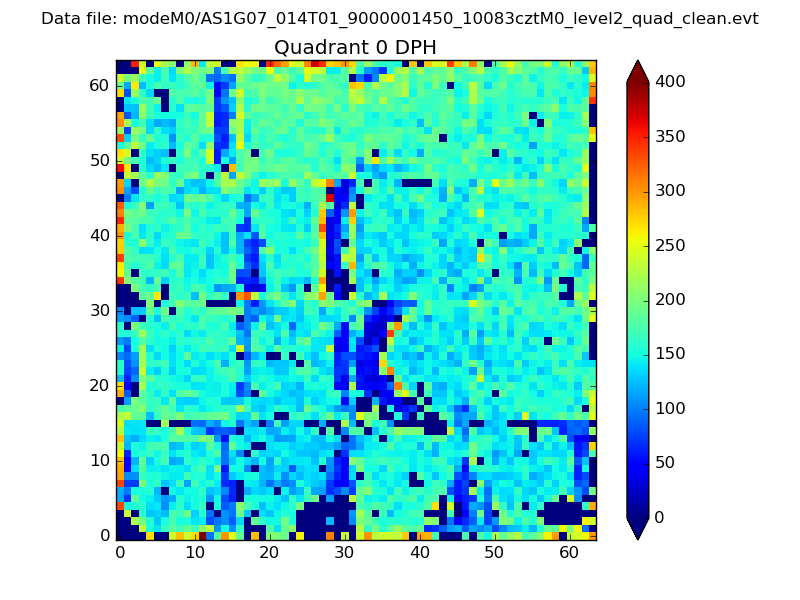 |
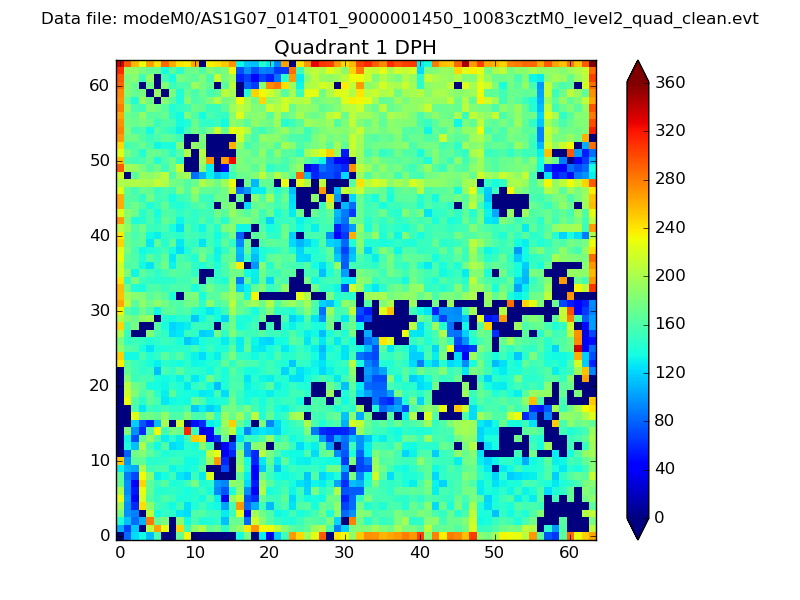 |
Quadrant B |
|---|---|---|---|
| Quadrant D | 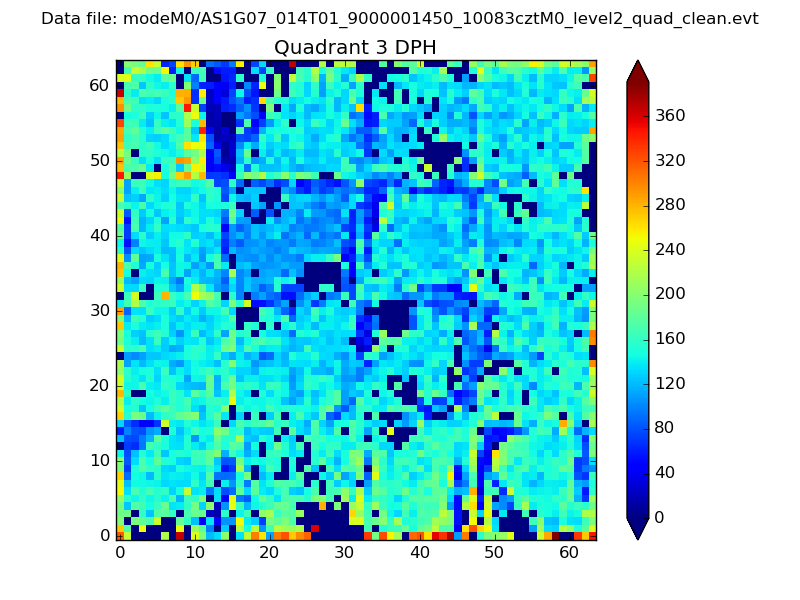 |
 |
Quadrant C |
| Plot type | Count rate plots | Images |
|---|---|---|
| Comparison with Poisson distribution Blue bars denote a histogram of data divided into 1 sec bins. Red curve is a Poisson curve with rate = median count rate of data. |
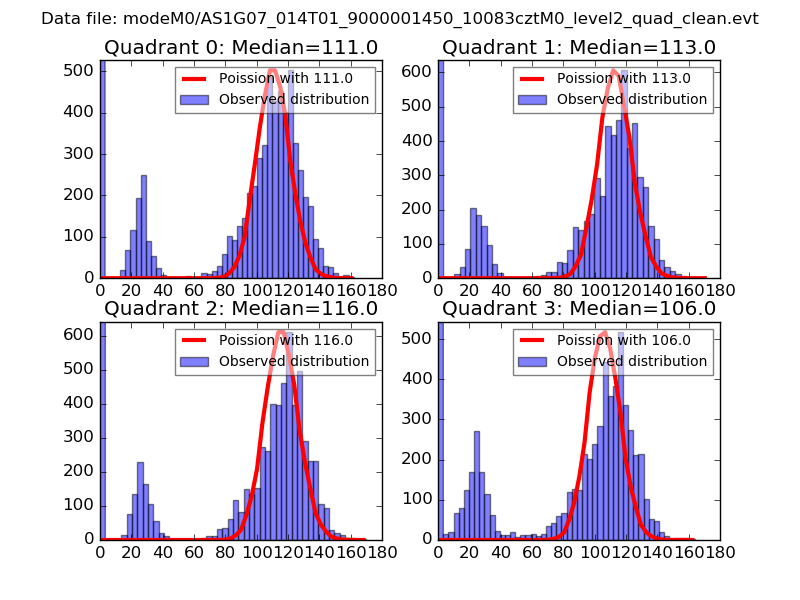 |
 |
| Quadrant-wise count rates Data is divided into 100 sec bins |
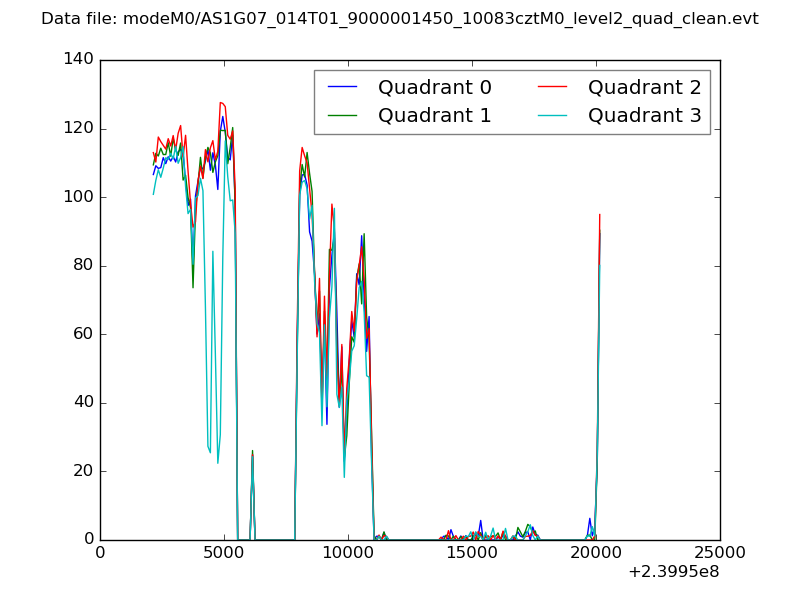 |
|
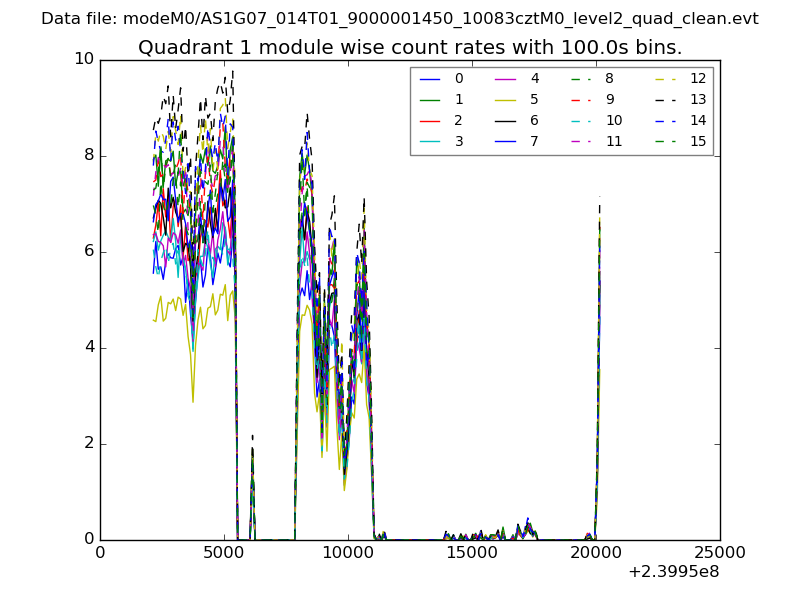
| Module-wise count rates for Quadrant A Data is divided into 100 sec bins |
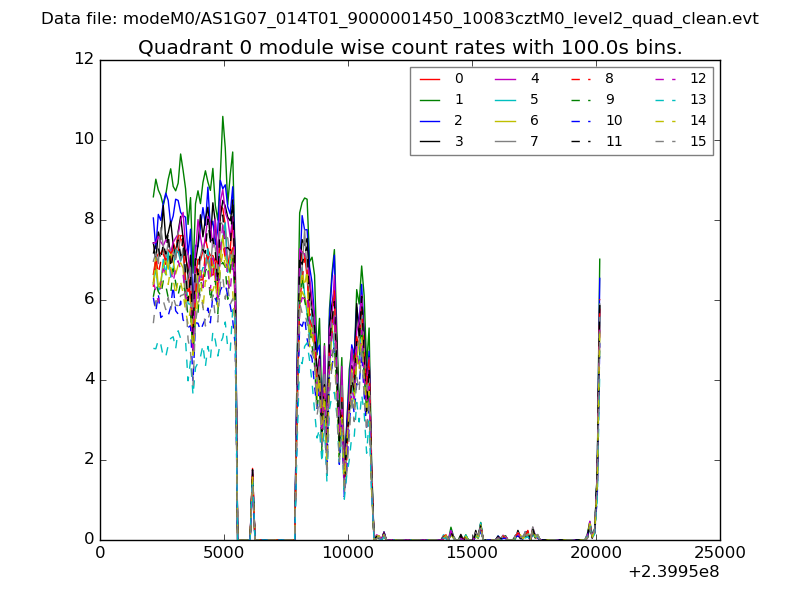 |
 |
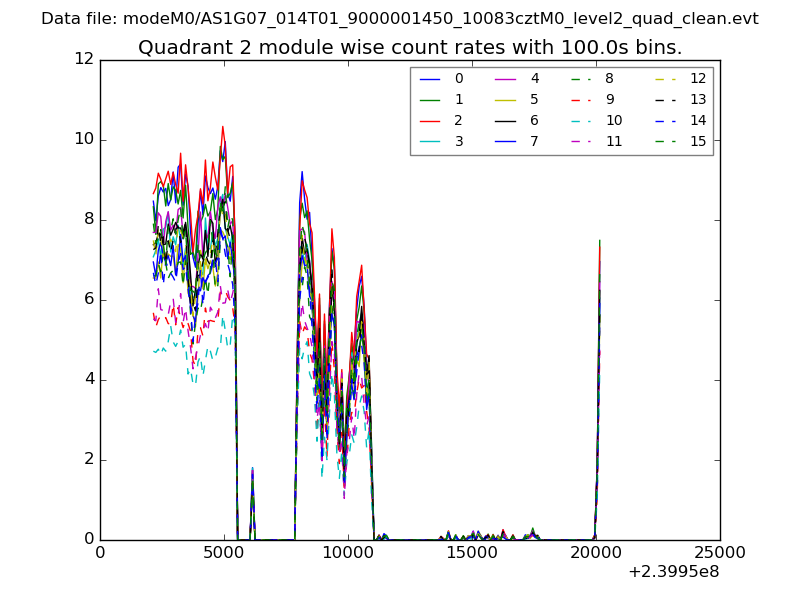
| Module-wise count rates for Quadrant B Data is divided into 100 sec bins |
 |
 |
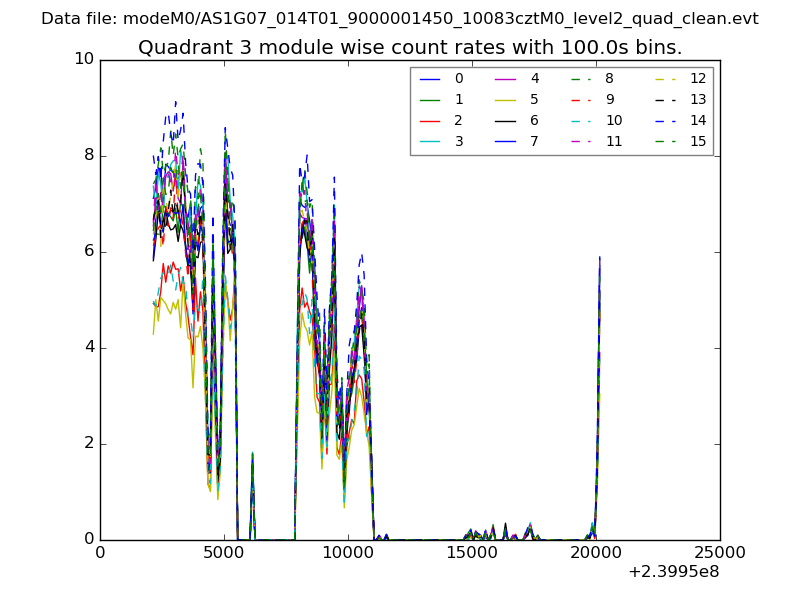
| Module-wise count rates for Quadrant C Data is divided into 100 sec bins |
 |
 |
| Module-wise count rates for Quadrant D Data is divided into 100 sec bins |
 |
 |
| Parameter | Plot |
|---|---|
| CZT HV Monitor | 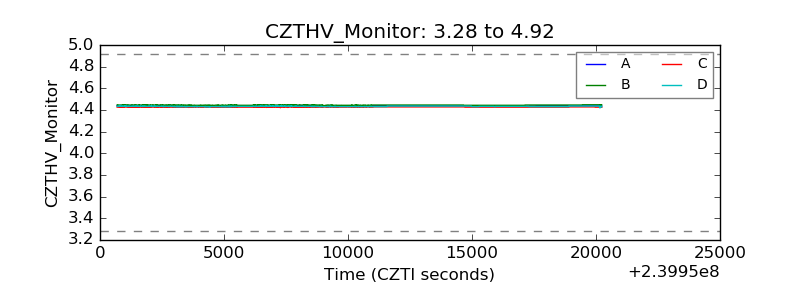 |
| D_VDD |  |
| Temperature 1 | 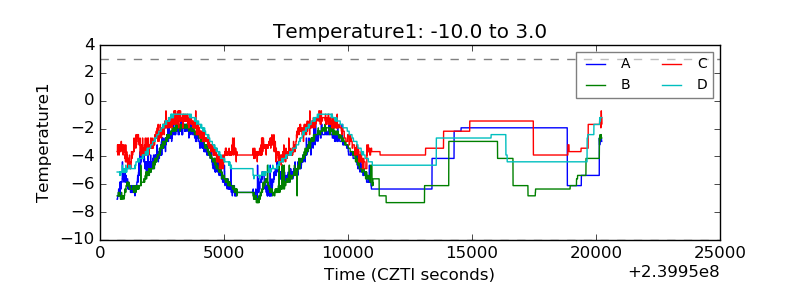 |
| Veto HV Monitor | 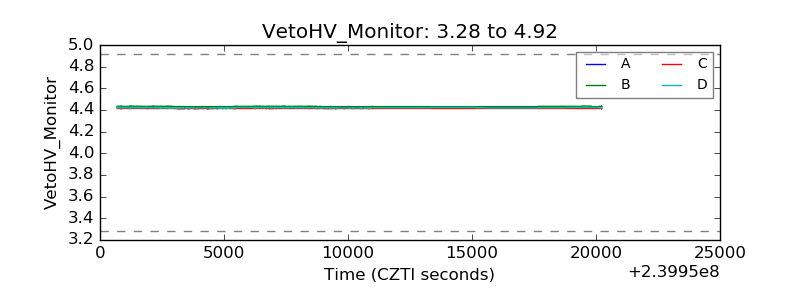 |
| Veto LLD | 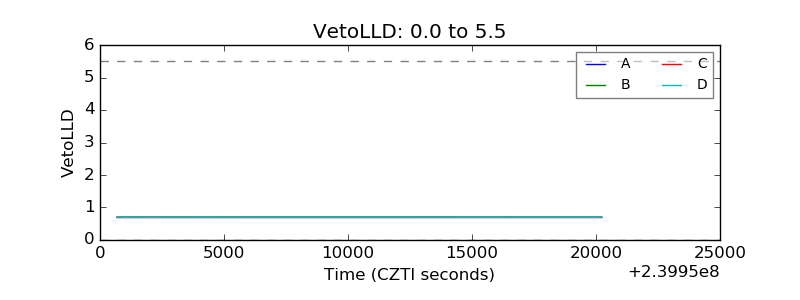 |
| Alpha Counter | 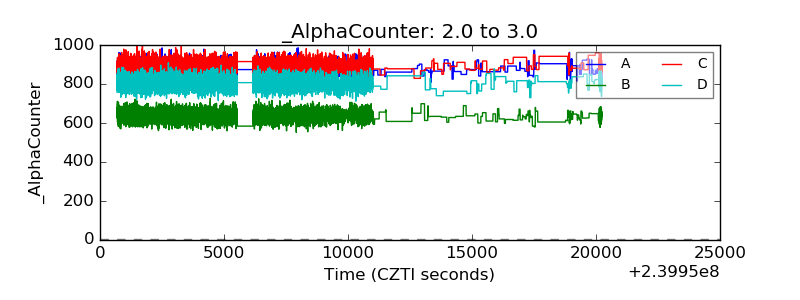 |
| _CPM_Rate | 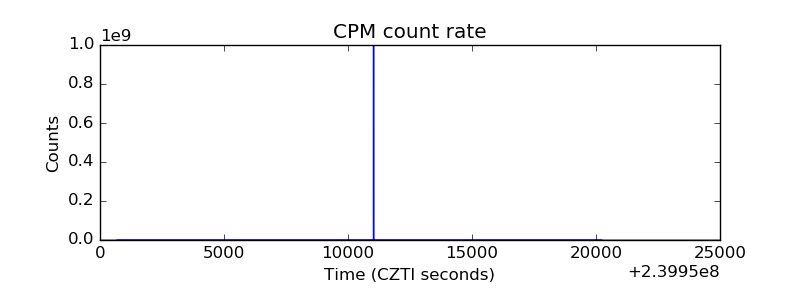 |
| CZT Counter | 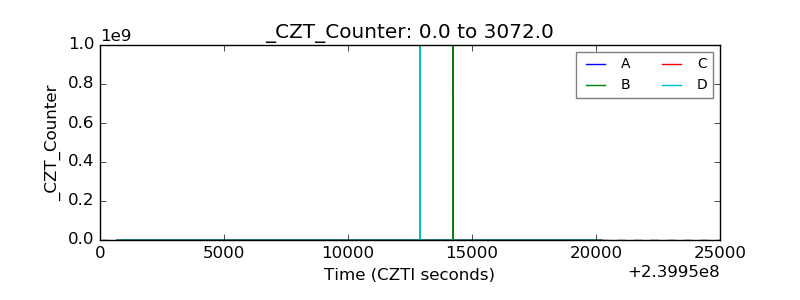 |
| +2.5 Volts monitor |  |
| +5 Volts monitor |  |
| _ROLL_ROT | 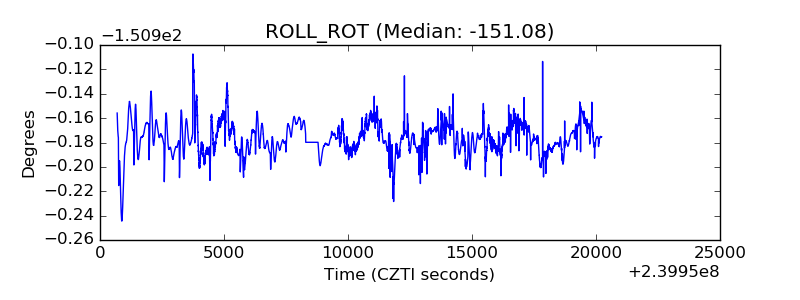 |
| _Roll_DEC | 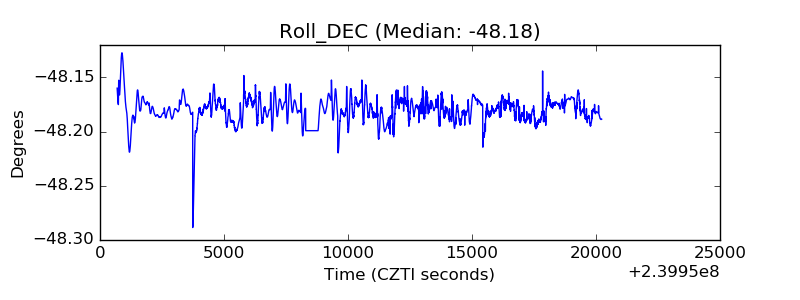 |
| _Roll_RA |  |
| Veto Counter | 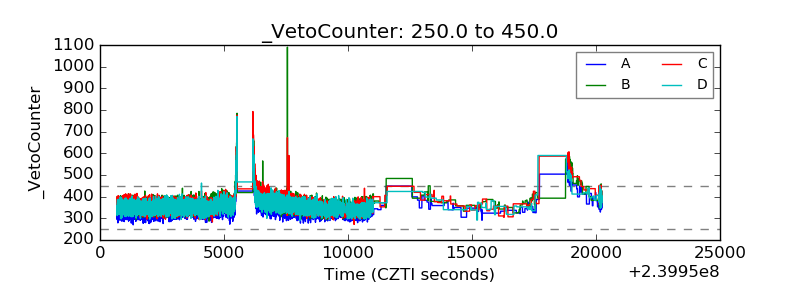 |