| Param | Original file | Final file |
|---|---|---|
| Filename | modeM0/AS1G07_014T01_9000001450_10087cztM0_level2.evt | modeM0/AS1G07_014T01_9000001450_10087cztM0_level2_quad_clean.evt |
| Size (bytes) | 497,989,440 | 109,618,560 |
| Size | 474.9 MB | 104.5 MB |
| Events in quadrant A | 3,301,871 | 734,144 |
| Events in quadrant B | 3,738,934 | 738,202 |
| Events in quadrant C | 2,923,758 | 731,026 |
| Events in quadrant D | 4,697,006 | 684,163 |
| Mode M0 | |||
|---|---|---|---|
| Quadrant | BADHDUFLAG | Total packets | Discarded packets |
| A | 0 | 13579 | 2 |
| B | 0 | 15414 | 1 |
| C | 0 | 12817 | 1 |
| D | 0 | 18017 | 1 |
| Mode SS | |||
|---|---|---|---|
| Quadrant | BADHDUFLAG | Total packets | Discarded packets |
| A | 0 | 126 | 0 |
| B | 0 | 126 | 0 |
| C | 0 | 126 | 0 |
| D | 0 | 126 | 0 |
| Mode M9 | |||
|---|---|---|---|
| Quadrant | BADHDUFLAG | Total packets | Discarded packets |
| A | 0 | 12 | 0 |
| B | 0 | 12 | 0 |
| C | 0 | 12 | 0 |
| D | 0 | 12 | 0 |
| Quadrant | Total seconds | Saturated seconds | Saturation percentage |
|---|---|---|---|
| A | 6192 | 75 | 1.211240% |
| B | 6192 | 173 | 2.793928% |
| C | 6192 | 52 | 0.839793% |
| D | 6192 | 452 | 7.299742% |
Noise dominated data is calculated using 1-second bins in cleaned event files. If a bin has >2000 counts, and if more than 50% of those come from <1% of pixels, then it is considered to be noise-dominated and hence unusable.
| Quadrant | # 1 sec bins | Bins with >0 counts | Bins with >2000 counts | High rate bins dominated by noise | Noise dominated (total time) | Noise dominated (detector-on time) | Marked lightcurve |
|---|---|---|---|---|---|---|---|
| A | 7432 | 6192 | 0 | 0 | 0.00% | 0.00% | 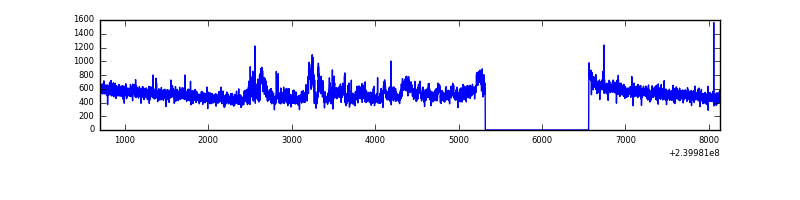 |
| B | 7432 | 6192 | 79 | 79 | 1.06% | 1.28% | 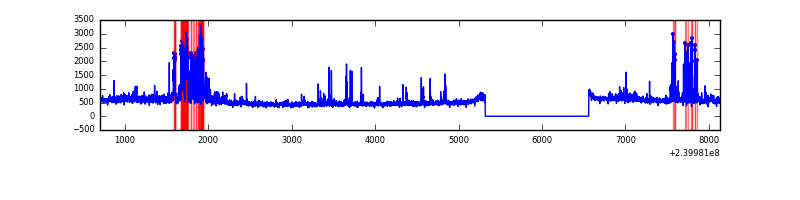 |
| C | 7432 | 6192 | 0 | 0 | 0.00% | 0.00% | 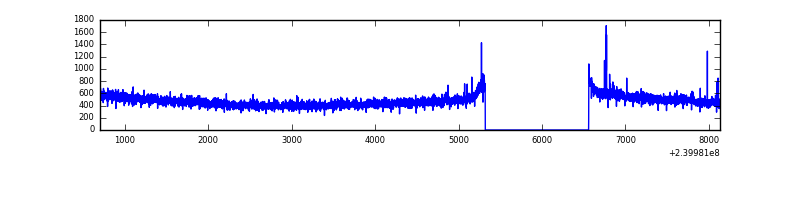 |
| D | 7432 | 6192 | 342 | 342 | 4.60% | 5.52% | 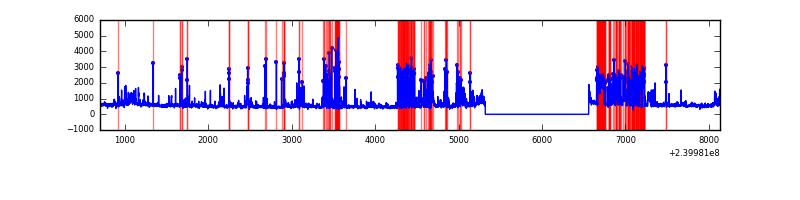 |
Top three noisy pixels from each quadrant. If the there are fewer than three noisy pixels in the level2.evt file, extra rows are filled as -1
| Pixel properties | Quadrant properties | ||||||
|---|---|---|---|---|---|---|---|
| Quadrant | DetID | PixID | Counts | Sigma | Mean | Median | Sigma |
| A | 8 | 15 | 298524 | 1912.27 | 774 | 759 | 155.7 |
| A | 13 | 251 | 7986 | 46.41 | 774 | 759 | 155.7 |
| A | 0 | 226 | 7380 | 42.52 | 774 | 759 | 155.7 |
| B | 4 | 81 | 405922 | 2813.9 | 767 | 750 | 144.0 |
| B | 0 | 214 | 136311 | 941.47 | 767 | 750 | 144.0 |
| B | 4 | 174 | 111533 | 769.38 | 767 | 750 | 144.0 |
| C | 4 | 175 | 11901 | 66.09 | 739 | 742 | 168.8 |
| C | 14 | 234 | 11154 | 61.67 | 739 | 742 | 168.8 |
| C | 10 | 22 | 9791 | 53.6 | 739 | 742 | 168.8 |
| D | 1 | 52 | 1156111 | 5971.25 | 723 | 707 | 193.5 |
| D | 8 | 195 | 284378 | 1466.04 | 723 | 707 | 193.5 |
| D | 12 | 110 | 132443 | 680.83 | 723 | 707 | 193.5 |
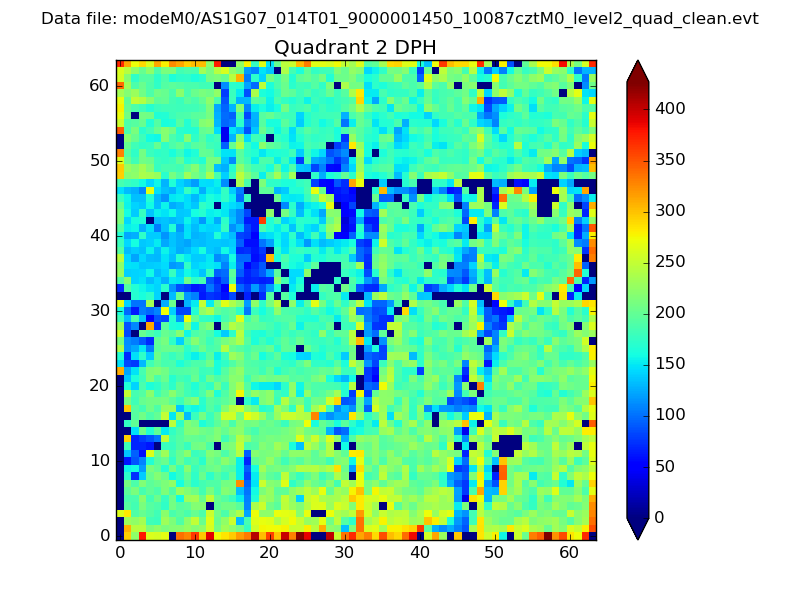
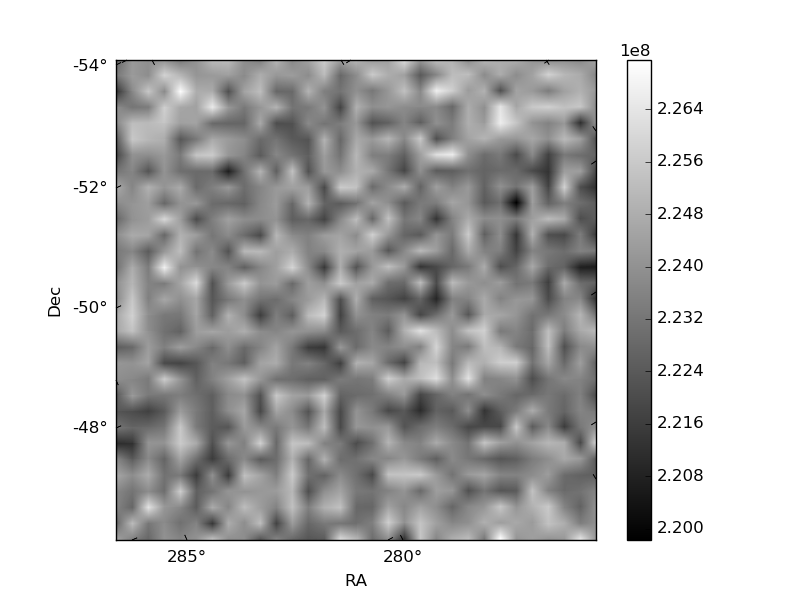
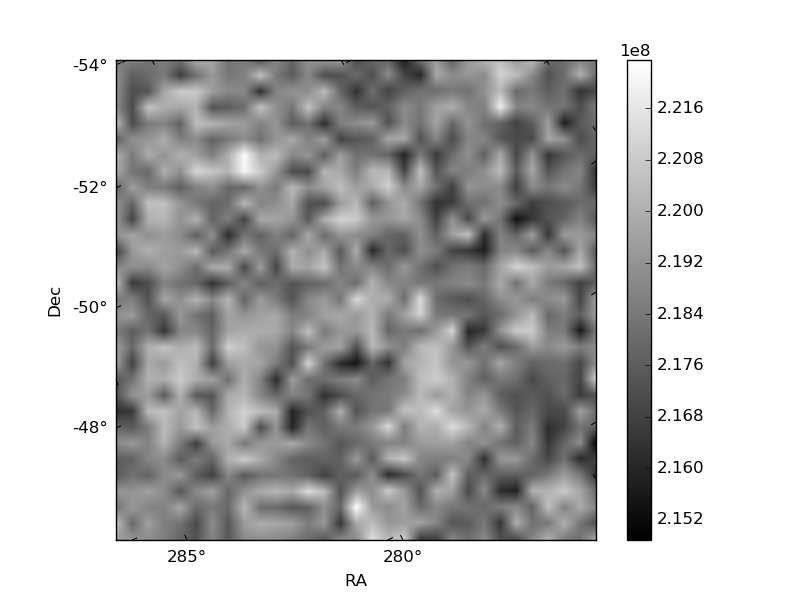
Histogram calculated using DETX and DETY for each event in the final _common_clean file
| Quadrant A | 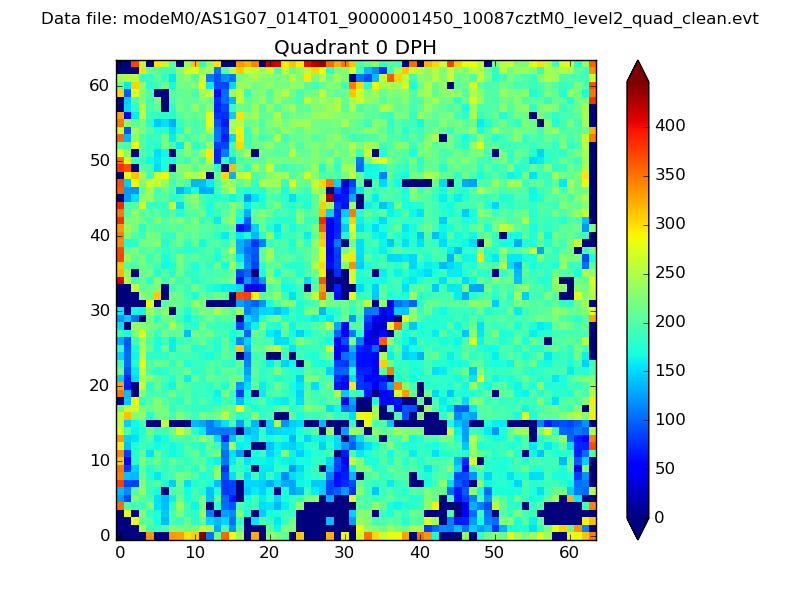 |
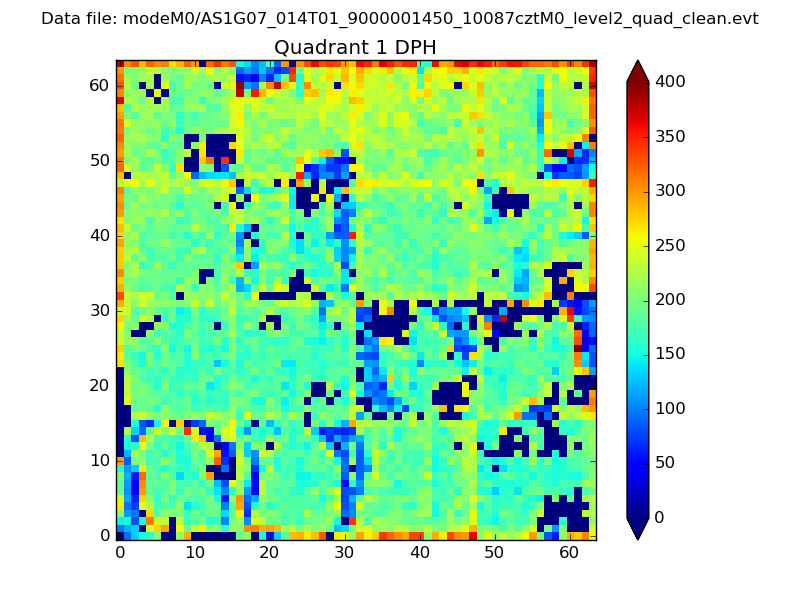 |
Quadrant B |
|---|---|---|---|
| Quadrant D | 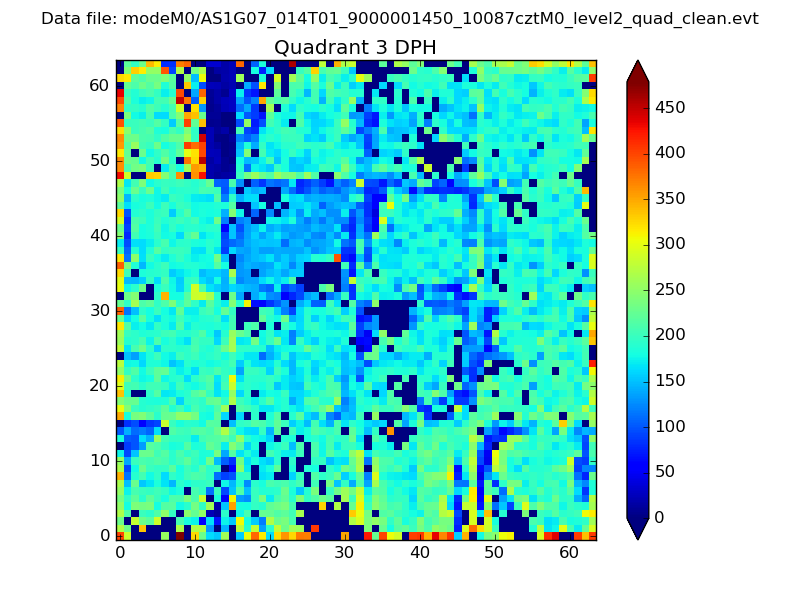 |
 |
Quadrant C |
| Plot type | Count rate plots | Images |
|---|---|---|
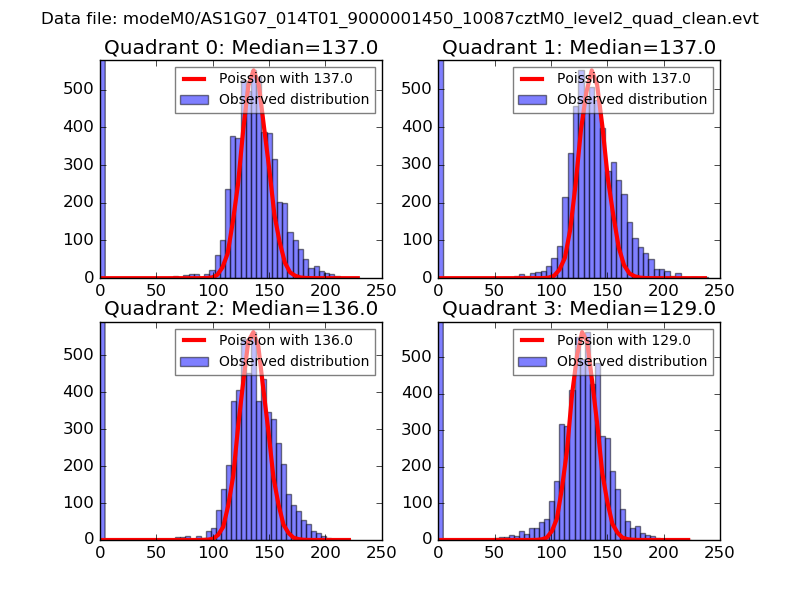
| Comparison with Poisson distribution Blue bars denote a histogram of data divided into 1 sec bins. Red curve is a Poisson curve with rate = median count rate of data. |
 |
 |
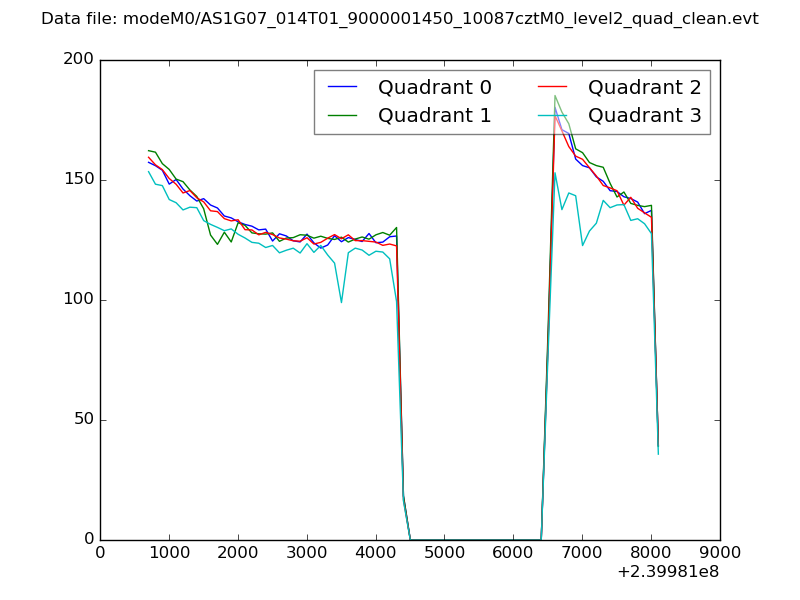
| Quadrant-wise count rates Data is divided into 100 sec bins |
 |
|
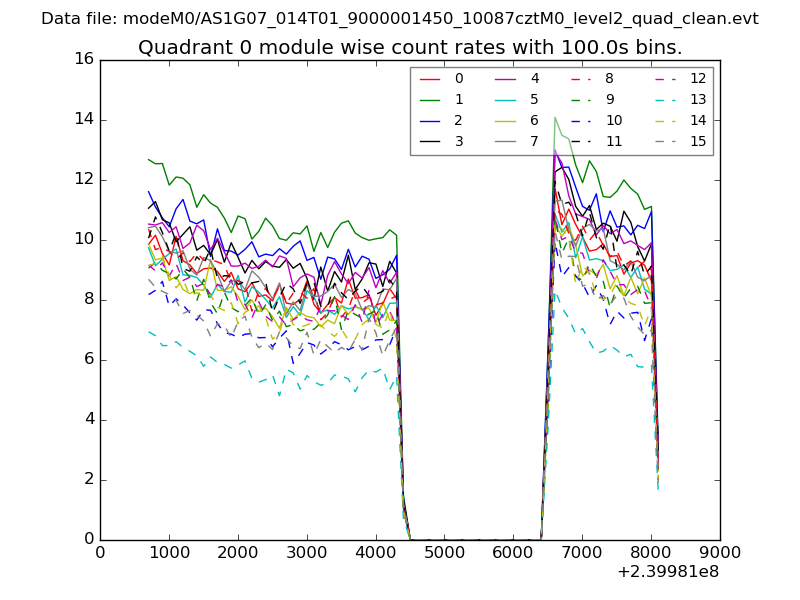
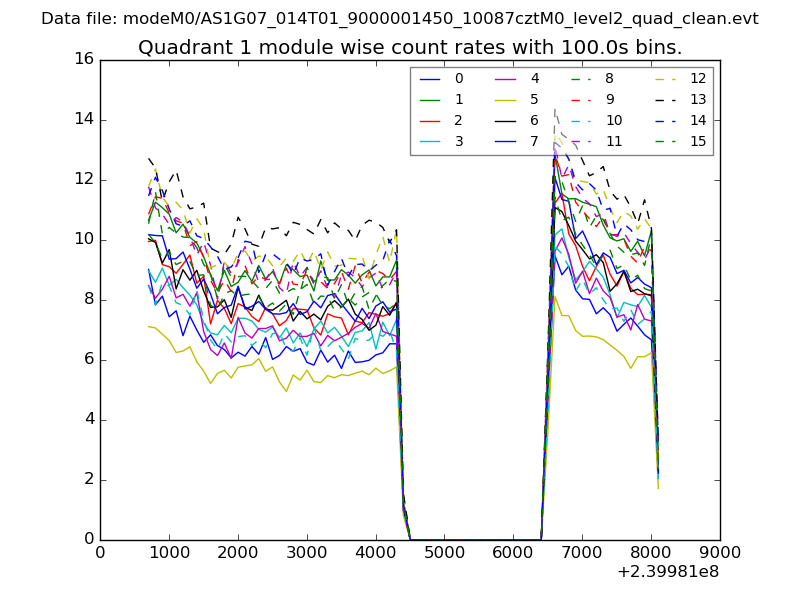
| Module-wise count rates for Quadrant A Data is divided into 100 sec bins |
 |
 |
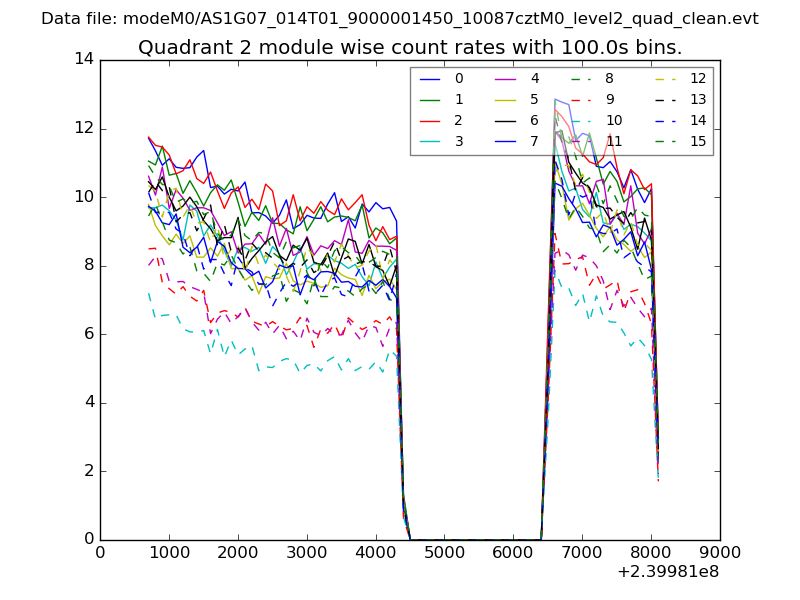
| Module-wise count rates for Quadrant B Data is divided into 100 sec bins |
 |
 |
| Module-wise count rates for Quadrant C Data is divided into 100 sec bins |
 |
 |
| Module-wise count rates for Quadrant D Data is divided into 100 sec bins |
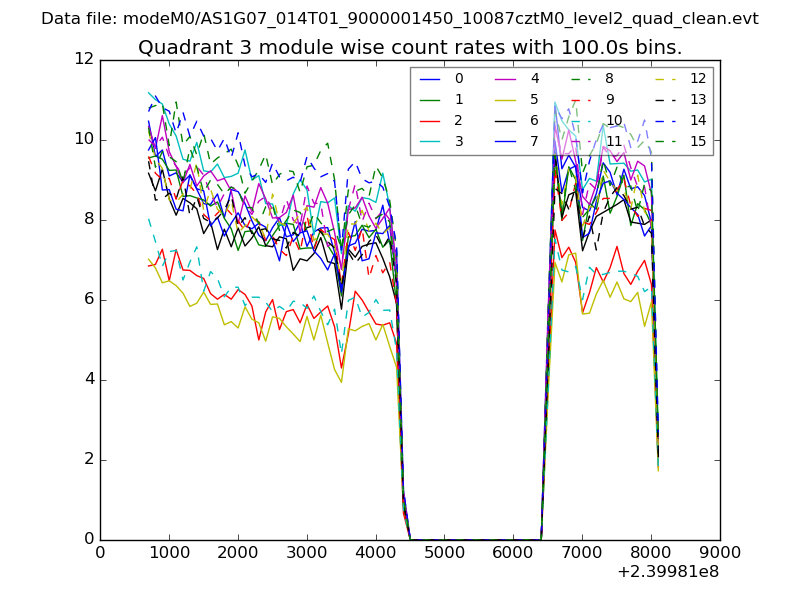 |
 |
| Parameter | Plot |
|---|---|
| CZT HV Monitor | 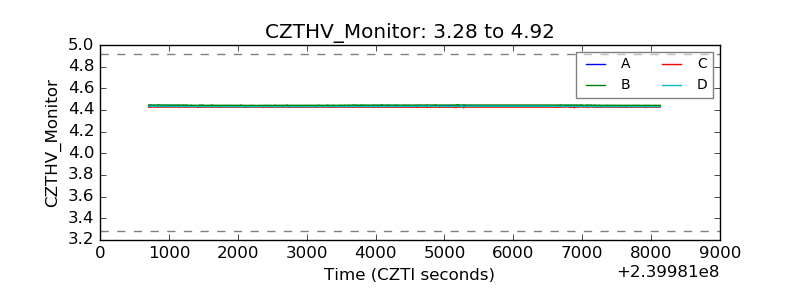 |
| D_VDD | 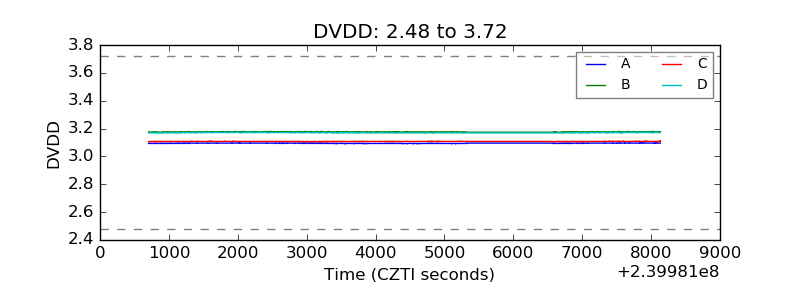 |
| Temperature 1 | 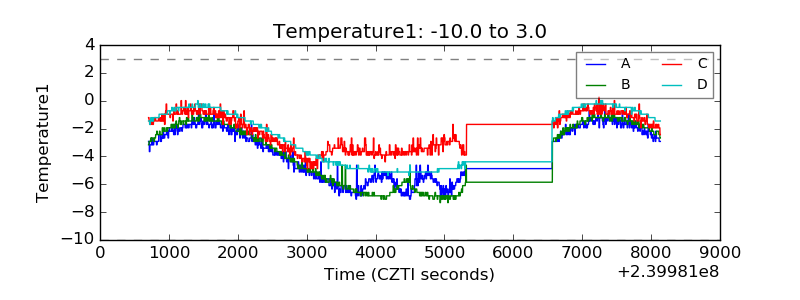 |
| Veto HV Monitor | 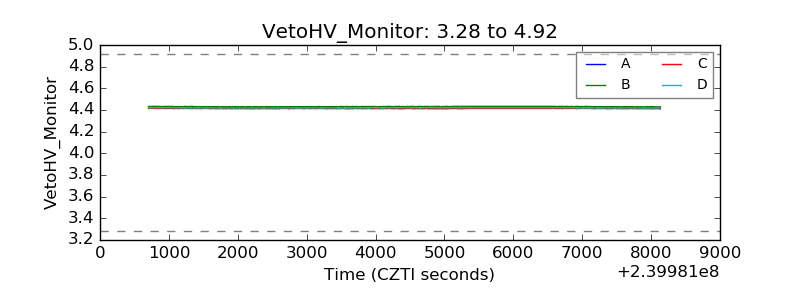 |
| Veto LLD | 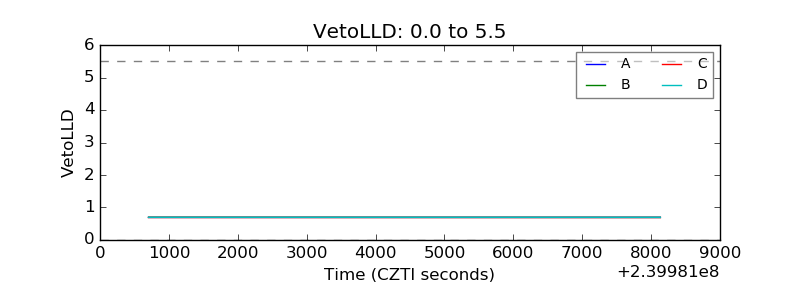 |
| Alpha Counter | 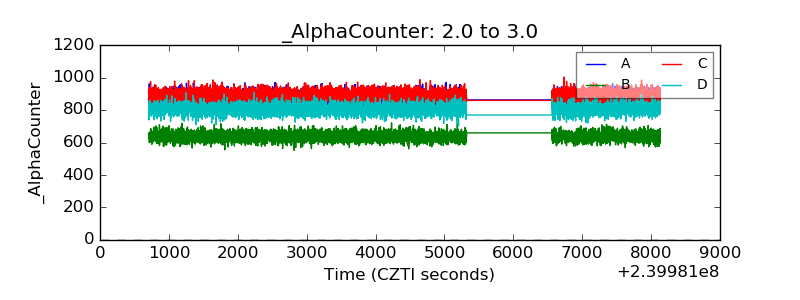 |
| _CPM_Rate | 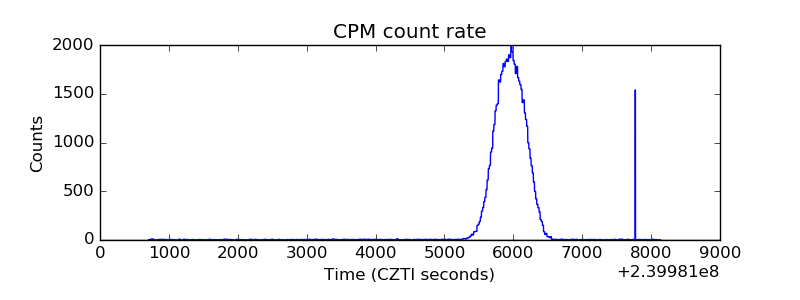 |
| CZT Counter | 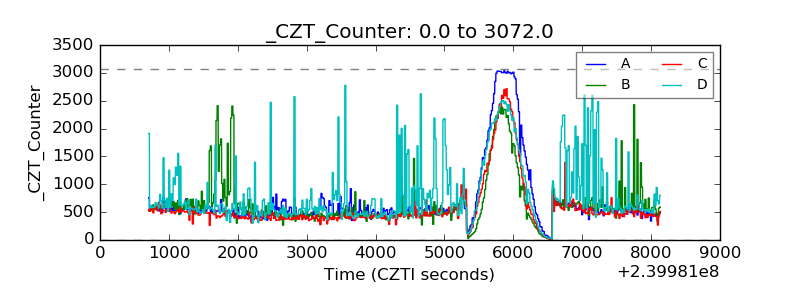 |
| +2.5 Volts monitor | 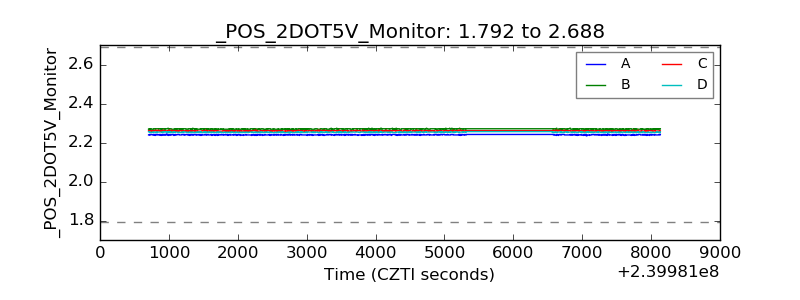 |
| +5 Volts monitor |  |
| _ROLL_ROT | 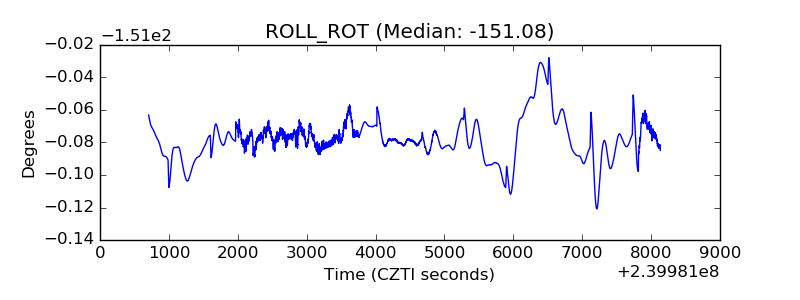 |
| _Roll_DEC | 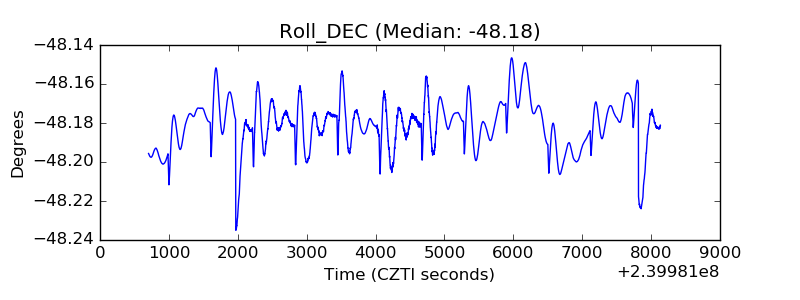 |
| _Roll_RA | 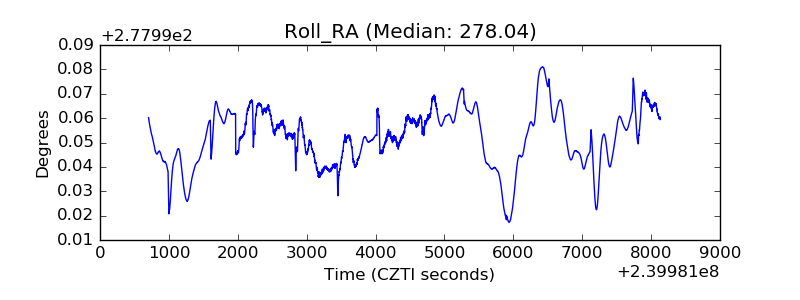 |
| Veto Counter | 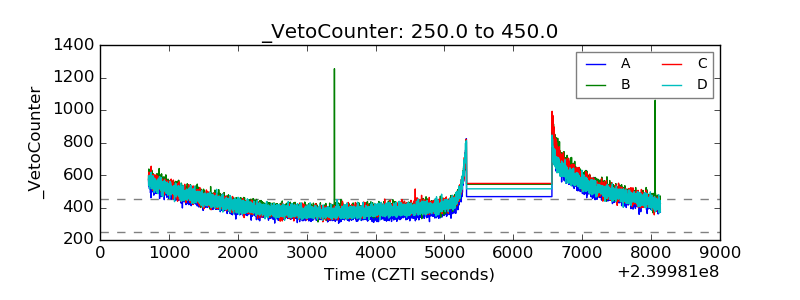 |