| Param | Original file | Final file |
|---|---|---|
| Filename | modeM0/AS1G07_014T01_9000001450_10088cztM0_level2.evt | modeM0/AS1G07_014T01_9000001450_10088cztM0_level2_quad_clean.evt |
| Size (bytes) | 445,573,440 | 95,454,720 |
| Size | 424.9 MB | 91.0 MB |
| Events in quadrant A | 2,815,225 | 632,359 |
| Events in quadrant B | 3,267,961 | 637,373 |
| Events in quadrant C | 2,733,949 | 626,012 |
| Events in quadrant D | 4,277,227 | 583,615 |
| Mode M0 | |||
|---|---|---|---|
| Quadrant | BADHDUFLAG | Total packets | Discarded packets |
| A | 0 | 12241 | 2 |
| B | 0 | 13633 | 1 |
| C | 0 | 12117 | 1 |
| D | 0 | 16537 | 1 |
| Mode SS | |||
|---|---|---|---|
| Quadrant | BADHDUFLAG | Total packets | Discarded packets |
| A | 0 | 120 | 0 |
| B | 0 | 120 | 0 |
| C | 0 | 120 | 0 |
| D | 0 | 120 | 0 |
| Mode M9 | |||
|---|---|---|---|
| Quadrant | BADHDUFLAG | Total packets | Discarded packets |
| A | 0 | 13 | 0 |
| B | 0 | 13 | 0 |
| C | 0 | 13 | 0 |
| D | 0 | 13 | 0 |
| Quadrant | Total seconds | Saturated seconds | Saturation percentage |
|---|---|---|---|
| A | 5886 | 97 | 1.647978% |
| B | 5886 | 114 | 1.936799% |
| C | 5886 | 70 | 1.189263% |
| D | 5886 | 294 | 4.994903% |
Noise dominated data is calculated using 1-second bins in cleaned event files. If a bin has >2000 counts, and if more than 50% of those come from <1% of pixels, then it is considered to be noise-dominated and hence unusable.
| Quadrant | # 1 sec bins | Bins with >0 counts | Bins with >2000 counts | High rate bins dominated by noise | Noise dominated (total time) | Noise dominated (detector-on time) | Marked lightcurve |
|---|---|---|---|---|---|---|---|
| A | 7166 | 5886 | 0 | 0 | 0.00% | 0.00% | 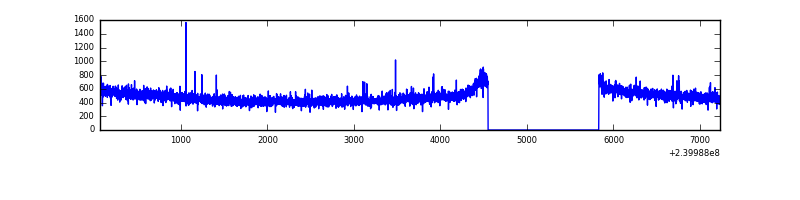 |
| B | 7166 | 5886 | 22 | 22 | 0.31% | 0.37% | 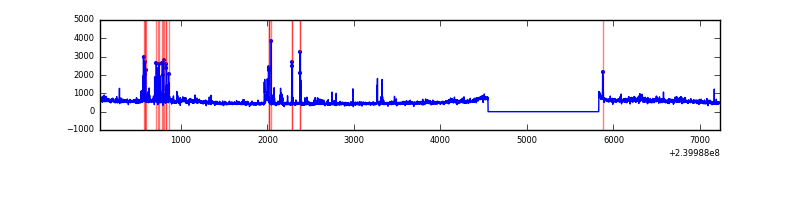 |
| C | 7166 | 5886 | 2 | 2 | 0.03% | 0.03% | 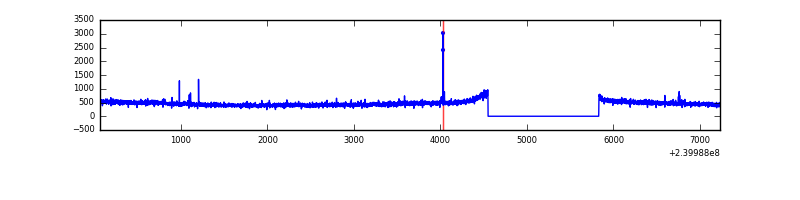 |
| D | 7166 | 5886 | 205 | 205 | 2.86% | 3.48% | 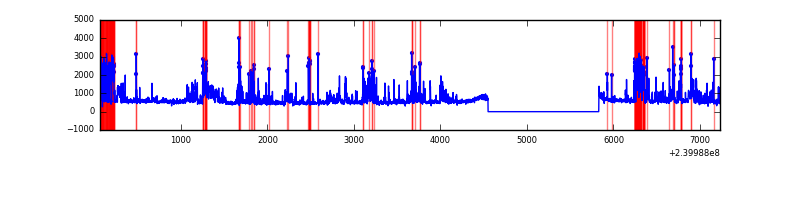 |
Top three noisy pixels from each quadrant. If the there are fewer than three noisy pixels in the level2.evt file, extra rows are filled as -1
| Pixel properties | Quadrant properties | ||||||
|---|---|---|---|---|---|---|---|
| Quadrant | DetID | PixID | Counts | Sigma | Mean | Median | Sigma |
| A | 8 | 15 | 10747 | 68.39 | 725 | 711 | 146.8 |
| A | 0 | 226 | 6990 | 42.79 | 725 | 711 | 146.8 |
| A | 12 | 194 | 6187 | 37.32 | 725 | 711 | 146.8 |
| B | 4 | 81 | 170783 | 1243.98 | 723 | 706 | 136.7 |
| B | 4 | 174 | 141803 | 1032.01 | 723 | 706 | 136.7 |
| B | 4 | 239 | 57370 | 414.45 | 723 | 706 | 136.7 |
| C | 10 | 22 | 13955 | 83.6 | 691 | 695 | 158.6 |
| C | 4 | 175 | 7917 | 45.53 | 691 | 695 | 158.6 |
| C | 14 | 234 | 7856 | 45.15 | 691 | 695 | 158.6 |
| D | 1 | 52 | 549888 | 2992.26 | 681 | 665 | 183.5 |
| D | 8 | 195 | 329377 | 1790.88 | 681 | 665 | 183.5 |
| D | 7 | 71 | 298577 | 1623.08 | 681 | 665 | 183.5 |
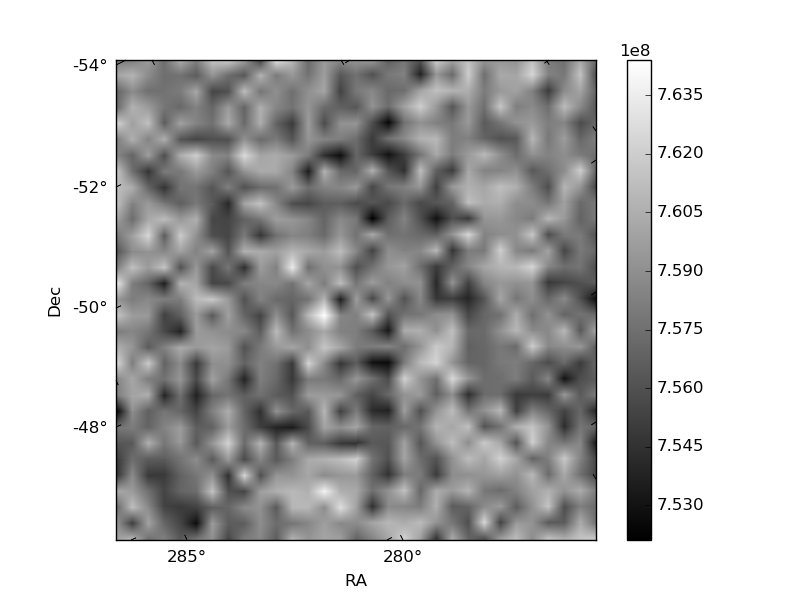
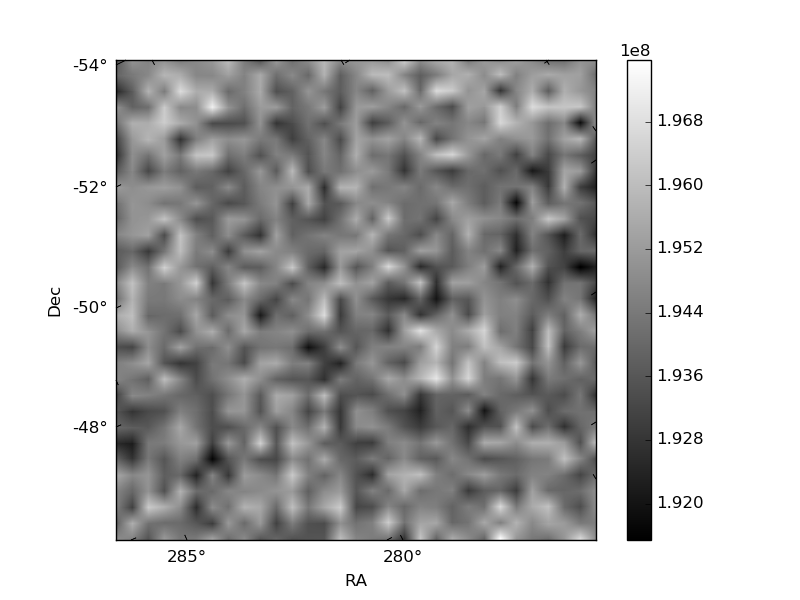
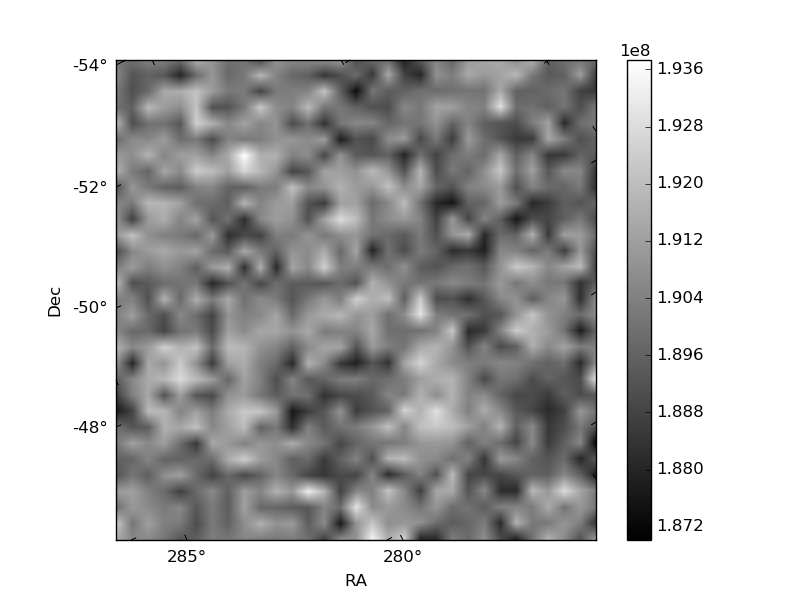
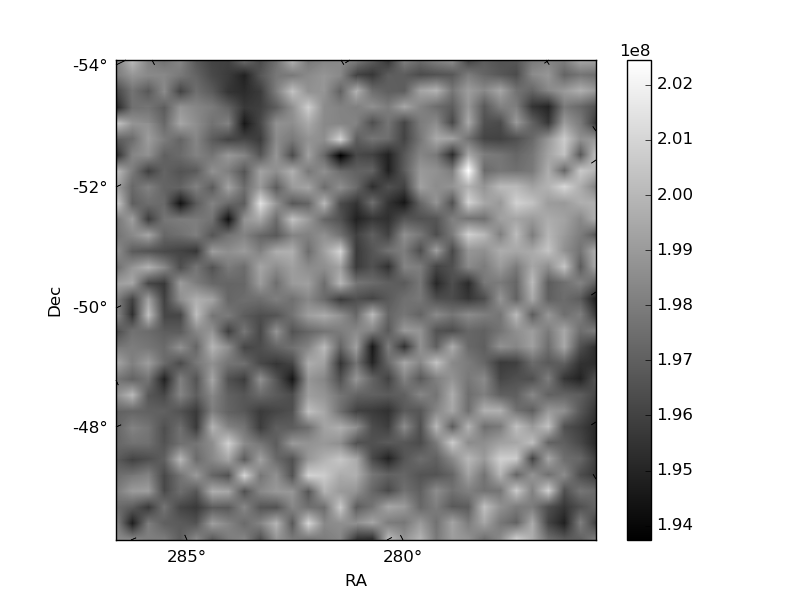
Histogram calculated using DETX and DETY for each event in the final _common_clean file
| Quadrant A | 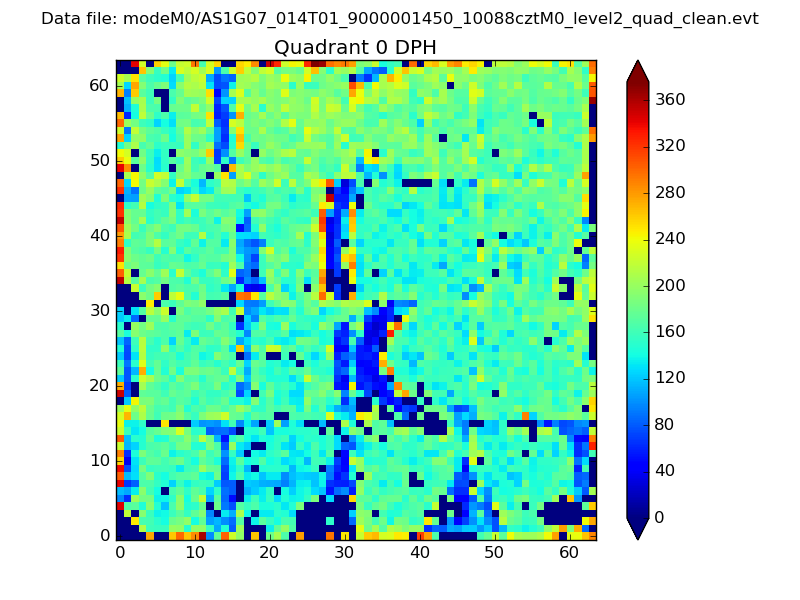 |
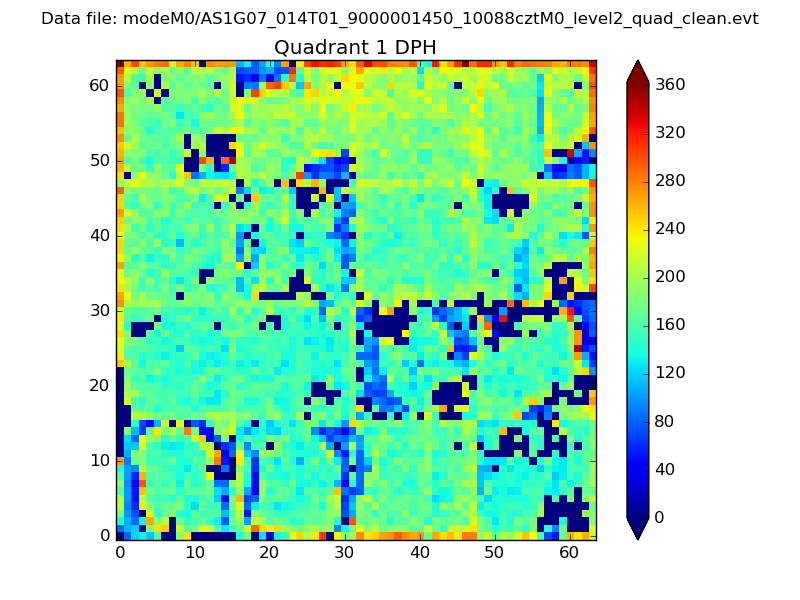 |
Quadrant B |
|---|---|---|---|
| Quadrant D | 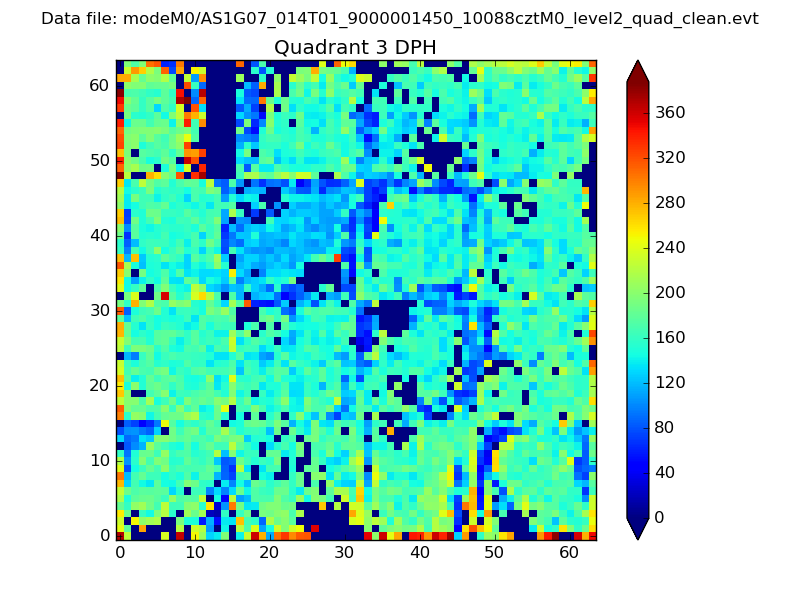 |
 |
Quadrant C |
| Plot type | Count rate plots | Images |
|---|---|---|
| Comparison with Poisson distribution Blue bars denote a histogram of data divided into 1 sec bins. Red curve is a Poisson curve with rate = median count rate of data. |
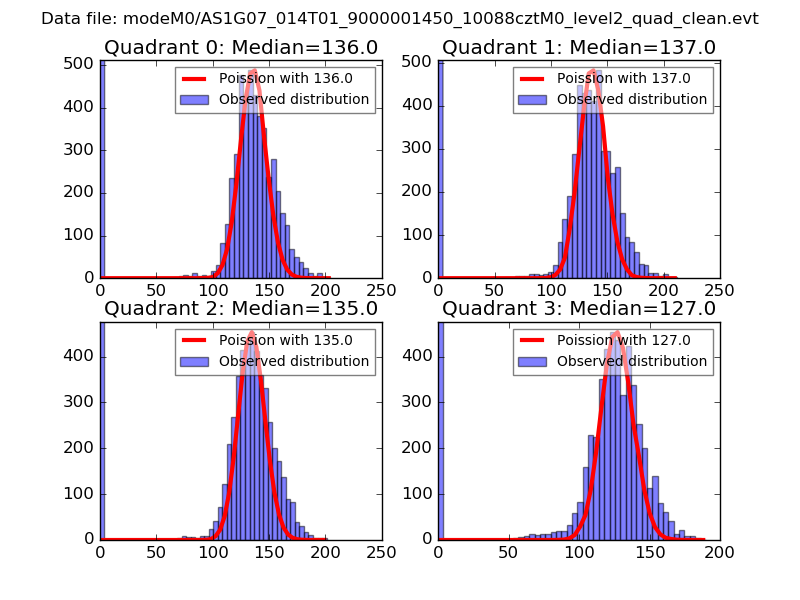 |
 |
| Quadrant-wise count rates Data is divided into 100 sec bins |
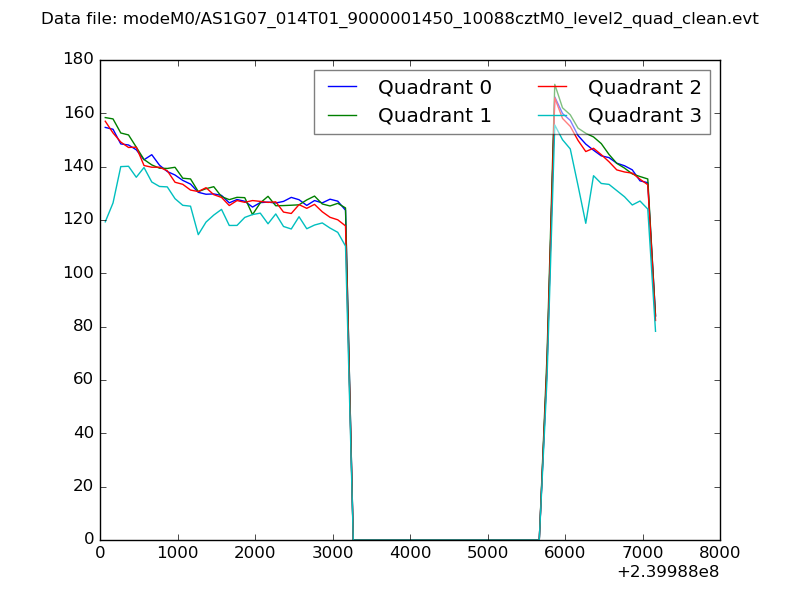 |
|
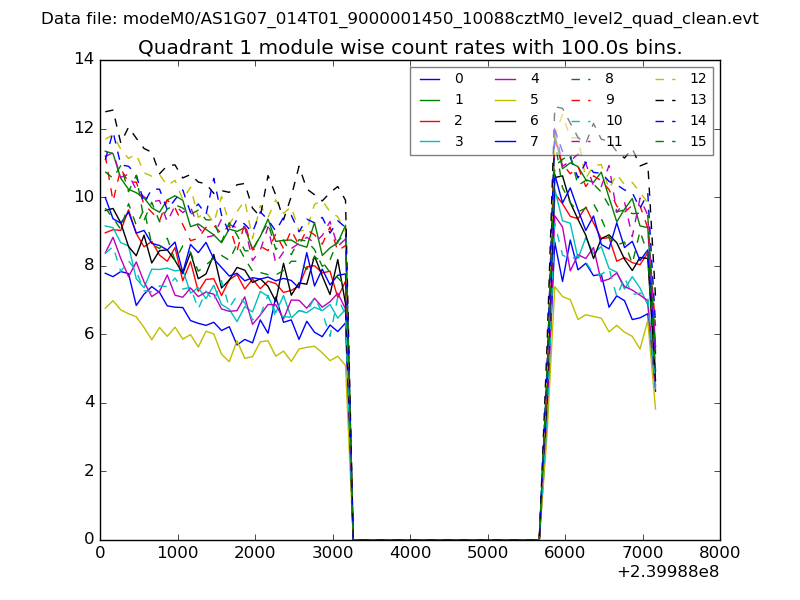
| Module-wise count rates for Quadrant A Data is divided into 100 sec bins |
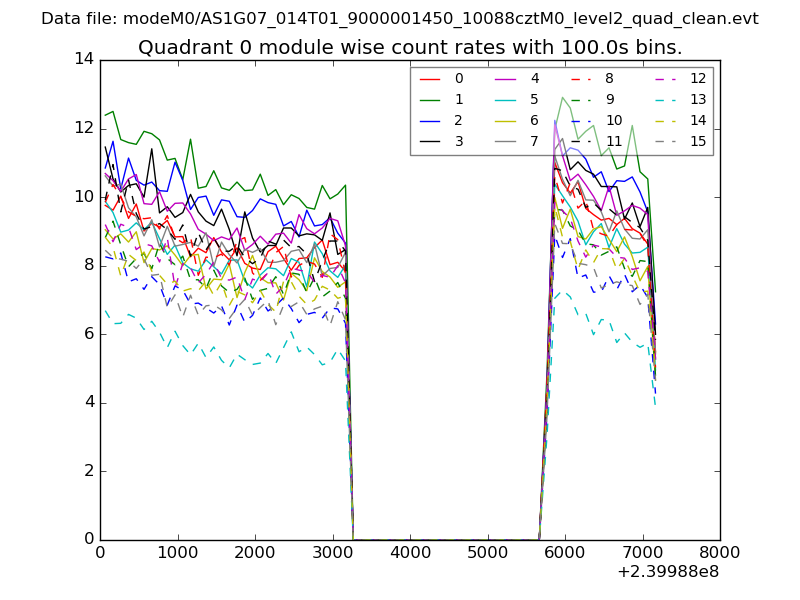 |
 |
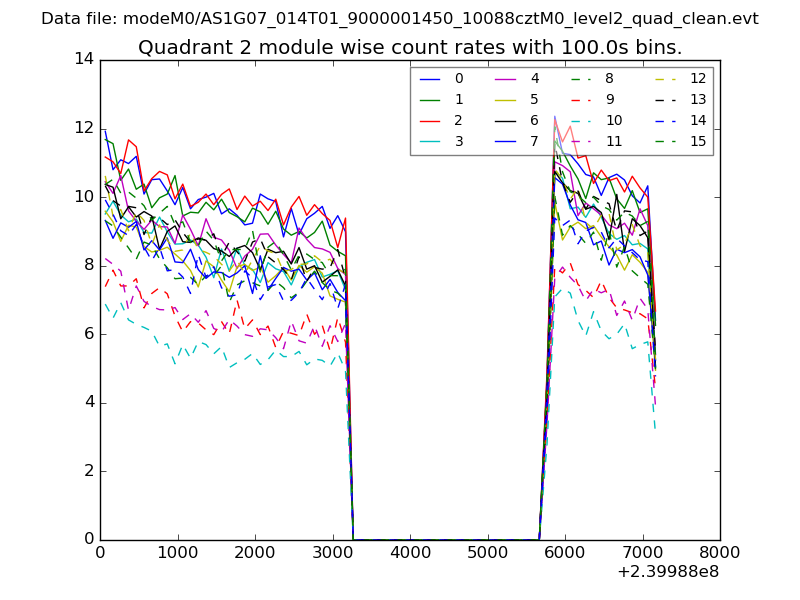
| Module-wise count rates for Quadrant B Data is divided into 100 sec bins |
 |
 |
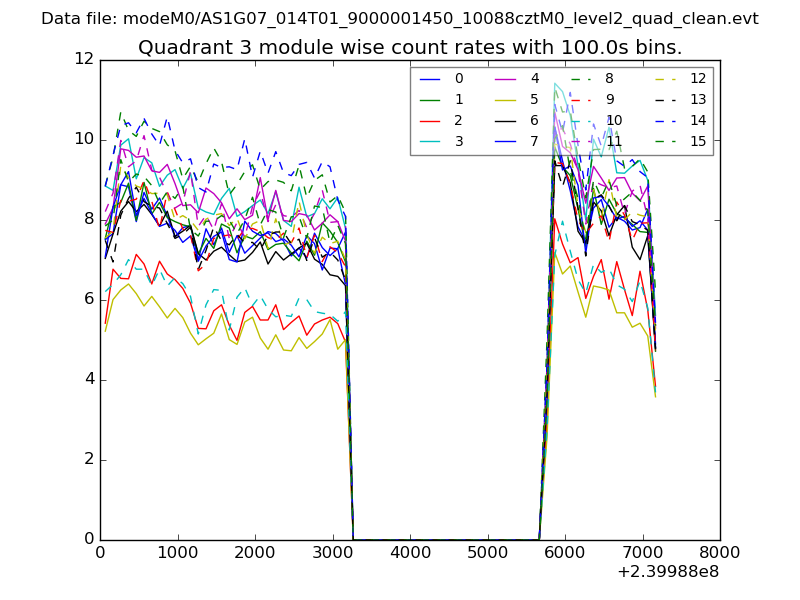
| Module-wise count rates for Quadrant C Data is divided into 100 sec bins |
 |
 |
| Module-wise count rates for Quadrant D Data is divided into 100 sec bins |
 |
 |
| Parameter | Plot |
|---|---|
| CZT HV Monitor | 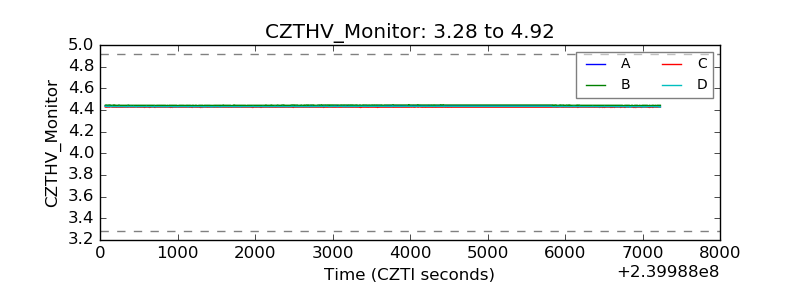 |
| D_VDD | 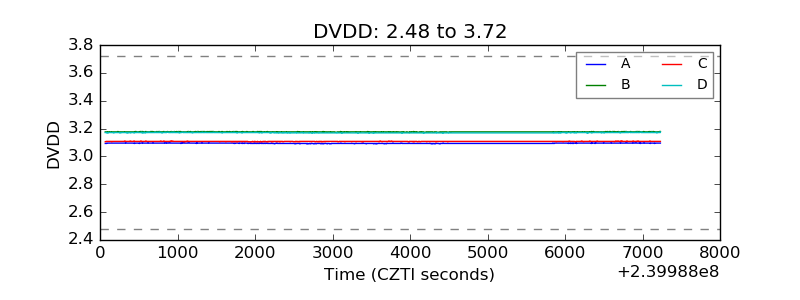 |
| Temperature 1 | 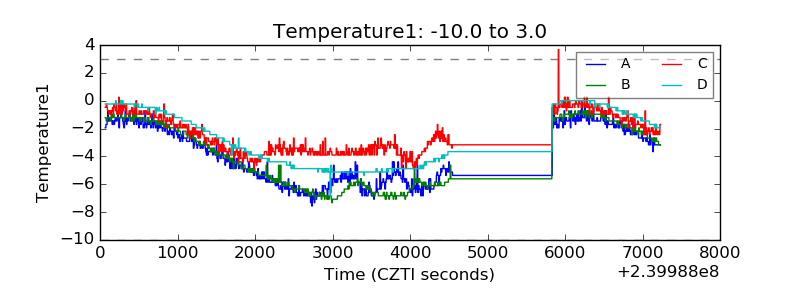 |
| Veto HV Monitor |  |
| Veto LLD | 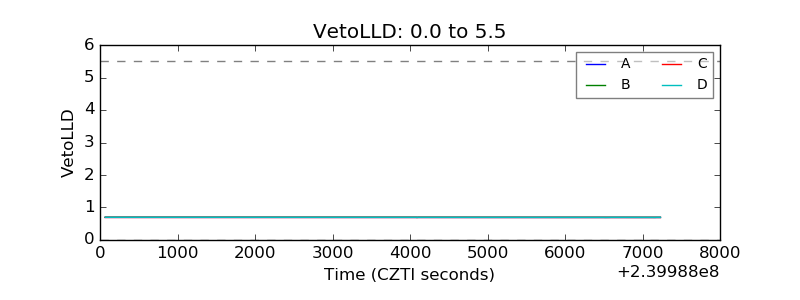 |
| Alpha Counter | 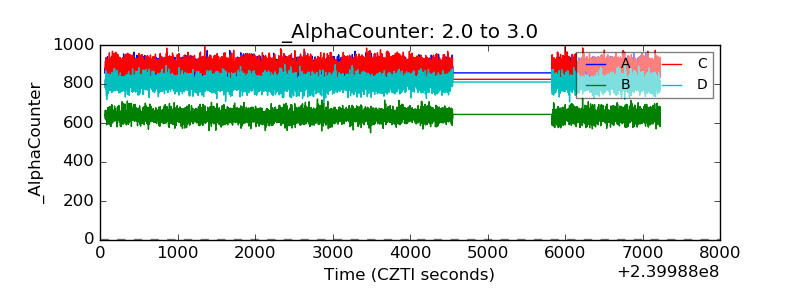 |
| _CPM_Rate | 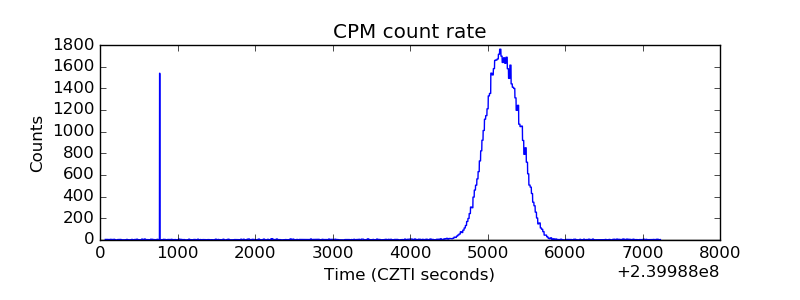 |
| CZT Counter |  |
| +2.5 Volts monitor |  |
| +5 Volts monitor |  |
| _ROLL_ROT | 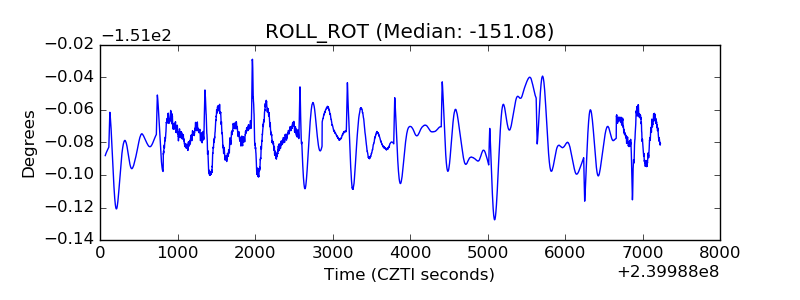 |
| _Roll_DEC | 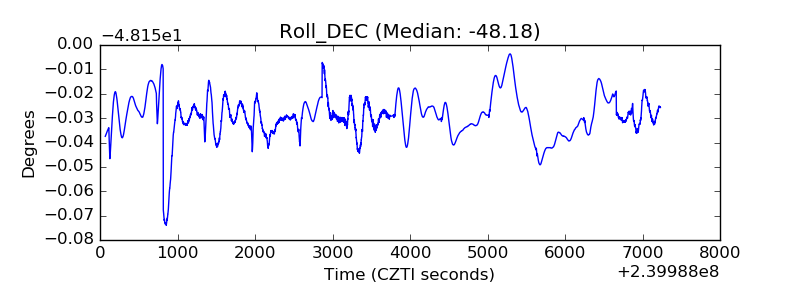 |
| _Roll_RA | 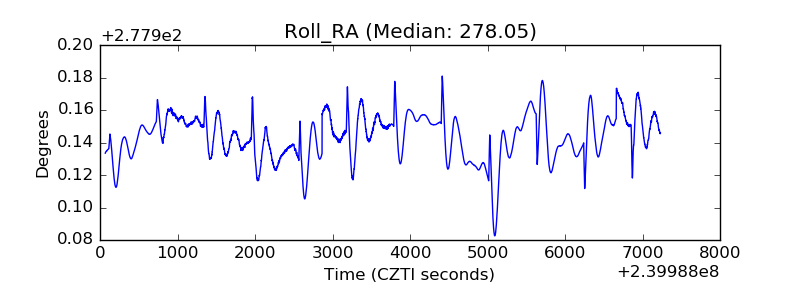 |
| Veto Counter | 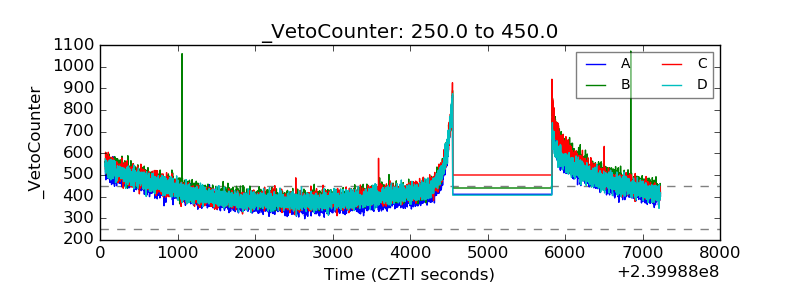 |